1284
Impact of b-value on the estimation of white matter fiber orientation dependent R2*1Institute of Forensic Medicine, Biomedical Engineering, University of Basel, Basel, Switzerland, 2Institute of Forensic Medicine, Health Department Basel-Stadt, Basel, Switzerland, 3Department of Neuroradiology, Medical University of Innsbruck, Innsbruck, Austria
Synopsis
To generate precise diffusion images in post mortem MRI, higher b-values are necessary than for in vivo MRI due to decreased diffusion. In this study, the influence of different b-values on the fiber orientation dependency of R2* was assessed in 12 post mortem and 4 in vivo cases. Our results show that R2* values are higher but their orientation dependency is lower post mortem than in vivo. However, the chosen b-values did not affect the estimation of the white matter fiber angle and, hence, the orientation dependency of R2* for both post mortem in situ and in vivo MRI.
Introduction
R2* is well known to be sensitive to the fiber orientation of white matter with respect to the main magnetic field of the MRI scanner. R2* fiber orientation dependency is related to the structural anisotropy of white matter fibers and the anisotropic magnetic susceptibility of myelin.1,2 The white matter fiber orientation is commonly estimated using DTI, due to restricted possibility to reorient the head post mortem in situ and in vivo. For precise measurements of water diffusion in the human brain, an appropriate set of b-values has to be chosen. As b ≈ 1/MD (MD: mean diffusivity) can be used as a rule of thumb, higher b-values are necessary for post mortem than for in vivo imaging.3,4 Besides, the chosen b-value has an impact on the apparent fiber density.5 Therefore, the goal of this study was to investigate which b-values are suitable to determine the fiber orientation and if this choice influences the orientation dependent R2* for post mortem in situ and in vivo MRI scans.Methods
For this study, 12 post mortem in situ (age: 59.4 ± 15.2 years) and 4 in vivo (age: 29.5 ± 5.6 years) MRI cases were scanned at 3 T. A multi-echo gradient echo sequence (12 TEs = 5.79-50.94 ms, TR = 68 ms, 40 slices, slice thickness: 4 mm, in-plane resolution: 1x1 mm2) and a diffusion-weighted single-shot echo-planar imaging (64 isotropically distributed diffusion directions, TE = 109 ms, TR = 18700 ms, 100 slices, isotropic resolution of 1.8 mm3) with suitable b-values for deceased (b = 2000, 6000 and 9000 s/mm2) and living controls (b = 800 and 2000 s/mm2) were conducted. The white matter fiber orientation was determined as the angle (θ) between the main magnetic field and the first eigenvector of the DTI analysis. R2* was plotted as function of fiber angle in intervals of 5° to the entire white matter. To test for significant differences of the white matter MD and fractional anisotropy (FA) between post mortem and in vivo for b = 2000 s/mm2 as well as between the different b-values, the Welch test was applied for the normally distributed data.Results
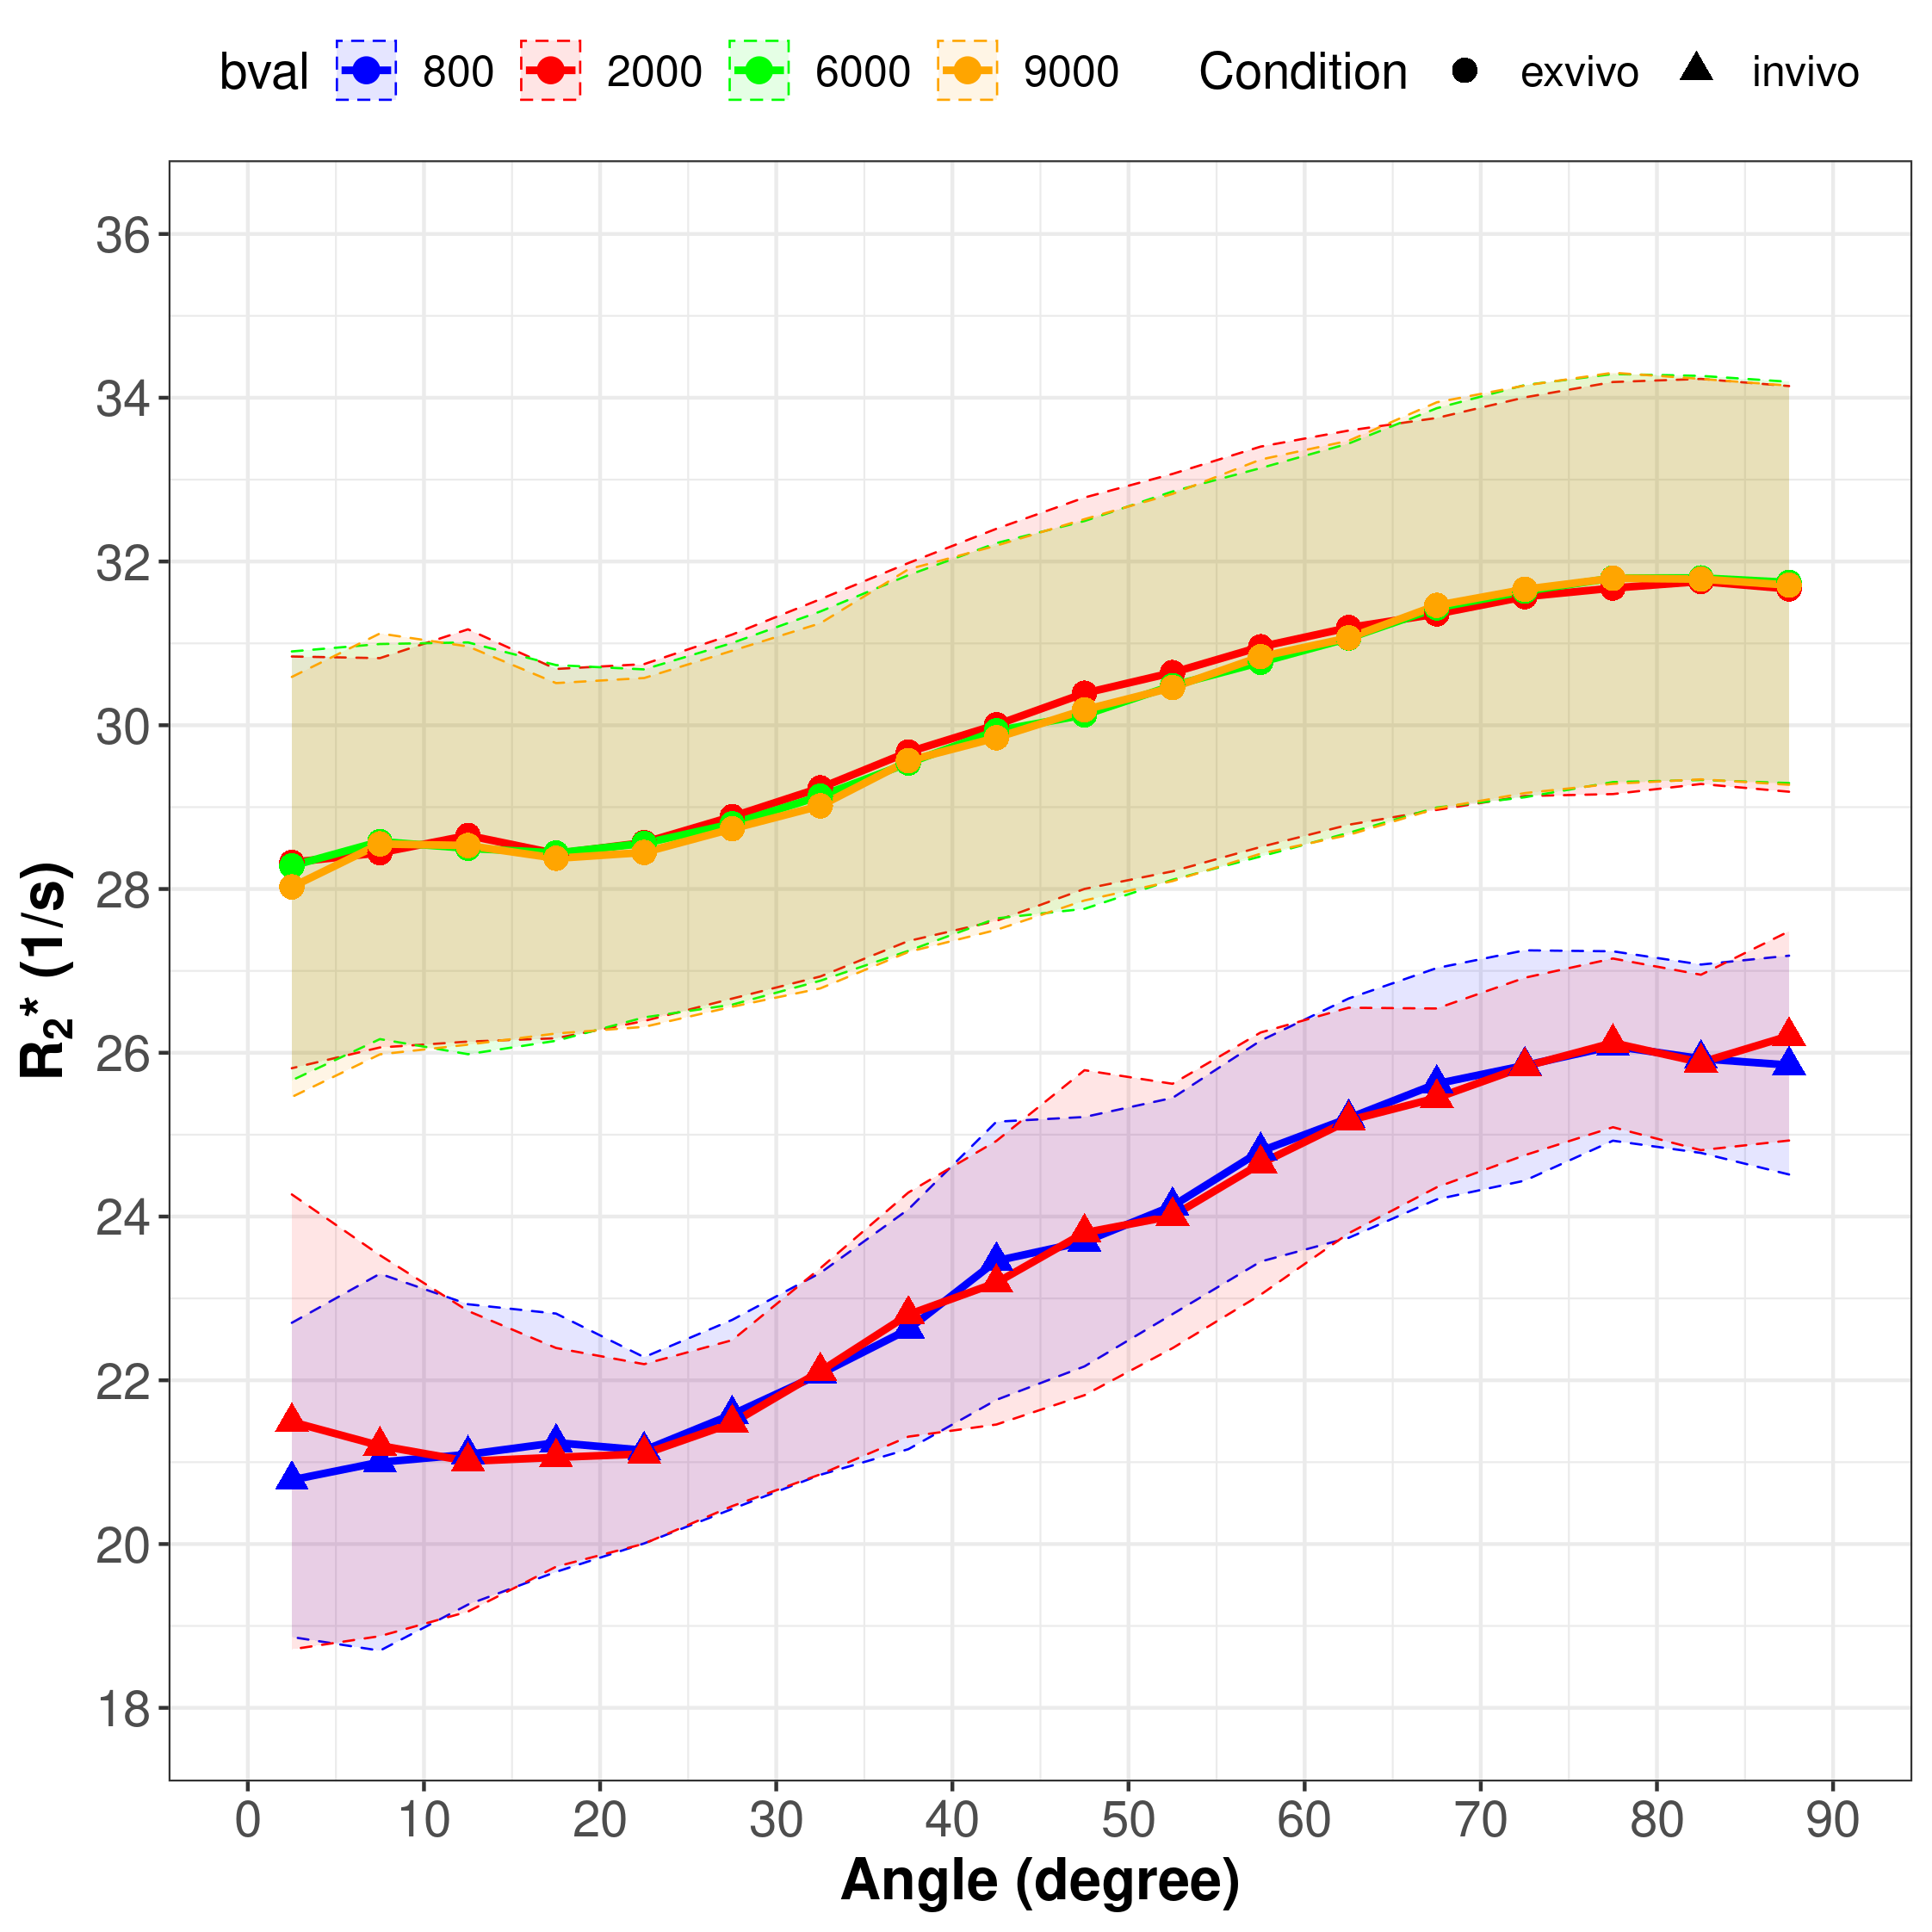
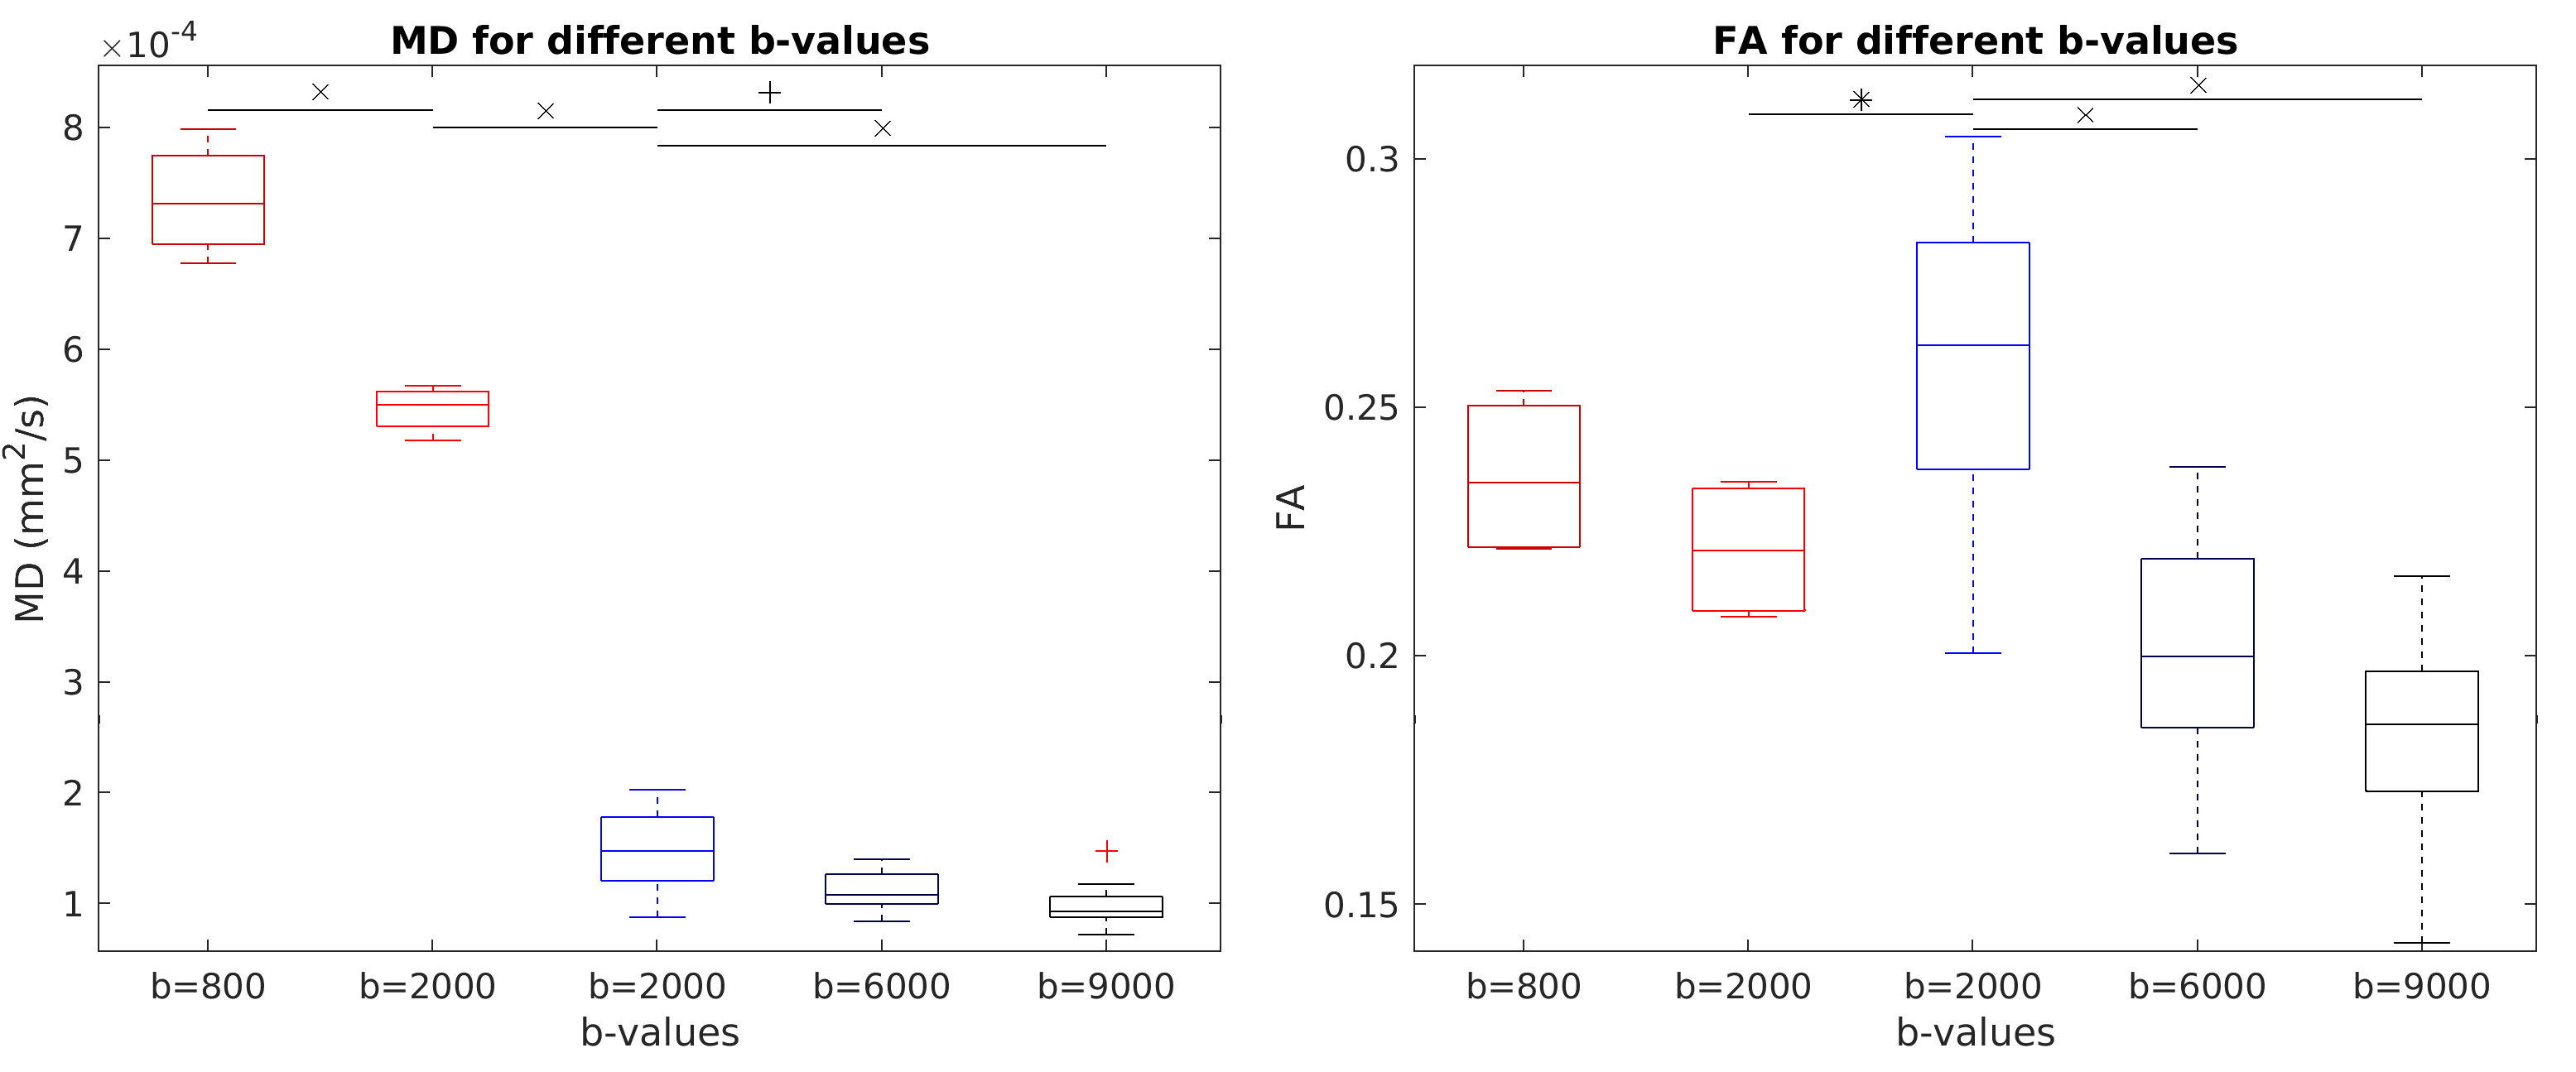
The relation between the white matter fiber angle and R2* for b-values of 2000, 6000 and 9000 s/mm2 for post mortem cases and of 800 and 2000 s/mm2 for in vivo cases are shown in Figure 1. In general, the orientation dependency is lower post mortem than in vivo, but in both cases R2* increases with increasing fiber angle. Independently of the applied b-values, global white matter R2* is higher post mortem than in vivo. No difference in R2* orientation dependency was observed between the 3 b-values used post mortem and the 2 b-values used in vivo. A comparison of MD and FA for different b-values is given in Figure 2 with the indication of significant results. When using b = 2000 s/mm2, the MD value post mortem was significantly lower compared to in vivo conditions (mean of post mortem: 1.50 * 10-4 ± 0.35 * 10-4 mm2/s; Mean of in vivo: 5.46 * 10-4 ± 0.21 * 10-4 mm2/s; p < 0.001), while a less significant difference in FA values could be observed (mean of post mortem: 0.26 ± 0.03; Mean of in vivo: 0.22 ± 0.01; p < 0.05). The mean MD and FA values for post mortem cases scanned with b = 6000 s/mm2 (MD: 1.12 * 10-4 ± 0.17 * 10-4 mm2/s; FA: 0.20 ± 0.02; p < 0.01 for MD; p < 0.001 for FA) and b = 9000 s/mm2 (MD: 0.98 * 10-4 ± 0.20 * 10-4 mm2/s; FA: 0.18 ± 0.02; p < 0.001 for MD and FA) were each statistically significant different from the b = 2000 s/mm2 scans. Furthermore, the MD of in vivo cases were significantly lower when applying b = 2000 s/mm2 (5.46 * 10-4 ± 0.21 * 10-4 mm2/s) compared to b = 800 s/mm2 (7.35 * 10-4 ± 0.52 * 10-4 mm2/s; p < 0.001).Discussion
By comparing different b-values, used for the estimation of the fiber angle, no effect on the calculated orientation dependency of R2* could be observed. The degree of diffusion weighting does not seem to effect the calculated white matter angle as all applied b-values yielded similar results for measuring the white matter anisotropy. In contrast, MD and FA are dependent on the applied b-value as was already shown for the apparent fiber density.5 Additionally, we demonstrated that MD is strongly reduced post mortem compared to in vivo while FA is less affected. Various factors may have an impact on the different orientation dependency of R2* of post mortem and in vivo scans. For example, the lower R2* fiber orientation dependency in post mortem cases can be caused by the decreased brain temperature, the reduced diffusion or by the white matter decomposition after death.6Conclusion
The choice of b-values has no influence on the estimation of orientation dependent R2* For comparability reasons, we recommend using b = 2000 s/mm2 as this value is suitable both for post mortem in situ and in vivo MRI scans.Acknowledgements
No acknowledgement found.References
1 Wharton S, Bowtell R. Fiber orientation-dependent white matter contrast in gradient echo MRI. Proc. Natl. Acad. Sci. U. S. A. 2012;109:18559–18564 doi: 10.1073/pnas.1211075109.
2 Lee J, Nam Y, Choi JY, Kim EY, Oh SH, Kim DH. Mechanisms of T2* anisotropy and gradient echo myelin water imaging. NMR Biomed. 2017;30 doi: 10.1002/nbm.3513.
3 Jones DK, Horsfield MA, Simmons A. Optimal strategies for measuring diffusion in anisotropic systems by magnetic resonance imaging. Magn. Reson. Med. 1999;42:515–525 doi: 10.1002/(SICI)1522-2594(199909)42:3<515::AID-MRM14>3.0.CO;2-Q.
4 Scheurer E, Lovblad KO, Kreis R, et al. Forensic application of postmortem diffusion-weighted and diffusion tensor MR imaging of the human brain in situ. Am. J. Neuroradiol. 2011;32:1518–1524 doi: 10.3174/ajnr.A2508.
5 Genc, Sila et al. Impact of b-value on estimates of apparent fibre density. Human brain mapping vol. 41,10 (2020): 2583-2595. doi:10.1002/hbm.24964
6 Oh SH, Kim YB, Cho ZH, Lee J. Origin of B0 orientation dependent R2* (=1/T2*) in white matter. Neuroimage 2013;73:71–79 doi: 10.1016/j.neuroimage.2013.01.051.
Figures