1283
Combined cluster analysis of time evolution and tissue type with total variation denoising (CCTV) for QQ-based oxygen extract fraction mapping1Radiology, Weill Cornell Medicine, New York, NY, United States, 2Biomedical Engineering, Cornell University, Ithaca, NY, United States
Synopsis
A Combined Cluster analysis of time evolution and tissue type with Total Variation denoising (CCTV) was developed to suppress noise propagation in oxygen extraction fraction (OEF) maps based on the QSM+qBOLD (QQ) model of multi-echo gradient echo data without vascular challenge. Compared to cluster analysis of time evolution (CAT), the developed CCTV provided more accurate OEF in simulation and greater contrast to noise ratio between lesion and its healthy contralateral side in ischemic stroke patients.
Introduction
Oxygen extraction fraction (OEF) is a crucial biomarker to assess brain tissue viability and function in various neurologic disorders1-3. A recent integrated model of QSM and qBOLD (QSM+qBOLD or QQ) can map OEF by utilizing both the magnitude and phase of multi-echo gradient echo (mGRE) data4. This method does not require any vascular challenge and therefore has a great potential in clinical applications. To overcome the noise sensitivity of QQ due to its non-convex inversion, the cluster analysis of time evolution (CAT) algorithm has been introduced leading to a significant improvement of effective SNR5-8. To further suppress noise propagation on OEF, we integrate tissue-type information with CAT for improved clustering and apply total variation regularization.Theory and Methods
For OEF estimation, $$$OEF=1-Y/Y_{a}$$$ where $$$Y$$$ and $$$Y_{a}$$$ (=0.984) are the venous and arterial oxygenation, QQ model combines QSM (phase analysis) and qBOLD (magnitude analysis) with a priori regulation $$$R$$$. $${argmin}_{Y,v,R_{2},S_{0},\chi_{nb}}\left\{w||\chi-F_{QSM}\left(Y,v,\chi_{nb}\right)||^{2}_{2}+\sum_j|||S_{j}|-F_{qBOLD}\left(S_{0},Y,v,R_{2},\chi_{nt},t_{j}\right)||^{2}_{2}+R(Y)\right\}$$ The first term divides voxel-wise susceptibility ($$$\chi$$$) into deoxyhemoglobin in venous blood, i.e. OEF effect, and non-blood tissue susceptibility ($$$\chi_{nb}$$$), referenced to fully oxygenated arterial blood $$$\chi_{ba}=-108.3$$$ ppb9. $$F_{QSM}\left(Y,v,\chi_{nb}\right)=\left[\frac{\chi_{ba}}{\alpha}+\psi_{Hb}\cdot\Delta\chi_{Hb}\cdot\left(-Y+\frac{1-\left(1-\alpha\right)\cdot Y_{a}}{\alpha}\right)\right]\cdot v+\left(1-\frac{v}{\alpha}\right)\cdot \chi_{nb}$$ where $$$\alpha = 0.77$$$10 and $$$\psi_{Hb}=0.090$$$ assuming Hct =0.35711-14, $$$\Delta \chi_{Hb}=12522$$$ ppb between deoxy- and oxy- hemoglobin15,16.The second term applies qBOLD model to magnitude signal, $$$|S_{j}|$$$, at the jth echo4:$$F_{qBOLD}\left(S_{0},Y,v,R_{2},\chi_{nb},t_{j}\right)=S_{0}\cdot e^{-R_{2}\cdot t_{j}}\cdot F_{BOLD}\left(Y,v,\chi_{nb},t_{j}\right)\cdot G(t_{j})$$ where $$$F_{BOLD}$$$ is the deoxygenated blood effect inside the voxel: $$$F_{BOLD}\left(y,v,\chi_{nb},t_{j}\right)=exp\left[-v\cdot f_{s}\left(\delta\omega\cdot t_{j}\right)\right]$$$17, where $$$f_{s}$$$ is the signal decay by the blood vessel network18, and $$$\delta\omega\left(Y,\chi_{nb}\right)=\frac{1}{3}\cdot \gamma \cdot B_{0}\cdot \left[Hct\cdot \Delta\chi_{0}\cdot \left(1-Y\right)+\chi_{ba}-\chi_{nb}\right]$$$4 with $$$\gamma$$$=267.513MHz/T, $$$B_{0}$$$ main magnetic field, Hct=0.35711, $$$\Delta\chi_{0}$$$ the susceptibility difference between fully oxygenated and deoxygenated red blood cells ($$$4\pi\ \times 0.27$$$ppm)19 and $$$G\left(t_{j}\right)$$$ is a macroscopic field effect4. In the current cluster analysis of time evolution (CAT), the voxels with similar signal time evolution ($$$\frac{F_{qBOLD}}{G}$$$) form a cluster and are assumed to have similar tissue parameters ($$$Y,v,\chi_{nb}$$$) for SNR improvement and $$$R\left(Y\right)=\lambda\left(\overline{OEF\left(Y\right)}-OEF_{wb}\right)^{2}$$$ is used for the regularization that the whole brain average OEF, $$$\overline{OEF\left(Y\right)}$$$, should be similar to the brain OEF value estimated from the main draining vein, the straight sinus $$$OEF_{wb}$$$, $$$\lambda$$$ is regularization weighting that was chosen using L-curve analysis20.
Combined cluster analysis of time evolution and tissue-type with total variation denoising (CCTV)
Tissue type information is incorporated into clusters obtained from CAT by dividing each cluster into its gray matter, white matter, and cerebrospinal fluid sub-components, the segmentations of which were obtained by using FSL FAST21 on T1-weighted image, for improving clustering and subsequent optimization initial guess. In addition, the total variation regularization, $$$R\left(Y\right)=\lambda ||\triangledown Y||_{1}$$$, is used for effective denoising22 instead of the whole brain OEF average regularization used in CAT.
Validation
QQ-CAT and QQ-CCTV were compared with 1) a simulated stroke brain constructed in the same way as Numerical Simulation 2 in 23 with SNR 20 (5 trials at the same noise level) and QQ-CCTV result as ground truth, and 2) 30 real ischemic stroke patient data used in 8 in which 3D ASL (24 cm FOV, 1.9x1.9x2.0 mm3 voxel size, 1500 ms labeling period, 1525 ms post-label delay), 3D mGRE (0.47x0.47x2.0 mm3 voxel size, TE1/ΔTE/TE8 = 4.5/5/39.5 ms, TR= 42.8 ms), DWI (0.94x0.94x3.2 mm3 voxel size, 0, 1000 s/mm2 b-values), and T1-weighted image (0.5x0.5x2 mm3 voxel size, TE=23.4 ms, TR=2992.3 ms, TI= 869.1 ms) was acquired. In simulation, the accuracy and precision was measured by mean absolute error ($$$MAE\equiv \frac{1}{N_{v}}\sum_{i=1}^{N_{v}}\left|OEF_{truth}-OEF_{avg}\right|$$$) and mean standard deviation ($$$MSD\equiv \frac{1}{N_{v}}\sum_{i=1}^{N_v}OEF_{std}$$$) where $$$OEF_{avg}\equiv \frac{1}{N_t}\sum_{j=1}^{N_{t}}OEF_{i,j}$$$, $$$OEF_{std}\equiv \sqrt{\frac{1}{N_{t}}\sum_{j=1}^{N_{t}}\left(OEF_{i,j}-\frac{1}{N_{t}}\sum_{j=}^{N_{t}}OEF_{i,j}\right)^{2}}$$$, $$$i$$$: the voxel index, $$$j$$$: the trial index, $$$N_{v}$$$: the number of voxels, $$$N_{t}$$$: the number of trials. In the stroke cases, the lesion OEF values are referenced to the one in the contralateral side ($$$\overline{OEF_{lesion}}-\overline{OEF_{mirror}}$$$) and the detectability of lesion OEF abnormality was measured by the contrast to noise ratio between lesion and contralateral side ($$$CNR\equiv\frac{|\overline{OEF_{lesion}}-\overline{OEF_{mirror}}|}{\sigma\left(OEF_{mirror}\right)}$$$) assuming the OEF variation within the contralateral side is originated from the noise.
Result
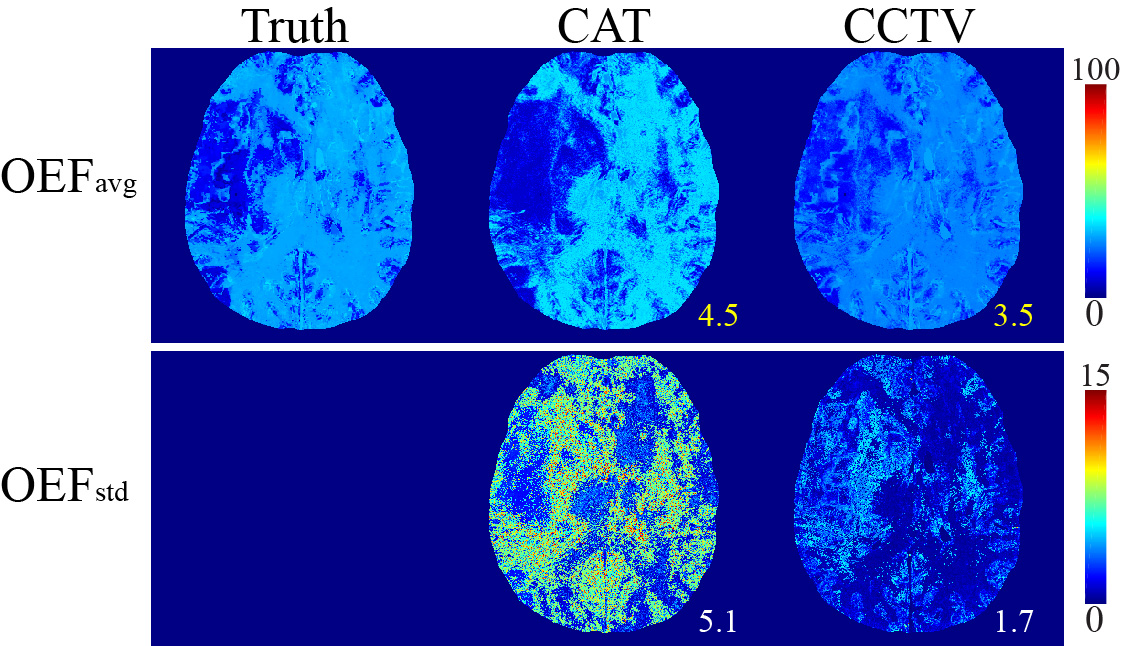
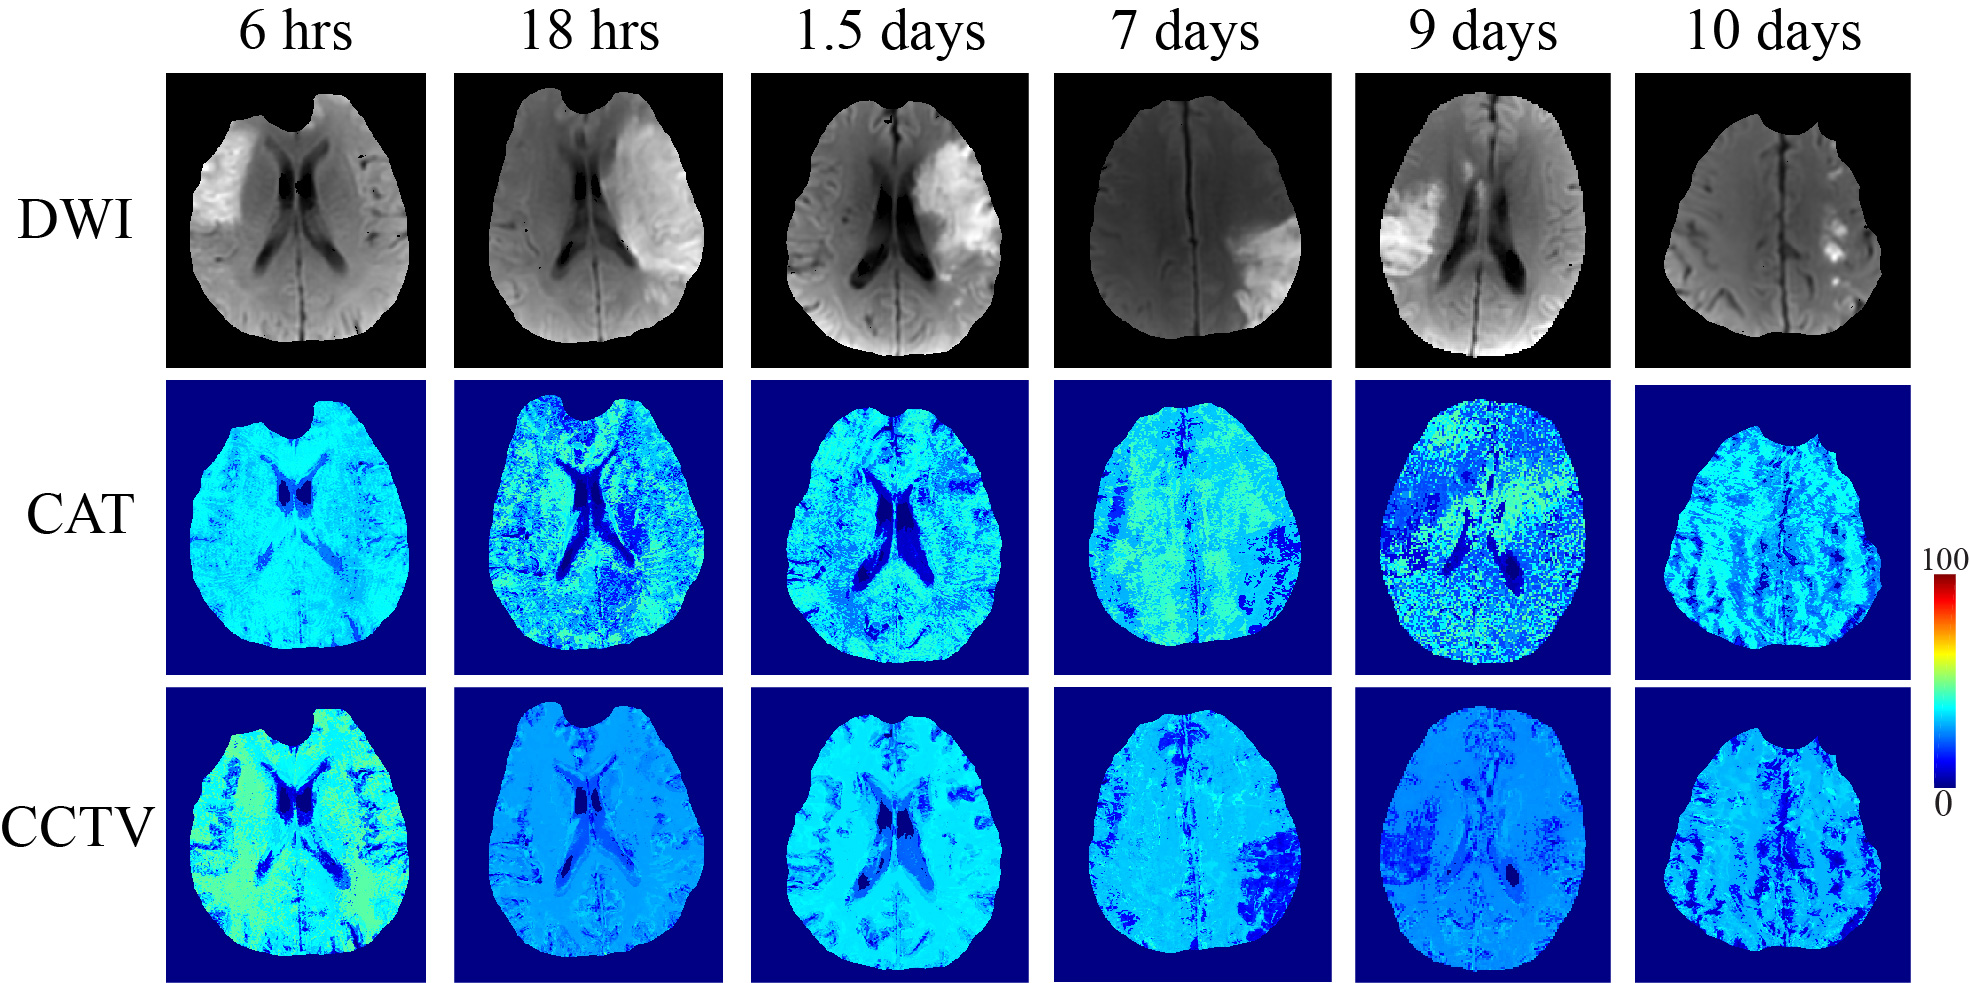
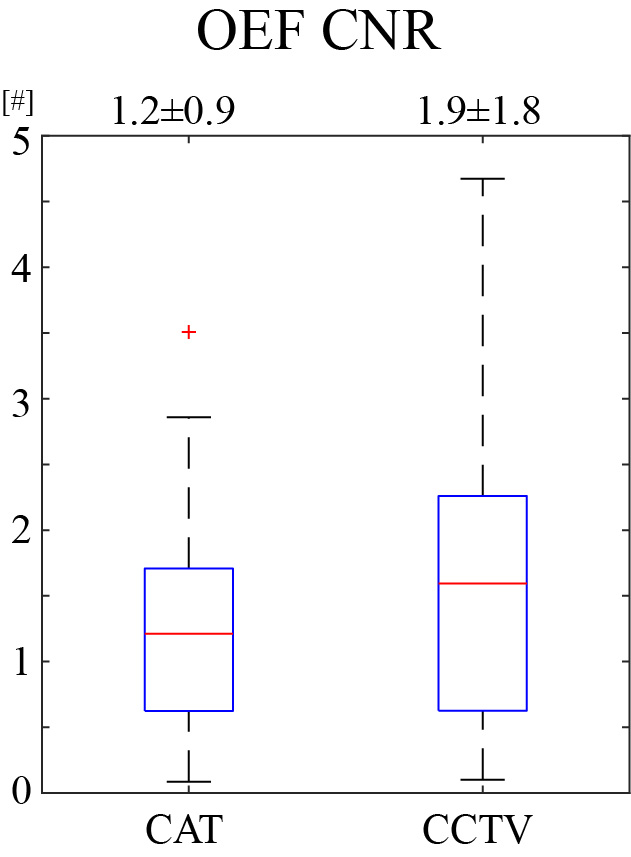
Compared to QQ-CAT, QQ-CCTV showed more accurate OEF results in simulation (Figure 1) with smaller MAE (4.5% vs. 3.5%) and smaller MSD (5.1% vs. 1.7%): QQ-CCTV provided 1) $$$OEF_{avg}$$$ map which better depicted the spatial OEF variation and 2) smaller $$$OEF_{std}$$$ map (Figure 2). In the 30 stroke patients, QQ-CCTV generally showed less noisy and more uniform OEF maps than QQ-CAT (Figure 2). In the 7 and 9 day post-onset cases, low OEF regions from QQ-CCTV agreed better with DWI-defined lesion. QQ-CCTV provided significantly greater CNR: 1.9±1.8 vs. 1.2±0.9 (p=0.04, paired t-test) (Figure 3).Discussion
QQ-CCTV shows generally more uniform OEF except in stroke lesions (Figure 2), which agrees with previous PET studies24,25. The higher OEF CNR in QQ-CCTV, which may be caused by noise reduction in OEF maps, suggests better lesion OEF abnormality detection (Figure 3).Conclusion
With the improved accuracy by the integrated temporal and tissue-type clustering and total variation denoising, the proposed QQ-CCTV can be readily applied to study tissue viability in various neurologic disorders, such as Alzheimer’s disease26, 27, multiple sclerosis28, tumor29, and ischemic stroke30.Acknowledgements
No acknowledgement found.References
1. Derdeyn CP, Videen TO, Yundt KD, et al. Variability of cerebral blood volume and oxygen extraction: stages of cerebral haemodynamic impairment revisited. Brain 2002; 125: 595-607.
2. Gupta A, Chazen JL, Hartman M, et al. Cerebrovascular reserve and stroke risk in patients with carotid stenosis or occlusion: a systematic review and meta-analysis. Stroke 2012; 43: 2884-2891.
3. Gupta A, Baradaran H, Schweitzer AD, et al. Oxygen Extraction Fraction and Stroke Risk in Patients with Carotid Stenosis or Occlusion: A Systematic Review and Meta-Analysis. American Journal of Neuroradiology 2014; 35: 250-255.
4. Cho J, Kee Y, Spincemaille P, et al. Cerebral metabolic rate of oxygen (CMRO2) mapping by combining quantitative susceptibility mapping (QSM) and quantitative blood oxygenation level-dependent imaging (qBOLD). Magnetic resonance in medicine 2018; 80: 1595-1604.
5. Cho J, Zhang S, Kee Y, et al. Cluster analysis of time evolution (CAT) for quantitative susceptibility mapping (QSM) and quantitative blood oxygen level-dependent magnitude (qBOLD)-based oxygen extraction fraction (OEF) and cerebral metabolic rate of oxygen (CMRO2) mapping. Magnetic Resonance in Medicine; 0.
6. Cho J, Lee J, An H, et al. Cerebral oxygen extraction fraction (OEF): Comparison of challenge-free gradient echo QSM+qBOLD (QQ) with 15O PET in healthy adults. Journal of Cerebral Blood Flow & Metabolism 2020: 0271678X20973951.
7. Cho J, Ma Y, Spincemaille P, et al. Cerebral oxygen extraction fraction: Comparison of dual-gas challenge calibrated BOLD with CBF and challenge-free gradient echo QSM+qBOLD. Magnetic Resonance in Medicine 2021; 85: 953-961.
8. Zhang S, Cho J, Nguyen TD, et al. Initial Experience of Challenge-Free MRI-Based Oxygen Extraction Fraction Mapping of Ischemic Stroke at Various Stages: Comparison With Perfusion and Diffusion Mapping. Frontiers in Neuroscience 2020; 14. Original Research.
9. Zhang J, Zhou D, Nguyen TD, et al. Cerebral metabolic rate of oxygen (CMRO2) mapping with hyperventilation challenge using quantitative susceptibility mapping (QSM). Magnetic resonance in medicine 2017; 77: 1762-1773.
10. Hongyu A and Weili L. Cerebral venous and arterial blood volumes can be estimated separately in humans using magnetic resonance imaging. Magnetic resonance in medicine 2002; 48: 583-588.
11. Zhang J, Cho J, Zhou D, et al. Quantitative susceptibility mapping-based cerebral metabolic rate of oxygen mapping with minimum local variance. Magn Reson Med 2017.
12. Sakai F, Nakazawa K, Tazaki Y, et al. Regional cerebral blood volume and hematocrit measured in normal human volunteers by single-photon emission computed tomography. J Cereb Blood Flow Metab 1985; 5: 207-213.
13. Savicki JP, Lang G and Ikeda-Saito M. Magnetic susceptibility of oxy- and carbonmonoxyhemoglobins. Proceedings of the National Academy of Sciences 1984; 81: 5417-5419.
14. Hoffman R. Hematology: Basic Principles and Practice. Churchill Livingstone, 2005.
15. Spees WM, Yablonskiy DA, Oswood MC, et al. Water proton MR properties of human blood at 1.5 Tesla: magnetic susceptibility, T(1), T(2), T*(2), and non-Lorentzian signal behavior. Magn Reson Med 2001; 45: 533-542.
16. Zhang J, Liu T, Gupta A, et al. Quantitative mapping of cerebral metabolic rate of oxygen (CMRO2) using quantitative susceptibility mapping (QSM). Magnetic Resonance in Medicine 2015; 74: 945-952.
17. Yablonskiy DA, Sukstanskii AL and He X. BOLD-based Techniques for Quantifying Brain Hemodynamic and Metabolic Properties – Theoretical Models and Experimental Approaches. NMR Biomed 2013; 26: 963-986.
18. Ulrich X and Yablonskiy DA. Separation of cellular and BOLD contributions to T2* signal relaxation. Magn Reson Med 2016; 75: 606-615.
19. Sukstanskii AL and Yablonskiy DA. Theory of FID NMR signal dephasing induced by mesoscopic magnetic field inhomogeneities in biological systems. J Magn Reson 2001; 151: 107-117.
20. Hansen PC. Analysis of Discrete Ill-Posed Problems by Means of the L-Curve. SIAM Review 1992; 34: 561-580.
21. Zhang Y, Brady M and Smith S. Segmentation of brain MR images through a hidden Markov random field model and the expectation-maximization algorithm. IEEE Trans Med Imaging 2001; 20: 45-57.
22. Rudin LI, Osher S and Fatemi E. Nonlinear total variation based noise removal algorithms. Physica D: Nonlinear Phenomena 1992; 60: 259-268.
23. Cho J, Zhang S, Kee Y, et al. Cluster analysis of time evolution (CAT) for quantitative susceptibility mapping (QSM) and quantitative blood oxygen level-dependent magnitude (qBOLD)-based oxygen extraction fraction (OEF) and cerebral metabolic rate of oxygen (CMRO2 ) mapping. Magn Reson Med 2019.
24. Mintun MA, Raichle ME, Martin WR, et al. Brain oxygen utilization measured with O-15 radiotracers and positron emission tomography. J Nucl Med 1984; 25: 177-187.
25. Raichle ME, MacLeod AM, Snyder AZ, et al. A default mode of brain function. Proceedings of the National Academy of Sciences 2001; 98: 676-682.
26. Sun X, He G, Qing H, et al. Hypoxia facilitates Alzheimer's disease pathogenesis by up-regulating BACE1 gene expression. Proc Natl Acad Sci U S A 2006; 103: 18727-18732.
27. Acosta-Cabronero J, Williams GB, Cardenas-Blanco A, et al. In vivo quantitative susceptibility mapping (QSM) in Alzheimer's disease. PLoS One 2013; 8: e81093.
28. Trapp BD and Stys PK. Virtual hypoxia and chronic necrosis of demyelinated axons in multiple sclerosis. Lancet Neurol 2009; 8: 280-291.
29. Stadlbauer A, Zimmermann M, Kitzwogerer M, et al. MR Imaging-derived Oxygen Metabolism and Neovascularization Characterization for Grading and IDH Gene Mutation Detection of Gliomas. Radiology 2017; 283: 799-809.
30. Kudo K, Liu T, Murakami T, et al. Oxygen extraction fraction measurement using quantitative susceptibility mapping: Comparison with positron emission tomography. J Cereb Blood Flow Metab 2016; 36: 1424-1433.
Figures