1282
Image-based self-gating for motion artifact free imaging of the eye1Department of Internal Medicine II, Ulm University Medical Center, Ulm, Germany
Synopsis
MR acquisitions of the eyes are often complicated by eye motions leading to the occurrence of motion artifacts in the images. Using a tiny golden angle profile ordering scheme and a sliding window reconstruction the position of the optic nerve is identified and tracked via peak analysis of signal intensities along a 1-D-line containing the optic nerve. An image-based self-gating signal is derived from the calculated nerve locations. This approach not only leads to distinct reduction of motion artifacts but also enables the visualization of various motion phases occurring during the data acquisition without the use of external tracking devices.
Introduction
The application of MRI in ophthalmology always faces the challenge of eye motions, often leading to motion artifacts, especially in case of higher resolutions and long scan times. Previous works tried to overcome this problem by e.g. interrupting the scans to allow the patients to blink1 or by using external eye tracking2.With radial tiny golden angle (tyGA) profile ordering3 retrospective sliding window reconstructions can be used for image-based self-gating (SG) as known from cardiac and lung imaging4. In this work we present an image-based self-gating approach for the tracking of eye movements for complete removal of motion artifacts.
Methods
All data were acquired with a 3T whole-body clinical imaging system (Ingenia CX, Philips Healthcare, The Netherlands) using two single-channel flexible surface coils (Flex-S, Philips Healthcare) positioned centrally on the orbits combined with 5 elements of the whole-body coil integrated in the table.Images were acquired from two volunteers after obtaining written informed consent, with axial and sagittal slices planned such that the eye globes, optic nerve (ON), and the extraocular muscles (EOMs) were captured. Data were acquired applying a two-dimensional radial sequence using tiny golden angle (tyGA) profile ordering with an angular increment of $$$\psi_7 = 23.6281 °$$$ , a TR/TE of 5.6/2.3 ms, flip angle of 20°, in-plane field of view of 150 x 150 mm. Data were acquired continuously for approximately 25 seconds for scans with a resolutions of 0.7 x 0.7 x 8mm and for 35 seconds with a resolution of 0.5 x 0.5 x 5 mm. Several scans were performed with the volunteers being instructed to move their eyes with moderate speed from right to left (axial images) or up and down (sagittal images).
Image-based SG signal was derived from ON position tracking in sliding window reconstructions. Since tyGA yields uniform coverage of k‐space independently on the number of profiles, reconstruction can be performed with nearly arbitrary temporal resolutions. Here, temporal resolutions of 300ms (54 profiles) and 200ms (36 profiles) were tested.
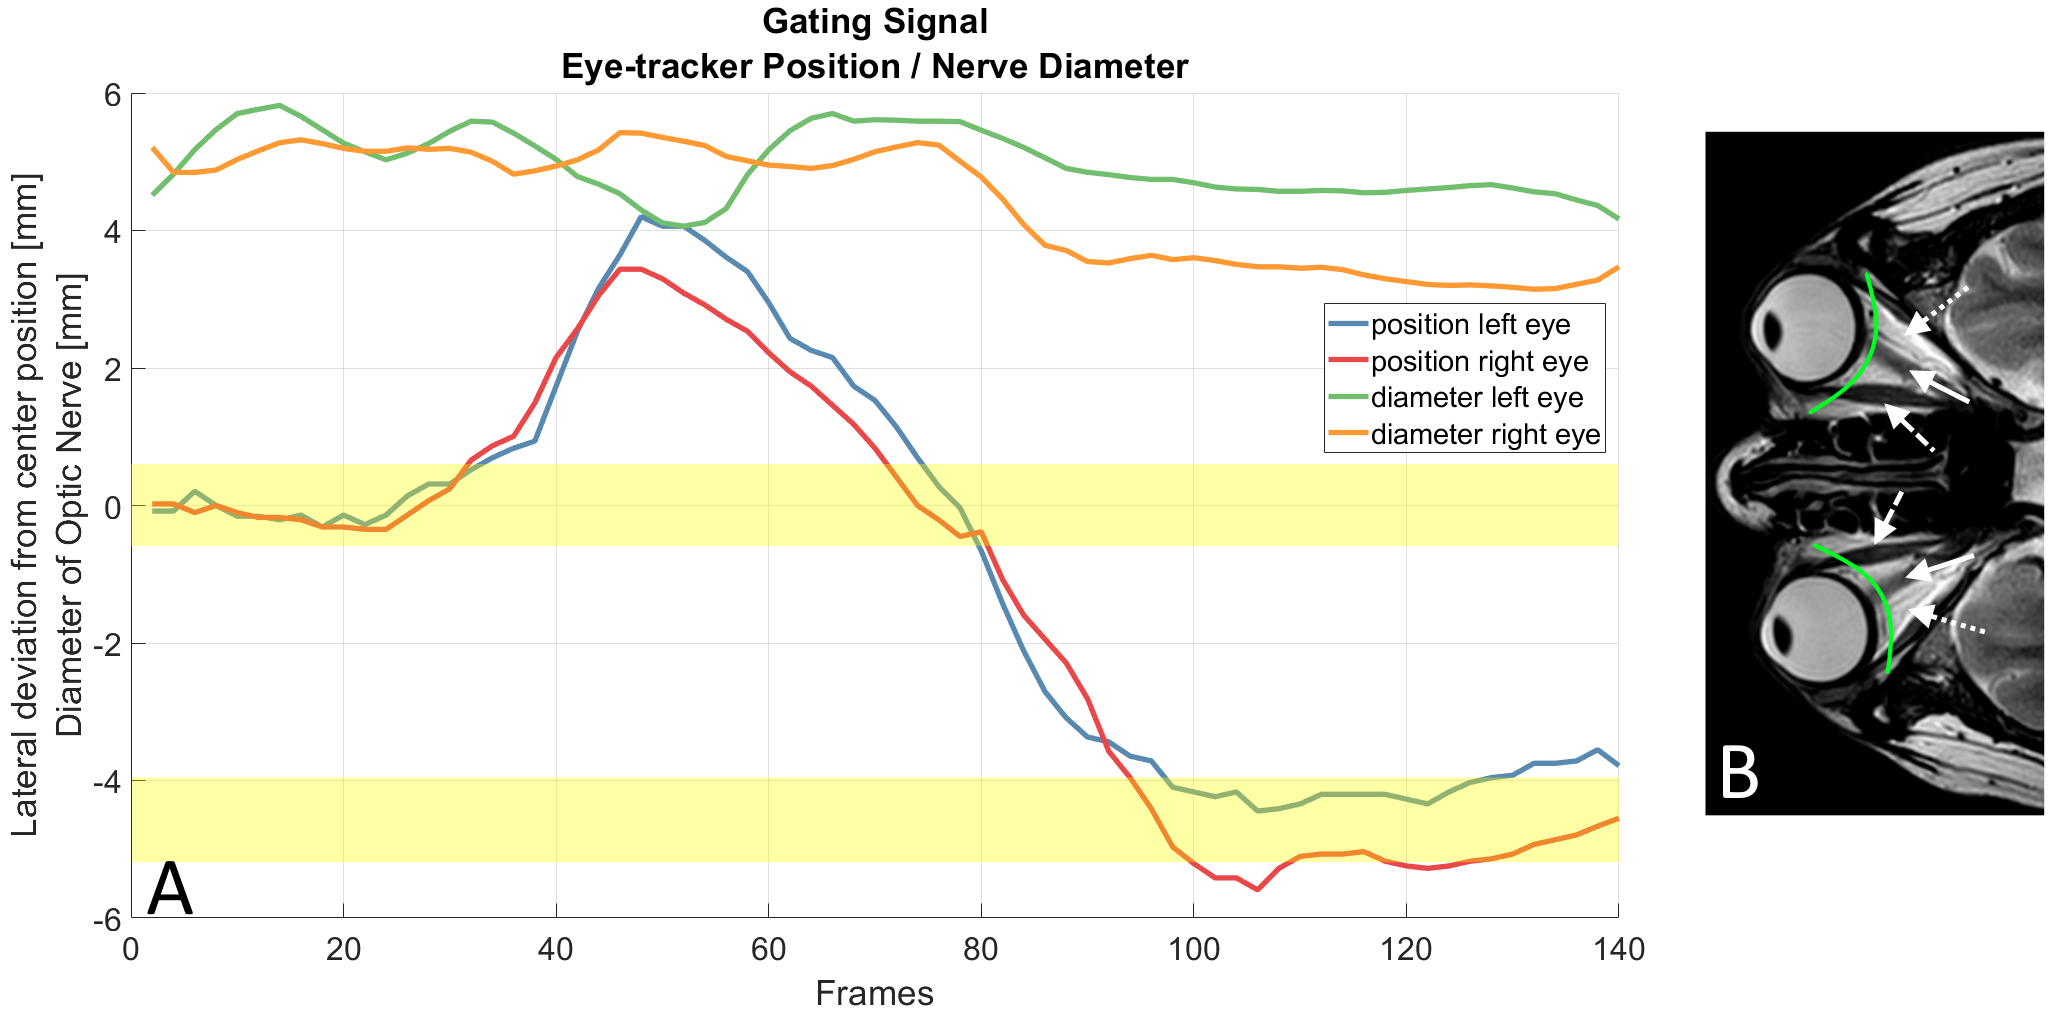
A semicircular shaped line covering the EOMs, orbital fat and the ON (Fig. 1B) was placed manually in the first frame. Peak analysis along the line was used to locate the hypointense ON and EOMS between the hyperintense orbital fat, assuming the ON being the most centrally located signal minimum along the line. The FWHM between signal minimum of the ON and maximum signal peaks from the neighboring orbital fat was used to calculate the center location of the ON. For all subsequent frames, the hypointense signal closest to the calculated ON location of the previous frame was considered the new ON location of the current frame.
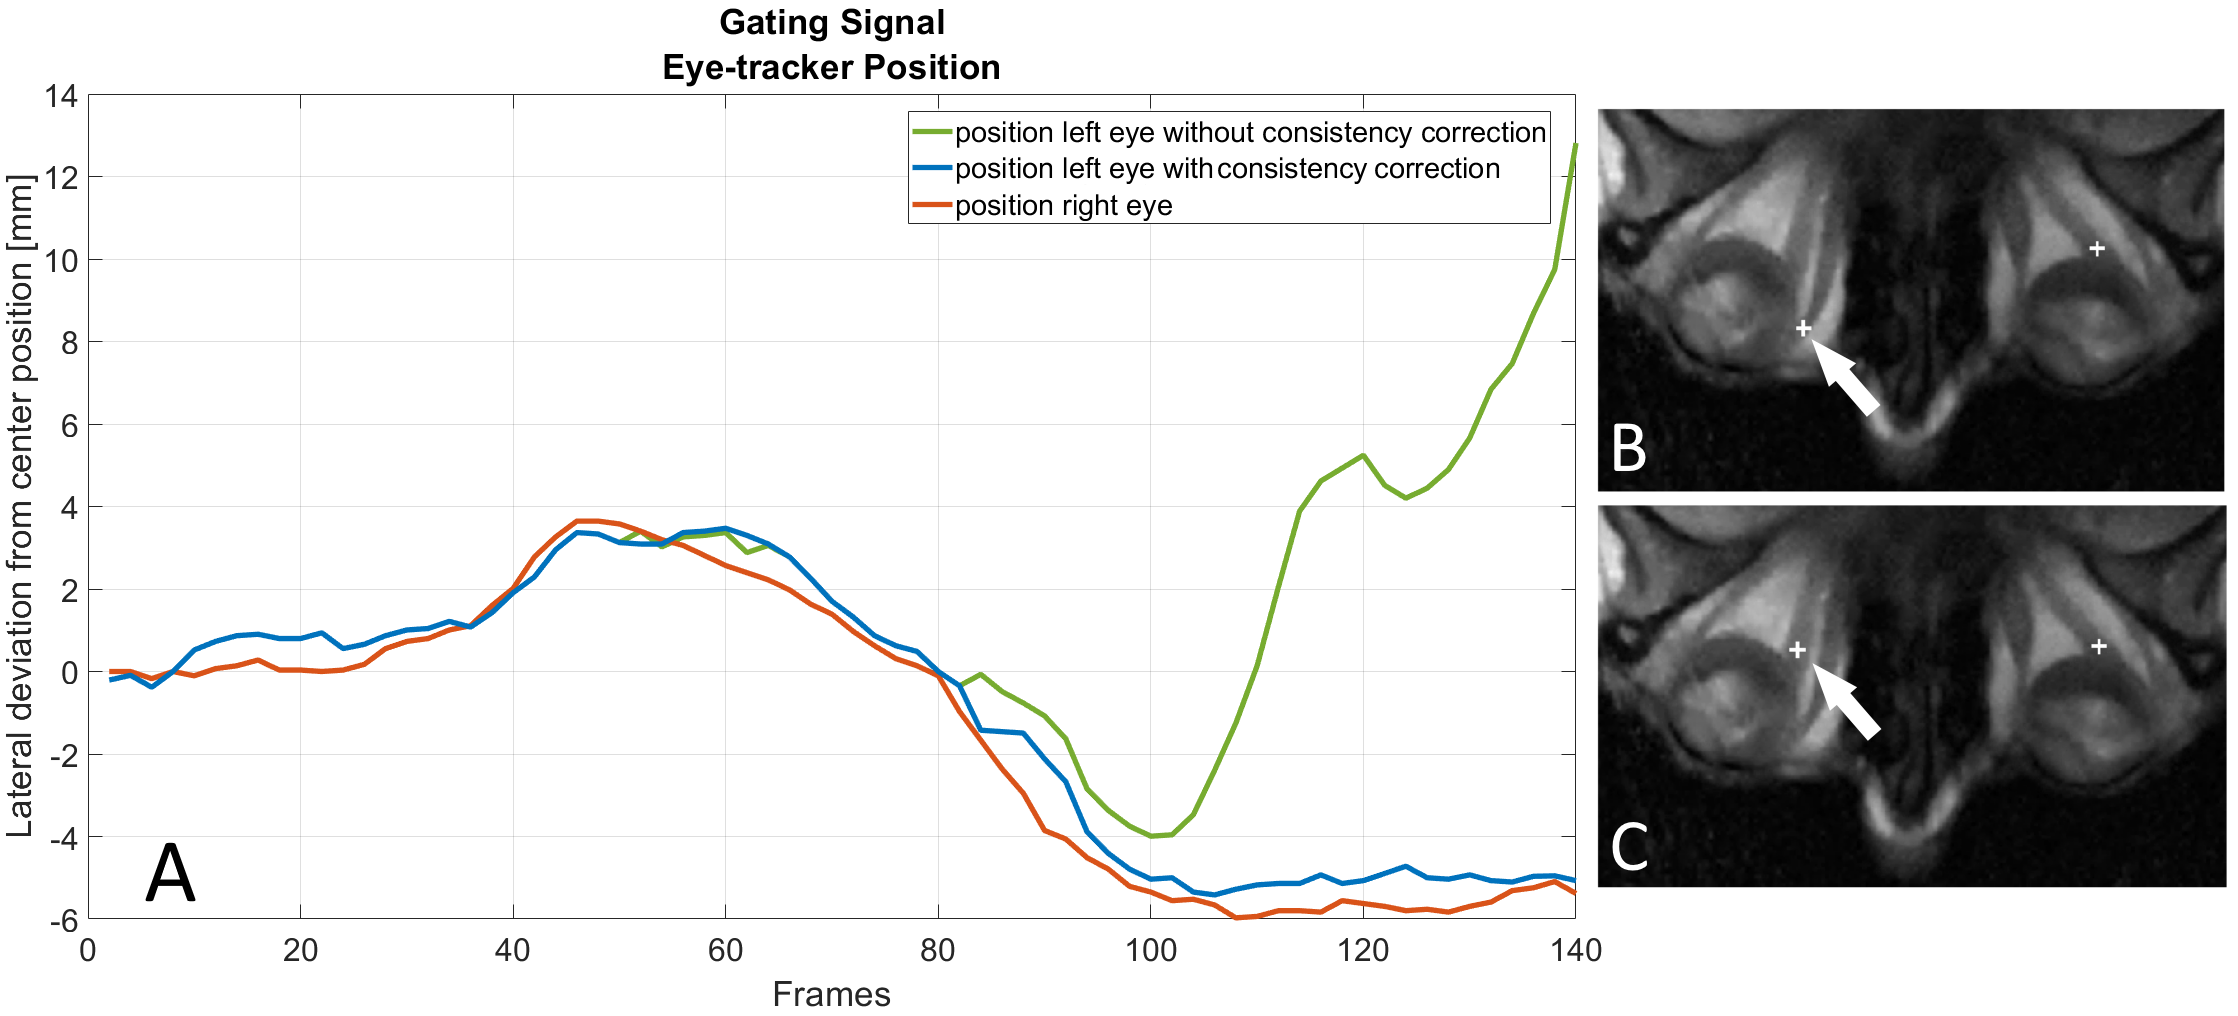
Higher temporal resolutions cause lower SNR and rising undersampling artifacts, which may lead to incorrect tracking of the EOMs or artifacts instead of the ON. For mitigation, in axial images the locations of both ONs were tracked and a frame-by-frame consistency check between the calculated ON positions was used as an additional constraint on the peak analysis to avoid tracking errors.
Additionally, the calculated width of the ON was used as a SG signal to detect eye movements in and out of the imaged plane.
Each frame and their respective k-space profiles were resorted into bins identifying different ON positions using a SG threshold value (Fig 1A). Images were then reconstructed for each bin using an iterative SPARSE-SENSE algorithm in an in-house developed reconstruction software implemented in MatLab (Math-Works, Natick, MA).
Results
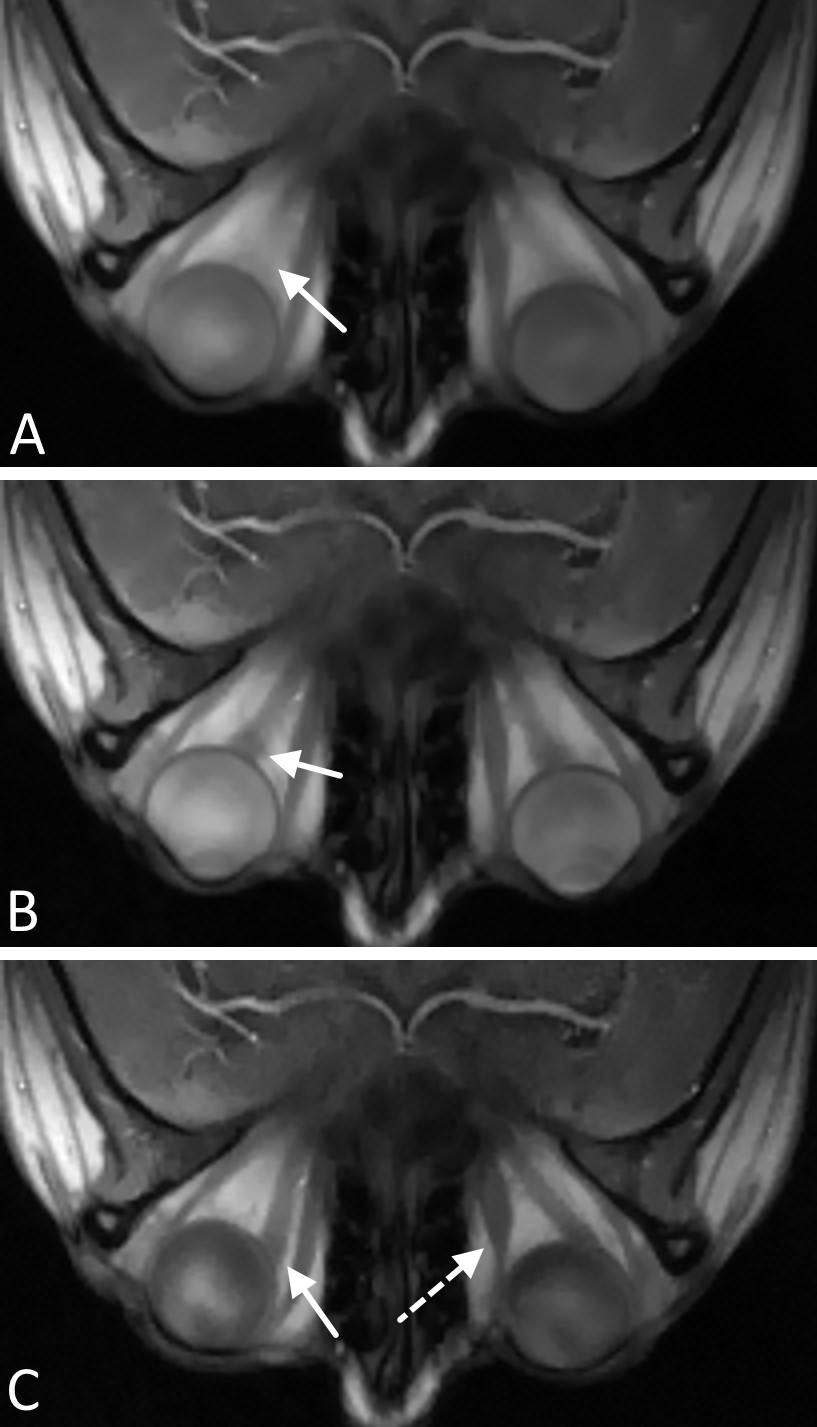
Figure 2 shows a clear improvement in the image-based ON tracking performance due to the use of consistency correction.A distinct reduction in motion blur is visible in images reconstructed using the image-based SG approach (Fig 3) compared to images without SG. Images of various motion phases were also successfully reconstructed by means of data binning using the SG signal (Fig 3 B&C).
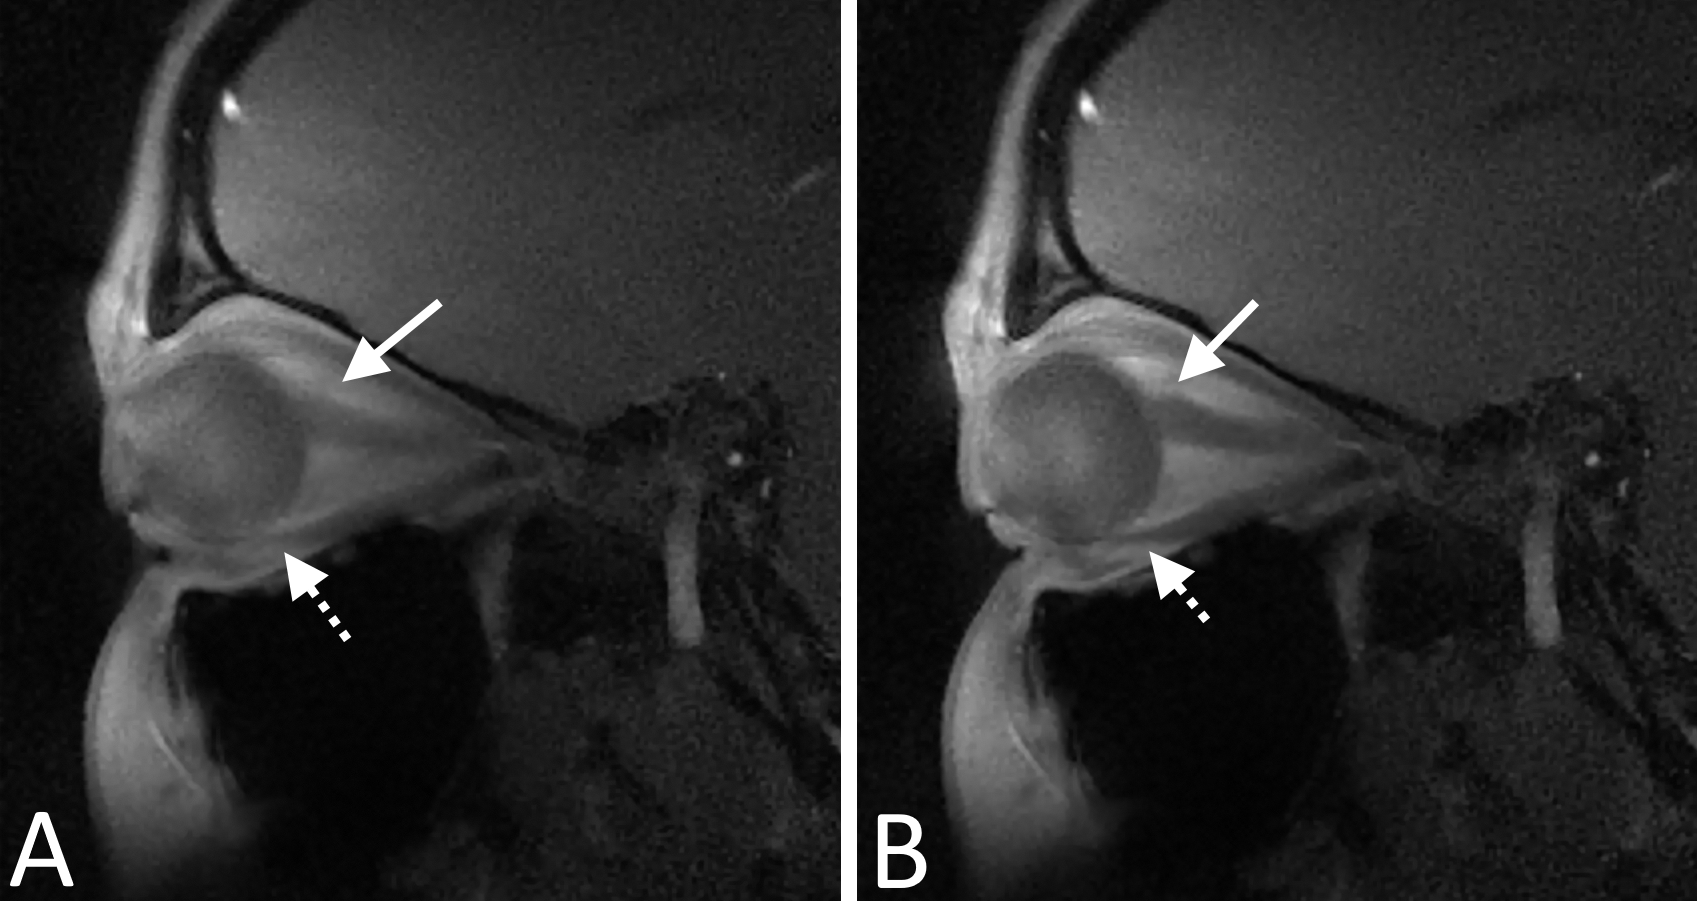
While a sagittal view with only one ON visible does not allow the use of the consistency correction in the same way as in axial images, SG signal can still be derived leading to images with clearly depicted ONs and EOMs (Figure 4).
Discussion and conclusion
The proposed image-based SG approach was successfully applied to ocular MRI scans, not only leading to distinct reduction of motion artifacts but also enabling the visualization of various motion phases occurring during the data acquisition without the use of an external tracking device.While the use of a consistency check for the calculation of the ON location allows proper tracking of the nerve even for small sliding window widths of 200 ms and in-plane resolutions of 0.5 mm, even higher temporal or spatial resolutions, and thus lower SNR / stronger undersampling artifacts, would likely require additional processing steps, e.g. peak prominence calculations or denoising of the tyGA images, in order to avoid tracking errors.
Future works might include the adaption of the image-based SG approach to 3D acquisitions and the investigation of the applicability of the consistency check to explicitly identify and track asynchronous eye movements e.g. in patients with ophthalmoparesis.
Acknowledgements
The authors thank the Ulm University Center for Translational Imaging MoMAN for its support. Technical support from Philips Healthcare is gratefully acknowledged.References
[1] Richdale, K., Wassenaar, P., Bluestein, K.T., et.al. 7 Tesla MR imaging of the human eye in vivo. J. Magn. Reson. Imaging 2009;30, 924–932
[2] Franceschiello B., Di Sopra L., Minier A. et. al. 3-Dimensional magnetic resonance imaging of the freely moving human eye. Progress in Neurobiology 2020; 194:101885.
[3] Wundrak S, Paul J, Ulrici J, et.al. A small surrogate for the golden angle in time-resolved radial MRI based on generalized fibonacci sequences. IEEE Trans Med Imaging 2014;34.
[4] Paul, J., Divkovic, E., Wundrak, S. et.al. High‐resolution respiratory self‐gated golden angle cardiac MRI: Comparison of self‐gating methods in combination with k‐t SPARSE SENSE. Magn. Reson. Med. 2015, 73: 292-298.
Figures