1281
The relationship between Cerebrovascular Reactivity and baseline Cerebral Blood Flow: the effect of acquisition and analysis choices1Physical Therapy and Human Movement Sciences, Feinberg School of Medicine, Northwestern University, Chicago, IL, United States, 2Biomedical Engineering, McCormick School of Engineering, Northwestern University, Evanston, IL, United States, 3Basque Center on Cognition, Brain and Language, Donostia, Spain, 4University of the Basque Country EHU/UPV, Donostia, Spain
Synopsis
Blood Oxygen Level Dependent (BOLD) signals can be modulated by the baseline vascular and metabolic state. Understanding how baseline vascular physiology relates to dynamic neurovascular processes will lead to more accurate interpretations of BOLD Cerebrovascular Reactivity (CVR) measurements. We investigated the relationship between baseline Cerebral Blood Flow (bCBF) and BOLD-CVR, generally reporting positive correlations. Optimizing for vascular delays, and modelling with simple breathing task data, can improve CVR correlations with bCBF. Future work should investigate individual differences and include larger samples.
INTRODUCTION
Cerebrovascular Reactivity (CVR), the cerebral blood flow (CBF) response to vasoactive stimuli, reflects the cerebrovasculature’s regulatory ability. Using Blood Oxygenation Level Dependent functional MRI (BOLD-fMRI) to reflect CBF changes is common for CVR mapping. Theoretical and empirical evidence shows that task-induced and resting-state BOLD signals are modulated by the vascular and metabolic baseline state[1–3]. Specific to CVR, a higher BOLD-CVR response was found in an artificially pre-vasodilated baseline state[4,5], and a positive correlation between baseline CBF (bCBF) and BOLD-CVR, across individuals, has been shown[6]. Understanding how baseline vascular physiology relates to dynamic neurovascular processes will lead to more accurate interpretations of CVR measurements, particularly important in clinical cohorts that present with altered vascular and/or metabolic baselines.We add to this literature and further address how CVR data acquisition and modelling affect the bCBF-CVR relationship. Previous work shows acquiring CVR with short breathing tasks, compared to only resting-state data, can produce more robust maps[7]. When modelling CVR, it is important to consider spatially variable hemodynamic delays (lags) between the CO2 regressor and the BOLD signal[7,8]. Here, we assess the impact of these methodological factors on the bCBF-CVR correlation; we hypothesize a stronger positive bCBF-CVR correlation when using breathing task data compared to rest, and when CVR is optimized for hemodynamic lag effects. We further explore how CVR modelled from hypercapnic and hypocapnic breathing tasks differ in their correlation with bCBF, considering previous divergent findings[4].
METHOD
DATA COLLECTION: 9 healthy participants (6F, 26.22±4.06 years) were scanned on a Siemens 3T Prisma, 64-channel head coil. A T1-weighted scan (1mm isotropic) was acquired for registration and tissue segmentation. Three BOLD-weighted fMRI scans were acquired with gradient-echo EPI (TR/TE=1200/34ms, FA=63º, 2mm isotropic voxels, 60 slices, MB factor=4). An 8-minute pseudo-continuous arterial spin labelling (pCASL) scan was run, guided by the white paper[9] (3D GRASE, 5 segments, TR/TE=4000/19.4ms, 4mm isotropic voxels, 40 axial slices, PLD/Tau=1800ms, 11 tag/controls pairs, one M0 volume). Expired CO2 levels were sampled with a nasal cannula, using an ADInstruments Gas Analyzer and PowerLab. Fig1 gives an overview of the protocol, timings for breathing tasks, partial pressure of end-tidal CO2 (PETCO2), and average BOLD-fMRI traces.BOLD-CVR ANALYSIS: fMRI scans were volume registered to the same single-band reference and brain extracted (AFNI & FSL). PETCO2 values were identified, convolved with a canonical HRF, and shifted ±15 s in 0.3 s increments, then down-sampled to the TR (MATLAB). Multiple linear regression (AFNI) was performed separately for the five data segments (BH+REST, CDB+REST, REST, RESTBH, RESTCDB, see Fig1). The model consisted of mean, drift terms, 6 motion parameters, and a PETCO2 time-series. The beta-weight for the unshifted PETCO2 regressor, scaled by the fitted mean, produced unoptimized CVR maps (No-Opt CVR, units: %BOLD/mmHg). For lag optimized maps (Lag-Opt CVR), the model was run for each shifted PETCO2 regressor; parameter estimates were taken from the model with the largest R-squared[7,8].
BASELINE CBF ANALYSIS: FSL’s BASIL toolbox[10] was used for perfusion modelling and quantification. Analysis conformed with the ASL white paper[9] (motion correction, adaptive spatial smoothing, voxel-wise calibration, tissue T1=1.3, a=0.85).
bCBF-CVR CORRELATIONS: CVR maps, bCBF maps, and the Harvard Oxford Cortical Atlas were transformed to T1 single subject space (Fig2). An average value within each atlas parcel was computed, and a spatial correlation between CVR and bCBF was computed (Fig3). Average GM values (masked from the segmented T1 image) for bCBF and CVR were outputted for between-subject correlations (Fig4).
RESULTS
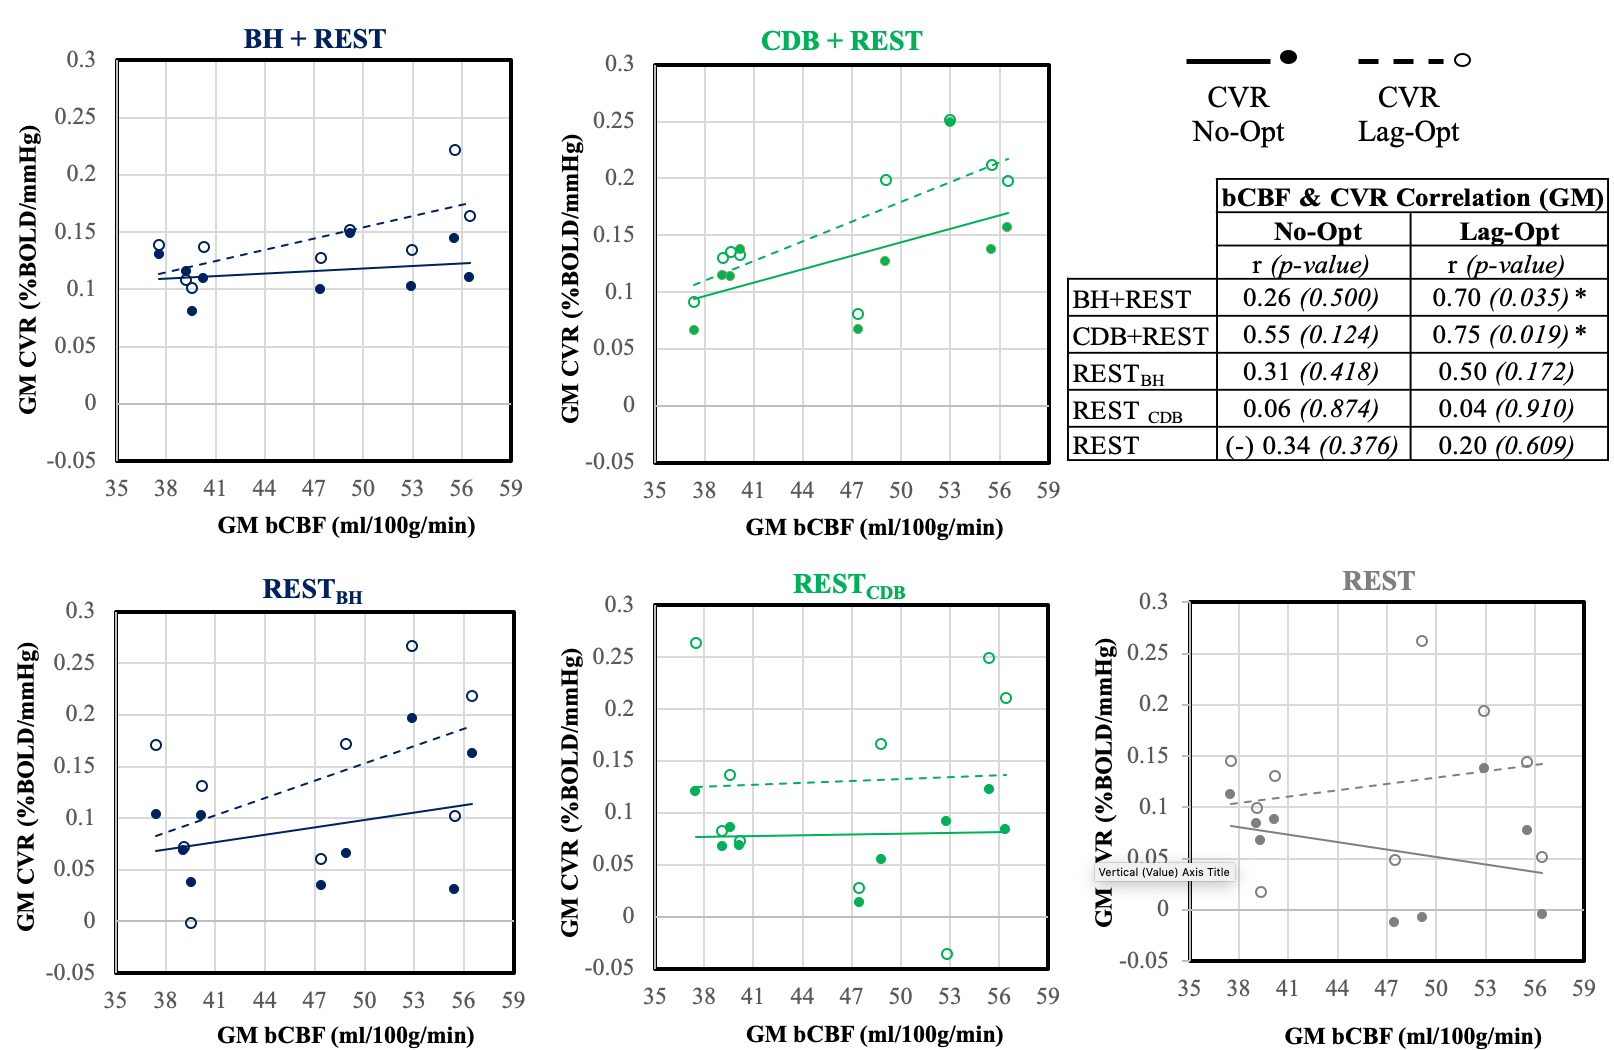
Fig3 shows the bCBF-CVR correlations across space (cortical regions) for each subject. For breathing task data there is generally a positive correlation, more consistent for the BH segment versus CDB, which increases after lag optimization. For resting-state data, there is more variability across subjects, fewer significant correlations and more negative correlations. To test group effects, a repeated-measures ANOVA (null distribution created via permutations with the permuco package; ‘aovperm’ command[11]) was run. There was no significant interaction effect (F(4,32)=1.26, p=0.307) or effect of lag-optimization on Fisher-Z values (F(1,8)=3.23, p=0.110). There was a significant effect of data segment (F(4,32)=4.09, p<0.01), which appeared to be driven by the RESTCDB data segment having lower correlations and BH+REST segment having higher.Fig4 displays the correlation of GM averages, generally showing a positive correlation between bCBF and CVR: if an individual has a higher bCBF they demonstrate a higher CVR. Correlations improved following lag optimization. The only significant correlations were found with lag-optimized CVR values from breathing task data (Fig4 includes statistics).
DISCUSSION AND CONCLUSIONS
Consistent with our hypotheses, most significant bCBF-CVR associations were positive. Spatial correlations across cortical regions showed much variability across subjects, particularly for resting-state (which also had more negative correlations, suggesting CVR estimates are less physiologically plausible). Breathing task data, particularly BH, showed more consistent patterns, and correlations increased after lag optimization (though not significant at group level). Across people, the bCBF-CVR correlation of GM averages was only significant when CVR was modelled with breathing data segments and after lag optimization. After multiple comparison correction these results would not be significant; future work should explore individual variability and include larger samples. Together, our results suggest that a simple breathing task addition to a resting-state scan, alongside lag-optimization within CVR modelling, can improve CVR correlations with bCBF.Acknowledgements
Thanks to staff at the Center for Translational Imaging (CTI), Northwestern Radiology, for help with study set up. Thanks to Andrew Vigotsky for guidance on statistical analysis.
Research supported by the Eunice Kennedy Shriver National Institute of Child Health and Human Development of the National Institutes of Health under award number K12HD073945.
S.M. was supported by the European Union’s Horizon 2020 research and innovation program (Marie Skłodowska-Curie grant agreement No. 713673), a fellowship from La Caixa Foundation (ID 100010434, fellowship code LCF/BQ/IN17/11620063) and C.C.G was supported by the Spanish Ministry of Economy and Competitiveness (Ramon y Cajal Fellowship, RYC-2017- 21845), the Basque Government (BERC 2018-2021 and PIBA_2019_104) and the Spanish Ministry of Science, Innovation and Universities (MICINN; PID2019-105520GB-100).
References
- Liu TT. Neurovascular factors in resting-state functional MRI. Neuroimage. 2013;80:339-348.
- Chu PPW, Golestani AM, Kwinta JB, Khatamian YB, Chen JJ. Characterizing the modulation of resting-state fMRI metrics by baseline physiology. Neuroimage. 2018;173:72-87.
- Kim SG, Ogawa S. Biophysical and physiological origins of blood oxygenation level-dependent fMRI signals. J Cereb Blood Flow Metab. 2012;32(7):1188-1206.
- Bright MG, Donahue MJ, Duyn JH, Jezzard P, Bulte DP. The effect of basal vasodilation on hypercapnic and hypocapnic reactivity measured using magnetic resonance imaging. J Cereb Blood Flow Metab. 2011;31(2):426-438.
- Halani S, Kwinta JB, Golestani AM, Khatamian YB, Chen JJ. Comparing cerebrovascular reactivity measured using BOLD and cerebral blood flow MRI: The effect of basal vascular tension on vasodilatory and vasoconstrictive reactivity. Neuroimage. 2015;110:110-123.
- Leoni RF, Oliveira IAF, Pontes-Neto OM, Santos AC, Leite JP. Cerebral blood flow and vasoreactivity in aging: An arterial spin labeling study. Brazilian J Med Biol Res. 2017;50(4).
- Stickland, R., Ayyagari, A., Zvolanek, K, Bright, M. Short breathing tasks at the start of a resting state fMRI scan: feasible measures of cerebrovascular reactivity and hemodynamic lag [Oral conference presentation #1112]. ISMRM & SMRT Virtual Conference & Exhibition 08-14 August 2020. DOI: http://dx.doi.org/10.13140/RG.2.2.23894.88644/1
- Moia S, Stickland RC, Ayyagari A, Termenon M, Caballero-Gaudes C, Bright MG. Voxelwise optimization of hemodynamic lags to improve regional CVR estimates in breath-hold fMRI*. In: 2020 42nd Annual International Conference of the IEEE Engineering in Medicine & Biology Society (EMBC). IEEE; 2020:1489-1492.
- Alsop DC, Detre JA, Golay X, et al. Recommended implementation of arterial spin-labeled perfusion MRI for clinical applications: A consensus of the ISMRM perfusion study group and the European consortium for ASL in dementia. Magn Reson Med. 2015;73(1):102-116.
- Chappell MA, Groves AR, Whitcher B, Woolrich MW. Variational Bayesian Inference for a Nonlinear Forward Model. IEEE Trans Signal Process. 2009;57(1):223-236.
- Jaromil Frossard and Olivier Renaud. permuco: Permutation Tests for Regression, (Repeated Measures) ANOVA/ANCOVA and Comparison of Signals (2019). R package version 1.1.0. https://CRAN.R-project.org/package=permuco
Figures