1280
Concordance of Regional Hypoperfusion by ASL MRI and 15O-water PET in Frontotemporal Dementia: Is ASL an Efficacious Alternative?1Lawson Health Research Institute, London, ON, Canada, 2Department of Medical Biophysics, Western University, London, ON, Canada, 3Fraunhofer Institute for Medical Image Computing MEVIS, Bremen, Germany, 4Department of Clinical Neurological Sciences, Western University, London, ON, Canada
Synopsis
The ability of arterial spin labeling (ASL) to detect perfusion abnormalities in clinical populations can be limited by poor signal to noise and transit-time artefacts. This is evident in studies involving frontotemporal dementia patients, where reports on the diagnostic value of ASL have been inconsistent. This study presents a head-to-head comparison of regional hypoperfusion detected by ASL and PET with radiolabeled water (15O-water), the gold standard for measuring CBF. T-maps depicting hypoperfusion were generated using absolute and relative CBF. There was good agreement between regional hypoperfusion identified by ASL and 15O-water, particularly for relative CBF maps which reduced inter-subject variability.
Introduction
Frontotemporal dementia (FTD) is the second most common neurodegenerative disease affecting individuals under the age of 651. Clinical diagnosis of FTD remains a challenge due to the overlap among the subtypes and other psychiatric disorders2. Functional imaging with PET has been shown to provide greater diagnostic confidence3; however, PET is costly and not as available as MRI. While perfusion imaging by arterial spin labeling (ASL) is an attractive alternative, its poor signal-to-noise ratio and sensitivity to imaging parameters can limit its ability to detect perfusion abnormalities. This is evident by the inconsistency in the literature regarding the diagnostic value of ASL4–6. Recent advances in ASL protocols, including optimized labeling parameters should enable detection of more subtle perfusion abnormalities7. To evaluate this, this study presents a comparison of regional hypoperfusion maps generated by ASL and PET using radiolabeled water (15O-water), the gold standard for imaging CBF in humans. ASL and PET perfusion images were acquired simultaneously on a hybrid PET/MR scanner to eliminate variability in perfusion between imaging sessions and to minimize registration errors.Methods
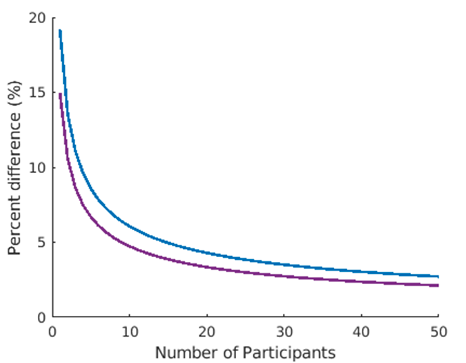
Data were acquired in 13 controls (age: 65.1 ± 9.7, gender: 5 female / 8 male) and 7 FTD patients (age: 69.1 ± 9.4, gender: 3 female / 4 male) on the Siemens Biograph mMR. The patient group included individuals diagnosed with behavioral variant (n=2), semantic variant (n=2), nonfluent primary primary progressive aphasia (n=2), and progressive supranuclear palsy (n=1). Five minutes of list mode data were acquired after a bolus injection of approximately 800MBq of 15O-water. To avoid arterial blood sampling, a non-invasive hybrid PET/MR approach was used to map CBF8. With this variation of the double integration approach9, global CBF measured by ASL was used to convert regional PET-activity into perfusion units. PET data were reconstructed using an MR-based attenuation correction map and smoothed by a 4mm gaussian filter. A PCASL-GRASE sequence was used to collect the ASL images10 (TR/TE: 4500/22.14ms, post-labeling delay: 2s, labeling duration: 1.8s, voxel size: 4x4x4mm3). A calibration (M0) image was acquired with a TR = 7s. ASL data were motion corrected and smoothed by a 6mm gaussian filter. Perfusion was calculated using a one compartment model using the oxasl pipeline in FSL11.All perfusion data were normalized to the MNI template with FSL. Regional hypoperfusion was determined by comparing individual CBF maps to the control group using the Crawford and Howell modified t-test12. T-maps were produced using absolute (CBFabs) and relative CBF (CBFrel). Relative perfusion maps were generated by intensity normalizing by the whole brain. Power analysis was performed to determine the minimum detectable difference for a given sample size.
Results
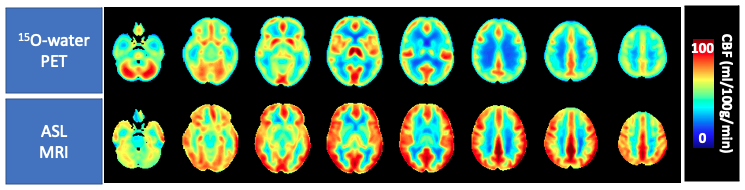
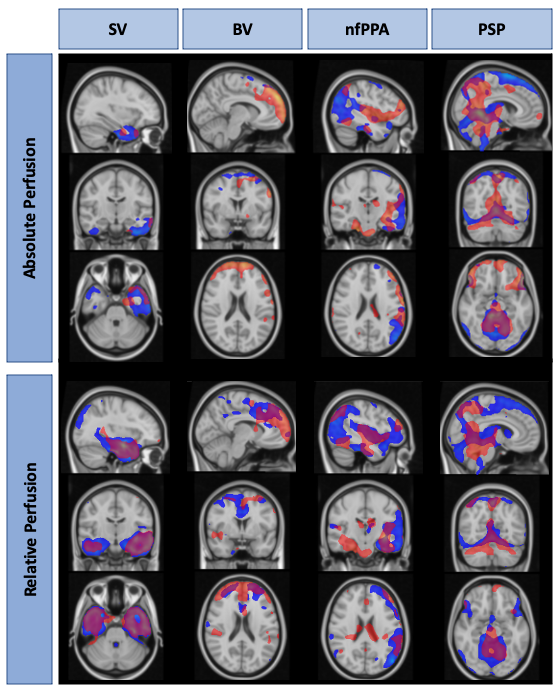
Global CBF measured by ASL was: 61.6 ± 12.4 and 55.7 ± 13.6 ml/100g/min in controls and patients respectively (ns). Mean control perfusion maps, generated by ASL and 15O-water are shown in Figure 1. T-maps generated using ASL and 15O-water based perfusion maps are shown in Figure 2. There was good agreement between regional hypoperfusion detected by ASL and PET. Both techniques identified significantly lower CBF in the temporal lobe (bilaterally) in semantic variant patients, the frontal lobe (bilaterally) in behavioural variant patients, the frontal and temporal lobes (left side) in the non-fluent primary progressive patients, and finally, the brainstem and inferior frontal gyrus in progressive supranuclear palsy patients. Figure 3 shows the minimum detectable difference at different sample sizes. Assuming power of 80% and confidence level of 95%, ASL is able to detect a 4.3% perfusion deficit while PET is able to detect regional deficits as small as 3.3%.Discussion/Conclusion
This work highlights the potential of ASL for identifying regional hypoperfusion in participants with FTD. Despite the small sample size and the differences in tissue contrast (Fig. 1), ASL was capable of detecting subtle perfusion abnormalities similar to those detected by 15O-water. While 15O-water PET data showed greater sensitivity, as demonstrated by power analysis, similar areas of hypoperfusion were identified by ASL (Fig. 2). This is particularly evident in the CBFrel maps where the variability related to inter-subject perfusion was reduced. These results are in agreement with previous PET studies which showed decreased metabolism in these regions in similar patient groups4,13,14. Future work will be to account for sources of variability such as partial volume errors.Acknowledgements
This work is supported by: Frederick Banting and Charles Best Canada Graduate Doctoral Award, Canadian Institutes of Health Research Grant and Alzheimer’s Drug Discovery Foundation Grant.References
1. Knopman, D. S. & Roberts, R. O. Estimating the number of persons with frontotemporal lobar degeneration in the US population. J. Mol. Neurosci. 45, 330–335 (2011).
2. Weder, N. D., Aziz, R., Wilkins, K. & Tampi, R. R. Frontotemporal Dementias: A Review. Ann. Gen. Psychiatry 6, 15 (2007).
3. Gossye, H., Van Broeckhoven, C. & Engelborghs, S. The use of biomarkers and genetic screening to diagnose frontotemporal dementia: Evidence and clinical implications. Front. Genet. 10, 1–18 (2019).
4. Anazodo, U. C. et al. Using simultaneous PET/MRI to compare the accuracy of diagnosing frontotemporal dementia by arterial spin labelling MRI and FDG-PET. NeuroImage Clin. 17, 405–414 (2018).
5. Mutsaerts, H. J. M. M. et al. Cerebral perfusion changes in presymptomatic genetic frontotemporal dementia: a GENFI study. Brain 142, 1108–1120 (2019).
6. Bron, E. E. et al. Diagnostic classification of arterial spin labeling and structural MRI in presenile early stage dementia. Hum. Brain Mapp. 35, 4916–31 (2014).
7. Alsop, D. C. et al. Recommended implementation of arterial spin-labeled perfusion MRI for clinical applications: A consensus of the ISMRM perfusion study group and the European consortium for ASL in dementia. Magn. Reson. Med. 73, 102–116 (2015).
8. Ssali, T., Anazodo, U. C., Thiessen, J. D., Prato, F. S. & St. Lawrence, K. A Non-invasive Method for Quantifying Cerebral Blood Flow by Hybrid PET/MR. J. Nucl. Med. 59, 1329–1334 (2018).
9. Mejia, M., Itoh, M., Watabe, H., Fujiwara, T. & Nakamura, T. Simplified nonlinearity correction of oxygen-15-water regional cerebral blood flow images without blood sampling. J. Nucl. Med. 35, 1870–7 (1994).
10. Günther, M., Oshio, K. & Feinberg, D. a. Single-shot 3D imaging techniques improve arterial spin labeling perfusion measurements. Magn. Reson. Med. 54, 491–498 (2005).
11. Chappell, M. A., Groves, A. R., Whitcher, B. & Woolrich, M. W. Variational Bayesian Inference for a Nonlinear Forward Model. IEEE Trans. Signal Process. 57, 223–236 (2009).
12. Crawford, J. R. & Howell, D. C. Comparing an individual’s test score against norms derived from small samples. Clin. Neuropsychol. 12, 482–486 (1998).
13. Moodley, K. K. et al. Simultaneous PET-MRI studies of the concordance of atrophy and hypometabolism in syndromic variants of Alzheimer’s disease and frontotemporal dementia: An extended case series. J. Alzheimer’s Dis. 46, 639–653 (2015).
14. Teune, L. K. et al. Typical cerebral metabolic patterns in neurodegenerative brain diseases. Mov. Disord. 25, 2395–2404 (2010).
Figures