1279
A Multiblock Partial Least Squares Correlation Framework for Covariate Adjustment and Interpretation of Latent Associations in Multimodal Data1Melbourne Neuropsychiatry Centre, The University of Melbourne, Parkville, Australia, 2Center for Neuropsychiatric Schizophrenia Research and Center for Clinical Intervention and Neuropsychiatric Schizophrenia Research, Mental Health Centre Glostrup, Copenhagen University Hospital, Glostrup, Denmark, 3Faculty of Health and Medical Sciences, Department of Clinical Medicine, University of Copenhagen, Denmark, Denmark, 4Functional Imaging Unit, Department of Clinical Physiology, Nuclear Medicine and PET, Rigshospitalet, Glostrup, Denmark, 5Department of Biomedical Engineering, The University of Melbourne, Melbourne, Australia, 6Melbourne Brain Centre Imaging Unit, The University of Melbourne, Parkville, Australia, 7Departments of Medical Genetics, Psychiatry, and Physiology & Pharmacology, University of Calgary, Calgary, AB, Canada, 8Institute of Psychiatry, Psychology & Neuroscience, King's College London, London, United Kingdom, 9Electrical and Electronic Engineering Department, The University of Melbourne, Parkville, Australia
Synopsis
Partial least squares (PLS) methods enable identification of multimodal patterns of latent associations between neuroimaging, cognitive, functional and clinical measures. Here, we propose a multiblock PLS correlation (MB-PLS-C) technique to enable covariate representation in the latent space and an interpretation framework to assess results from PLS-C analyses in clinical contexts. We investigate latent structure-cognition patterns in a multivariate dataset of individuals with treatment-resistant schizophrenia and healthy controls using the proposed MB-PLS-C method, and compare with standard PLS-C with and without covariate adjustment through residualization.
Introduction
Partial least squares (PLS) methods are employed in the statistical analyses of neuroimaging data to assess relationships between measures of brain structure, function, cognition and/or clinical domains1-3. By integrating information from multi-domain data-blocks into a single model, the PLS correlation technique (PLS-C) identifies latent associations between experimental groups. In addition to comparisons across modalities-of-interest, it is often necessary to characterize covariate effects. It is a standard practice in PLS-C research to control for covariates through residualization 3,4 or posthoc with covariates in native space4. Residualization can lead to undesirable effects in the interpretation of analyses6, and covariate adjustment in native space precludes integration of covariate information in the latent space. Further, latent associations are often reported as saliences (latent weights) or latent variables (LVs, weighted combinations of original variables), leading to challenges in interpretability of the findings in clinical context.Here, we develop a multiblock PLS-C (MB-PLS-C) method that enables covariate representation in the latent space, along with an integrated interpretation framework. The proposed method encompasses 1) covariate blocks for each modality-of-interest, 2) decomposition of the cross-block correlation matrix into latent additive components to aid with interpretation 3) within- and between-group comparisons for two groups or more. We apply MB-PLS-C to identify differential structure-cognition patterns in a multi-modality dataset of individuals with treatment-resistant schizophrenia (TRS) and healthy controls (HC), and compare with standard PLS-C without and with residualization (PLS-C-R).
Theory
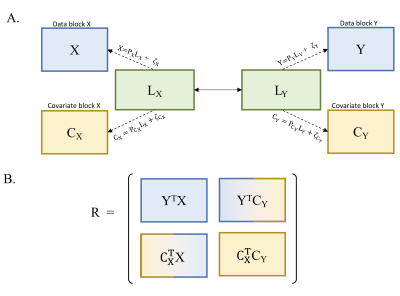
MB-PLS-CThe standard PLS-C identifies multivariate patterns of maximal covariance between disjoint data-blocks, each consisting of multiple variables and observations from same experimental groups1. We consider the case of two data blocks, $$$\bf{X}$$$ and $$$\bf{Y}$$$, for simplicity. MB-PLS-C extends the two-block method to include two covariate blocks, $$$\bf{C}_\bf{X}$$$ and $$$\bf{C}_\bf{Y}$$$ (Figure 1).
A data-block is a matrix of size $$$I$$$x$$$J_b$$$, $$$b \in \{\bf{X},\bf{Y}\}$$$, $$$J_b$$$ is the number of variables in block $$$b$$$ arranged as columns, and $$$I$$$ is the number of observations. The covariate blocks are $$$I$$$x$$$J_c$$$ matrices, $$$J_c$$$: number of covariates in each block, $$$c \in \{\bf{C_X},\bf{C_Y}\}$$$ . The blocks are divided into sub-matrices of size $$$I_n$$$x$$$J_s$$$, $$$s \in \{\bf{X},\bf{Y},\bf{C_X},\bf{C_Y}\}$$$, $$$n \in \{1,...,N\}$$$, $$$N$$$ is the number of experimental groups.
In practice, $$$\bf{X}$$$ and $$$\bf{Y}$$$ are column-wise mean-centred or converted to z-scores to ensure comparability across variables1. The multi-block cross-product matrix, $$$\bf{R}$$$, describes the correlations between the data and covariate blocks, $${\bf{R}}=\begin{bmatrix}{\bf{Y}}^T{\bf{X}} & {\bf{Y}}^T{\bf{C_Y}} \\{\bf{C_X}}^T{\bf{X}} & {\bf{C_X}}^T{\bf{C_Y}} \end{bmatrix}.$$ $$$\bf{R}$$$ is an $$$M$$$x$$$P$$$ matrix of correlations, $$$M=J_{\bf{Y}}+J_{\bf{C_X}}, P=J_{\bf{X}}+J_{\bf{C_Y}}$$$. Singular-value-decomposition decomposes $$$\bf{R}$$$ into the product,$${\bf{R}}={\bf{U{\Sigma}V^T}}.$$ The column vectors of $$${\bf{U}},{\bf{U}}_i,i\in\{1,...,p\},p=min(M,P)$$$, are the saliences representing contributions of $$${\bf{Y}}$$$ and $$${\bf{C_X}}$$$ to $$$\bf{R}$$$. The saliences from $$$\bf{V}$$$ similarly are contributions from $$$\bf{X}$$$ and $$$\bf{C_Y}$$$. $$$\bf{\Sigma}$$$ is a diagonal matrix with entries $$${\sigma}_i$$$. LVs are the columns of:$${\bf{L_X}}={\bf{XV_X}},{\bf{L_Y}}={\bf{YU_Y}},{\bf{L_{C_X}}}={\bf{C_XU_{C_X}}},{\bf{L_{C_Y}}}={\bf{C_YV_{C_Y}}}.$$ $$$\bf{R}$$$ is reconstructed from paired saliences:$${\bf{R}}=\sum_{i=1}^p{\bf{u}}_i{\sigma}_i{\bf{v}}_i^T.$$ Statistical validity
To establish statistical validity of MB-PLS-C, a number of previously proposed non-parametric methods can be employed, including permutation tests for statistical significance of overall pattern and LVs1,2, bootstrapping to estimate component-specific confidence intervals1,2, and out-of-sample cross-validation strategies2. Further, posthoc analyses can be performed to assess latent group differences, with the option to control for LV-specific covariate effects.
Methods
Participants: 41 TRS patients (age:38.56±9.12, 30 males, 11 females) and 45 HC (age:40.26±10.67, 29 males; 16 females).Data Acquisition: Magnetic resonance images were acquired using a Siemens 3T Magnetom scanner, after approval from Melbourne Human Ethics Committee. T1-weighted images: MPRAGE sequence, 176 sagittal slices, FOV=250×250mm2, TR=1980ms, TE=4.3ms, flip-angle=15°, matrix=256×256, resolution=0.98×0.98×1.0mm3.
Structural and Cognitive Variables: Cortical volume estimates using FreeSurfer and Desikan-Killiany atlas5. Seven cognitive variables covering four domains: Intra-Extra Dimensional-Set-Shift (IED), Paired-Associated-Learning (PAL), Spatial-Span (SSP), Spatial-Working-Memory (SWM). Structure covariates: age, gender, total intracranial-volume, body-mass index. Cognitive covariates: age, gender, premorbid IQ.
Statistical Analyses: Univariate group differences were assessed, controlling for age, gender. Two-group MB-PLS-C, PLS-C and PLS-C-R analyses were performed to identify latent cortical-cognition patterns. Permutation tests and bootstrapping was performed.
Results and Discussion
Latent cross-block covariance matricesIndividuals with TRS displayed significantly lower brain regional volumes (n=46/68, p-values <0.05), and worse performance in cognitive domains (p-values <0.05).
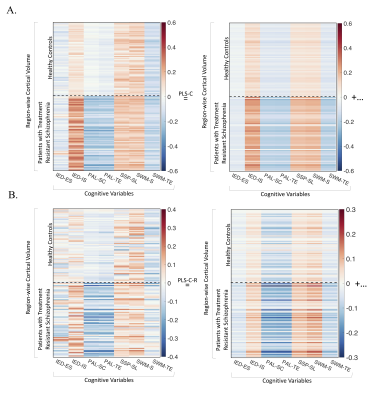
MB-PLS-C analyses were significant (p<1e-6). Reconstructed latent components of $$$\bf{R}$$$ described component-specific cortical-cognitive correlations and latent covariates (Figure 2). Two significant LVs explaining 93.15% of block covariance. LV1 (p<1e-6, explained-variance:83.29%), identified positive associations between cortical volumes and IED-IS, SSP-SL and SWM-S in both groups. Cortical volumes showed predominantly negative associations with PAL-TE, PAL-SC, IED-ES and SWM-TE. LV2 (p=1e-3, explained-variance:9.86%) showed group-wise differences between cognition-cortical volume correlations. In patients, PAL-TE and PAL-SC associated negatively, and IED-IS, SSP-SL, SWM-S associated positively with cortical volumes. Reversed trend in HCs with positive PAL-cortical volume correlations.
Standard PLS-C analyses were significant (p<1e-6), with LV1 (p<1e-6, explained-variance:88.01%). PLS-C-R analyses were also significant (p<1e-3), with LV1 (p=7e-3, explained-variance:63.83%). For both PLS-C and PLS-C-R, LV1 showed predominantly stronger cortical-cognition correlations in patients (Figure 3A-B), replicating structure of respective input correlation matrices.
Latent cortical-cognition saliences
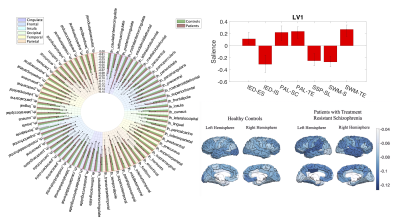
Cortical volume saliences from LV1 associated more strongly to cognition saliences in patients (Figure 4 A-B). LV2 described a relationship between PAL-derived cognitive measures and IED-interdimensional-set-shifting task and regional volumes.
Conclusion
A multiblock PLS-C framework is proposed to identify latent associations between data and covariate blocks. Latent cortical-cognition associations in treatment-resistant schizophrenia offer insights into relationships between structural abnormalities and cognitive domains.Acknowledgements
BE received funding from The Lundbeck Foundation (R316-2019-191)References
[1] Krishnan A, Williams LJ, McIntosh AR, Abdi H. Partial Least Squares (PLS) methods for neuroimaging: a tutorial and review. Neuroimage. 2011 May 15;56(2):455-75.
[2] Kirschner M, Shafiei G, Markello R, Makowski C, Talpalaru A, Hodzic-Santor B, Devenyi G, Paquola C, Bernhardt B, Lepage M, Chakravarty M. Latent clinical-anatomical dimensions of schizophrenia. medRxiv. 2020 Jan 1.
[3] Jessen K, Mandl RC, Fagerlund B, Bojesen KB, Raghava JM, Obaid HG, Jensen MB, Johansen LB, Nielsen MØ, Pantelis C, Rostrup E. Patterns of cortical structures and cognition in antipsychotic-naive patients with first-episode schizophrenia: a partial least squares correlation analysis. Biological Psychiatry: Cognitive Neuroscience and Neuroimaging. 2019 May 1;4(5):444-53
[4] Xu L, Mazumdar S, Price J. Covariate adjustment in partial least squares (PLS) regression for the extraction of the spatial–temporal pattern from positron emission tomography data. Statistical Methodology. 2007 Jan 1;4(1):44-63.
[5] Fischl B, Salat DH, Van Der Kouwe AJ, Makris N, Ségonne F, Quinn BT, Dale AM. Sequence-independent segmentation of magnetic resonance images. Neuroimage. 2004 Jan 1;23:S69-84.
[6] Wurm LH, Fisicaro SA. What residualizing predictors in regression analyses does (and what it does not do). Journal of memory and language. 2014 Apr 1;72:37-48.
Figures


