1278
Performance of data driven learned sampling patterns for accelerating brain 3D-T1Ρ MRI1New York University Langone Health, New York, NY, United States
Synopsis
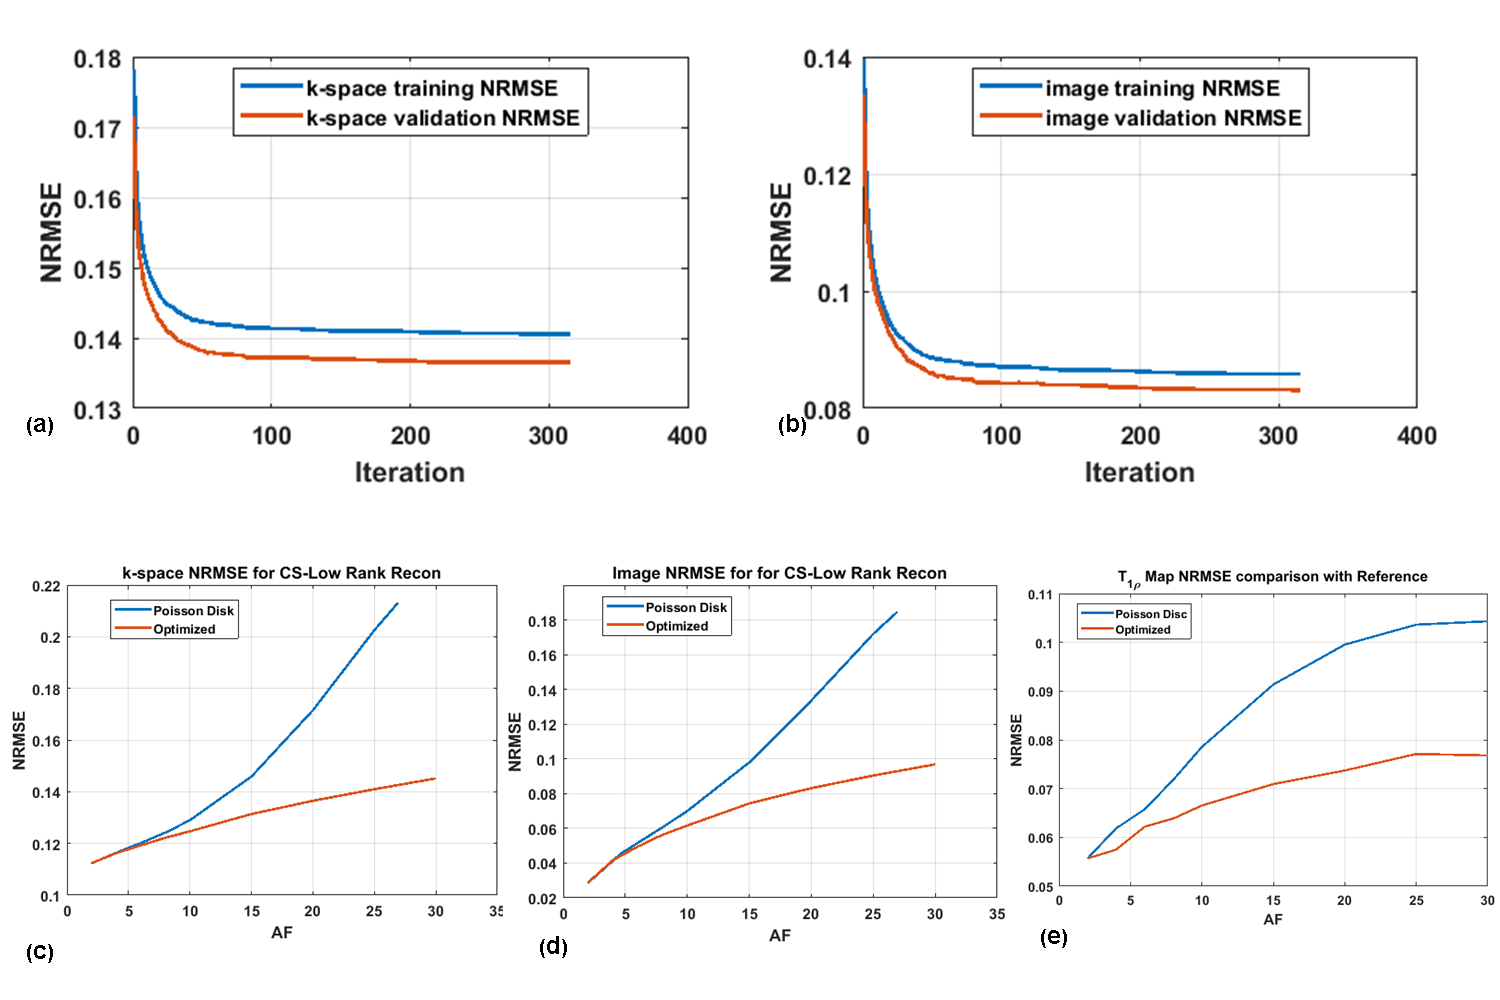
3D-T1ρ has many useful biomedical applications but requires long data acquisition times. The goal of the study was to apply a fast data-driven optimization approach, bias- accelerated subset selection (BASS), to generate optimal sampling patterns (SPs) for compressed sensing (CS) reconstruction for brain 3D-T1ρ MRI. Five healthy volunteers were recruited and fully sampled (FS) Cartesian, 3D-T1ρ MRI was obtained. The performance of Poisson disc (PD) and optimized SP were compared using normalized root mean square error (NRMSE). The data-driven optimized SP provides upto 2 times (NRMSE=0.09 optimized SP vs 0.18 PD-SP) improvement in images at the highest AFs tested.
Introduction
Quantification using 3D-T1ρ MRI of the brain finds a number of biomedical applications such as multiple sclerosis, Alzheimers’ and stroke (1). A big drawback of current 3D-T1ρ techniques is the MRI acquisition time required to obtain the data. Compressed sensing (CS) has ushered in a new paradigm of undersampling data below the Nyquist rate to reduce acquisition time. An additional dimension of improvement using CS is to optimize the sampling pattern (SP) used to acquire undersampled data. The goal of the study was to apply learning based SP optimization for accelerating 3D-T1ρ imaging of the brain.Methods
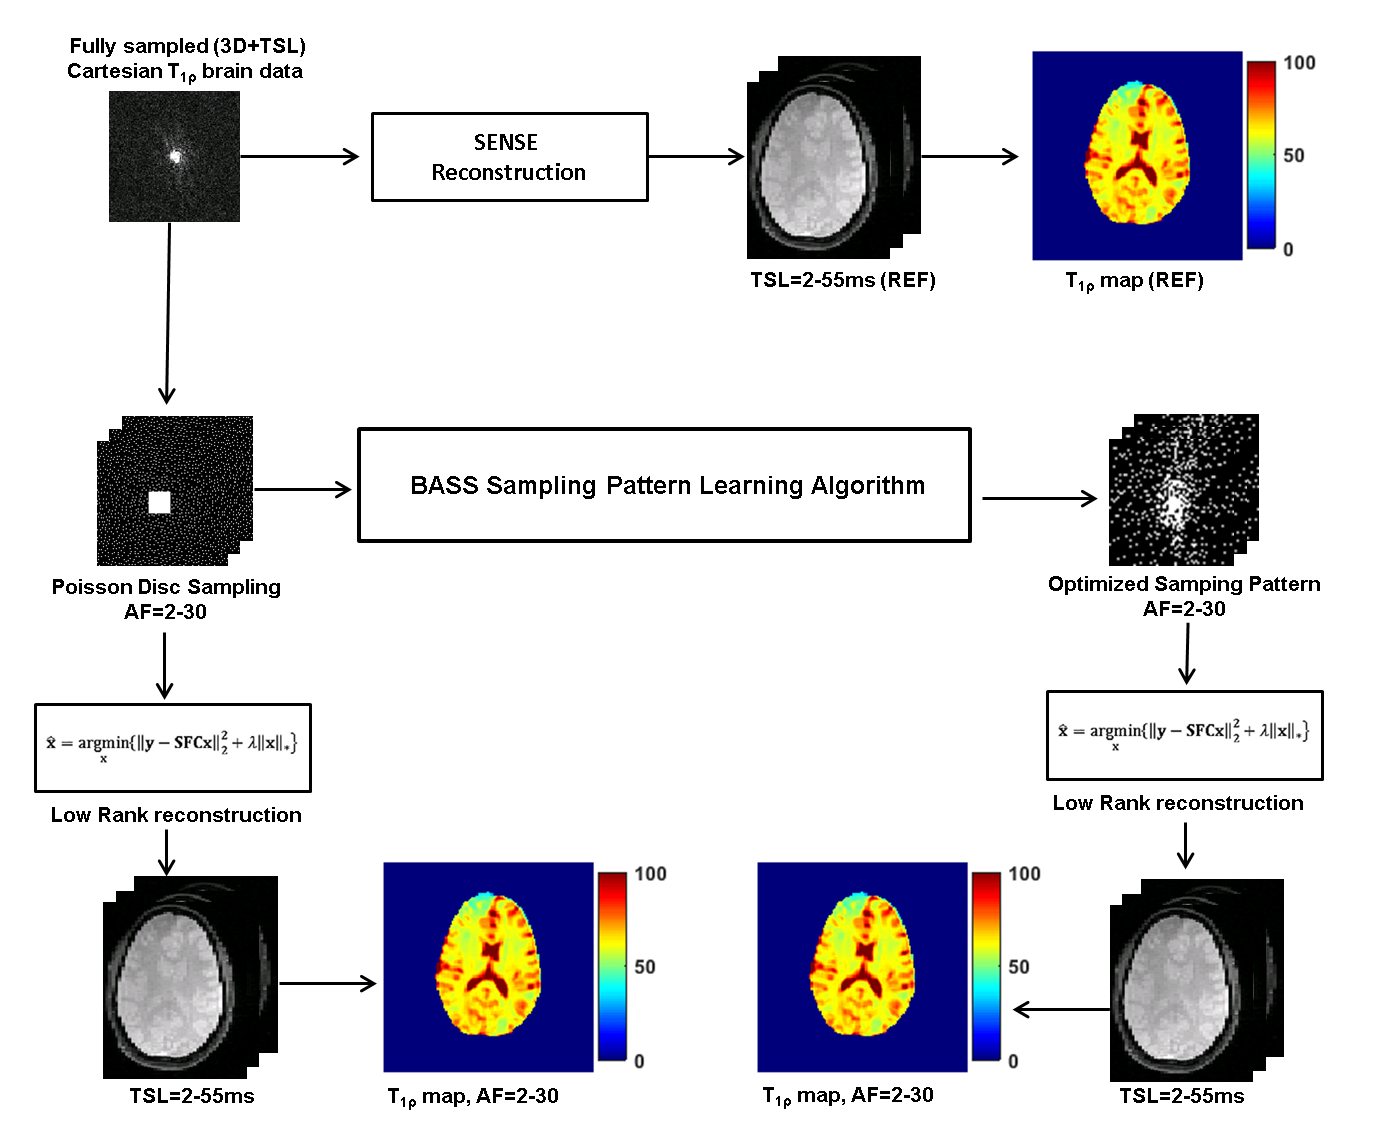
Five healthy volunteers (2 male/3 females, age = 28.8 ± 5.8 years) were recruited for the study. Fully sampled (FS) 3D-Cartesian T1ρ weighted brain images were acquired on a clinical 3T MRI scanner with a vendor supplied 20 channel receive only head coil. The MR acquisition parameters included: TR = 5 ms, TE = 2.9 ms, T1 delay = 1s, FOV = 240x240 mm2, matrix size = 256x128x64, flip angle = 8°, slice thickness = 2 mm, spin-lock frequency = 500 Hz, spin lock (TSL) durations of 2, 4, 6, 8, 10, 15, 25, 35, 45, 55 ms, total acquisition time = 32 minutes.Figure 1 shows a schematic representation of the data processing pipeline. FS Cartesian multi-coil data was reconstructed using sensitivity encoding (SENSE) reconstruction, and served as the reference(2). Poisson-disc (PD) sampling was used as the initial undersampling pattern, for acceleration factors (AF) of 2, 4, 6, 8, 10, 15, 20, 25, and 30. The new SP was optimized using a new machine learning algorithm, the bias accelerated subset selection (BASS) algorithm (3). The optimized SP was tested on separate training (5 images) and validation (5 images) data.
The optimal SP is given by:
$$\hat{Ω} = \arg\min_{Ω} \sum_{i=1}^{N_i} f( \mathbf{m}_{i} , FC R(S_Ω \mathbf{m}_{i}, Ω)) $$
and the efficiency of the SP was defined as:
$$f(\mathbf{m}_{i},\hat{\mathbf{m}}_{i})= \frac{|| \mathbf{m}_{i}- \hat{\mathbf{m}}_{i} ||_2^2}{|| \mathbf{m}_{i}||_2^2 } $$
where $$$\hat{Ω}$$$ is the estimated optimal SP of size M, $$$N_i$$$ is the number of data items used for training, $$$\mathbf{m}_{i}$$$ are the k-space data samples used for reconstruction, $$$ R(S_Ω \mathbf{m}_{i}, Ω) $$$ represents the fixed recovery algorithm used.
To test the efficacy of the optimized SP, all methods use the same low-rank reconstruction technique that used a nuclear norm of the reconstructed image vector x reordered as a Casorati matrix(4) and the cost-function was minimized using MFISTA-VA algorithm (5). Mono-exponential T1ρ fitting of the reconstructed TSL time series was performed (6). Normalized root mean square error (NRMSE) was calculated optimized k-space, reconstructed images, and the NRMSE errors compared to the reference for the final T1ρ maps.
Results
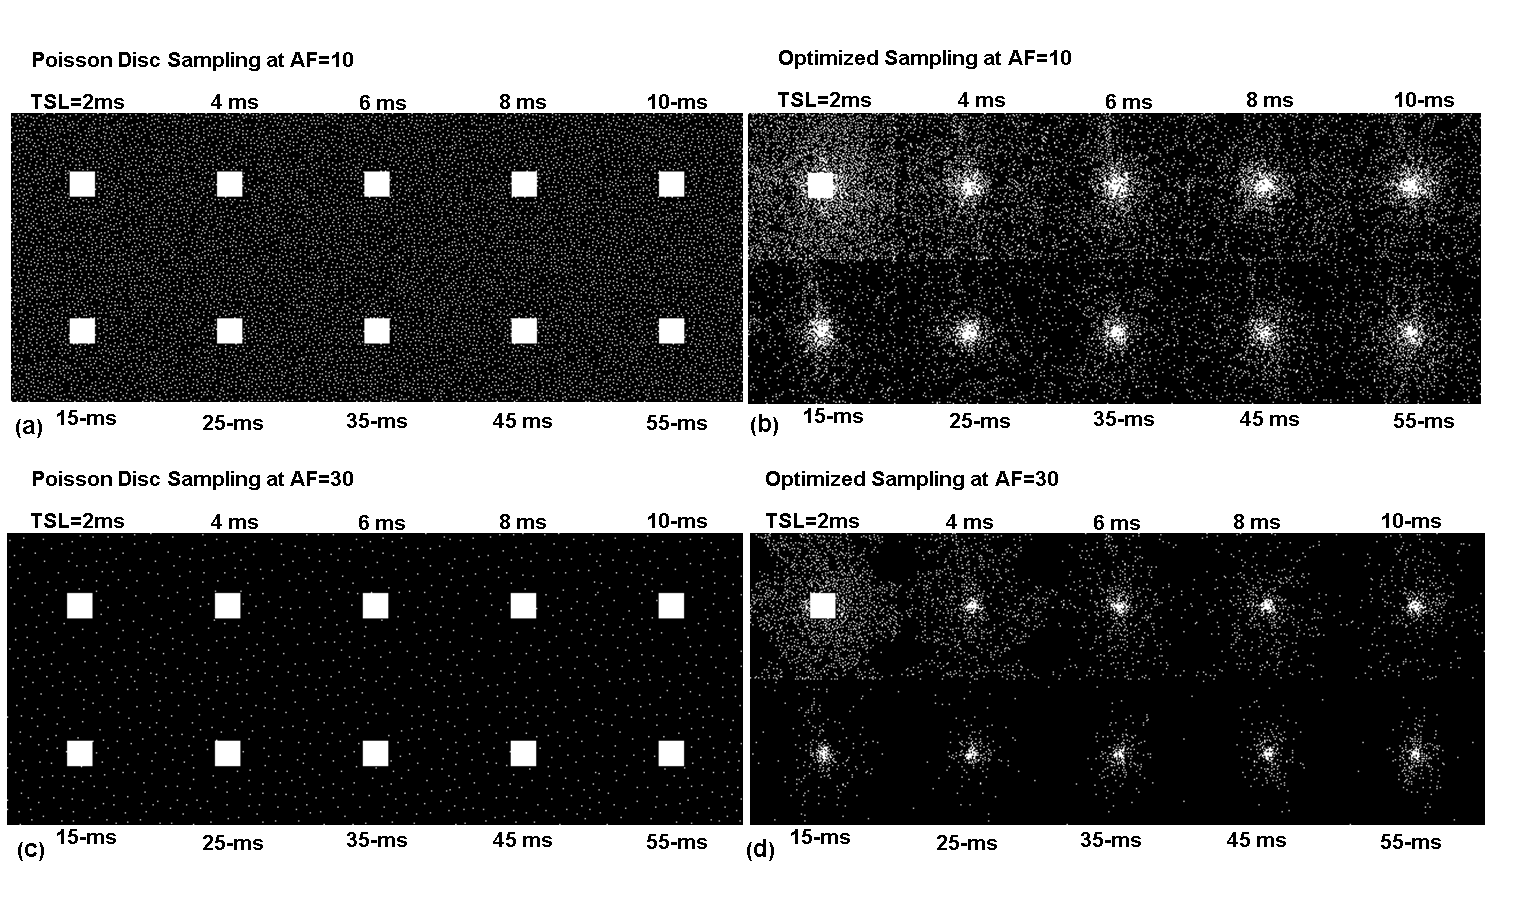
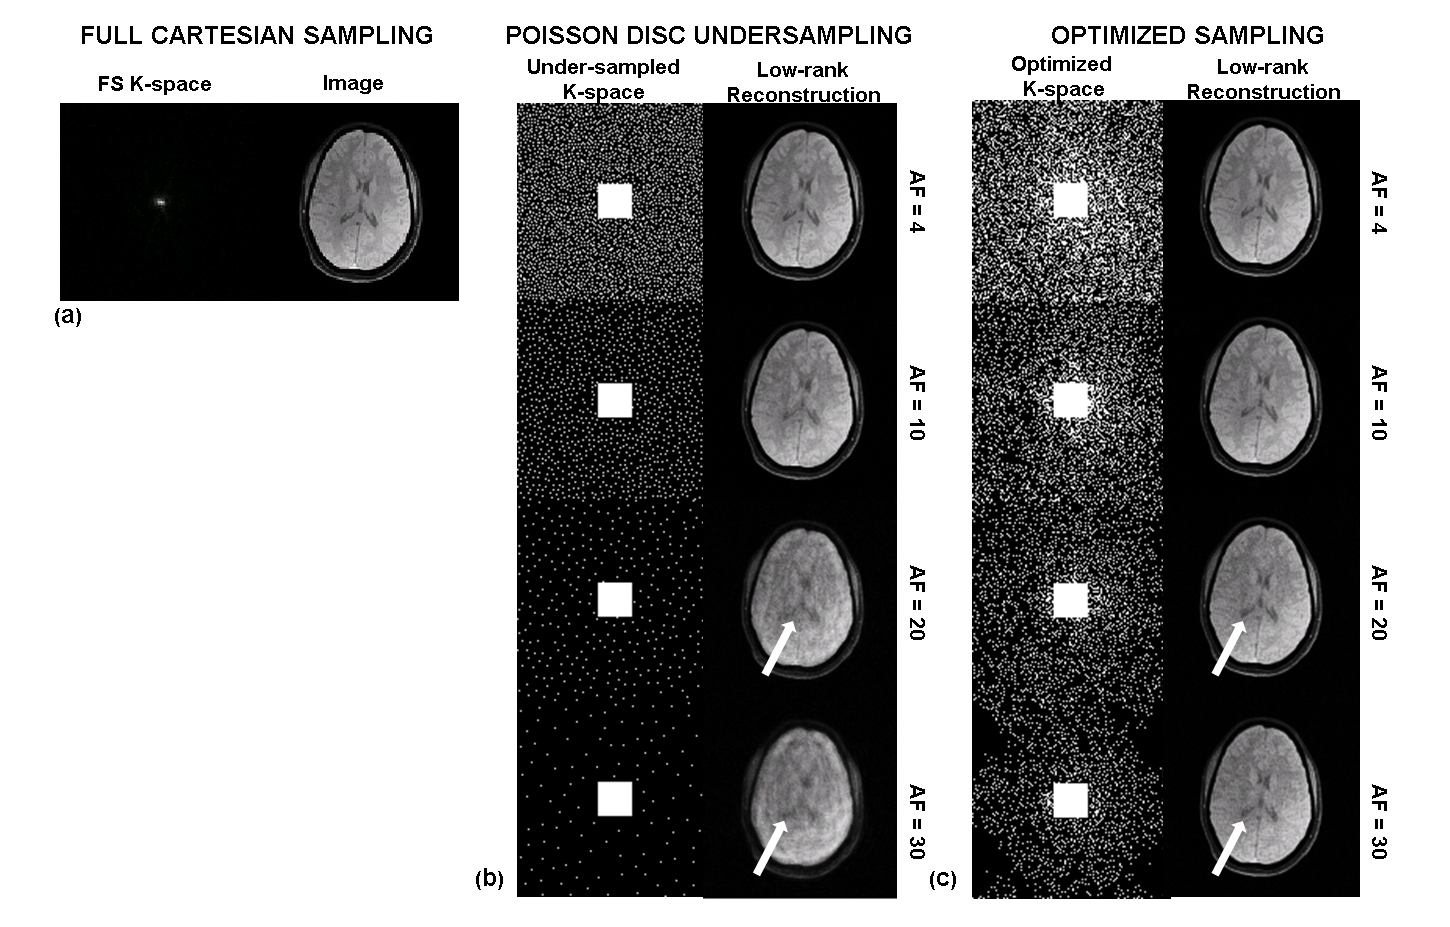
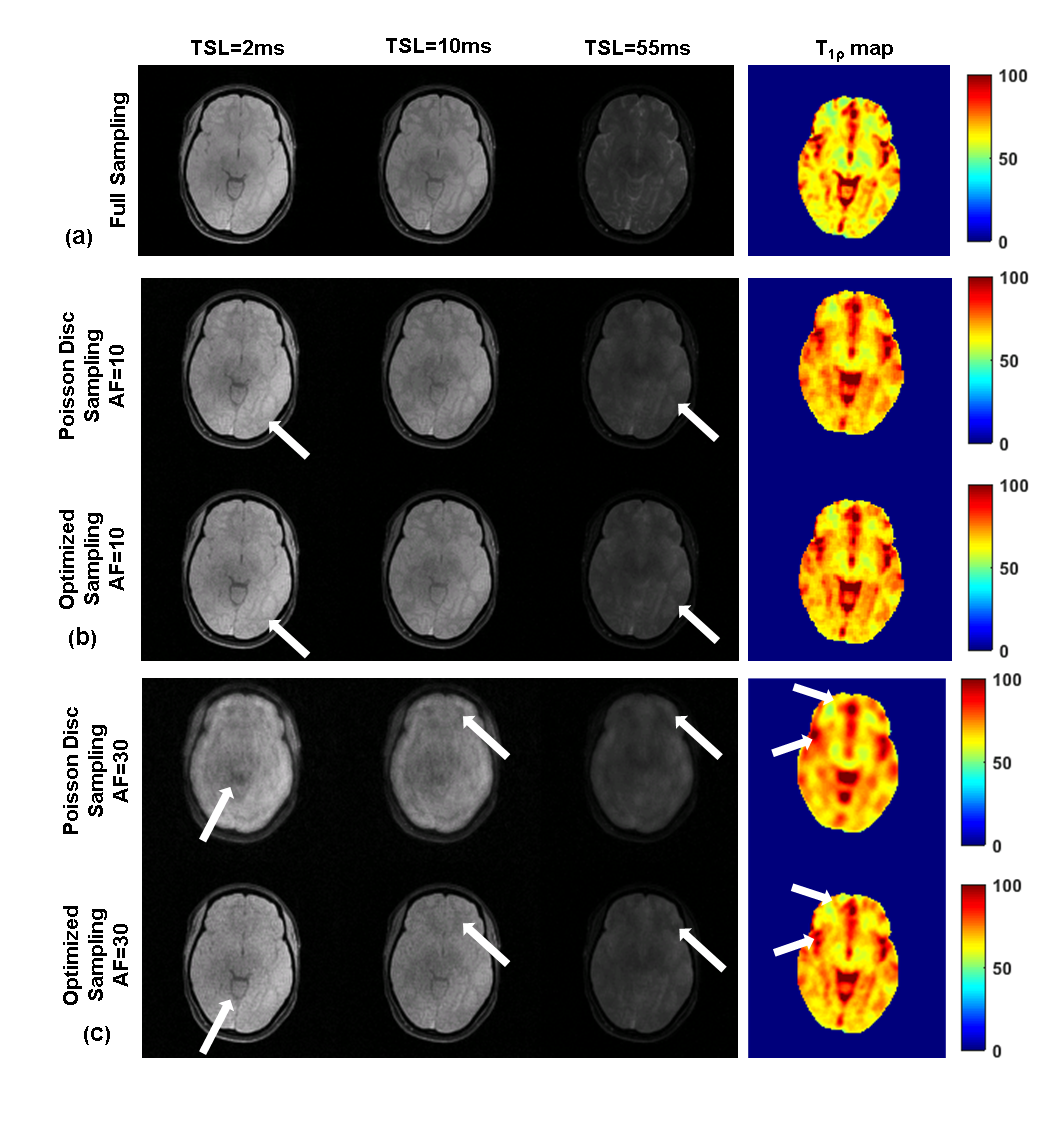
Figure 2 shows the initial PD sampling across the 2D+TSL time data and the optimized SP generated at different AFs. Figure 3 shows the comparison of performance between FS, PD and the optimized SP at increasing AFs. Figure 4 shows the performance difference between FS, PD and optimized SP for different TSL images, and the resulting T1ρ map. Figure 5 shows the NRMSE errors for training and validation data, PD sampling and optimized SP at different AFs, and the resulting improvement of the optimized SP on the final brain T1ρ maps at different AFs.Discussion and Conclusion
The results in this study suggest optimized sampling improves significantly in performance with increased AF’s. Optimization of the SP is a potentially viable technique to reduce acquisition time using prospectively undersampled T1ρ mapping sequences in the brain.Acknowledgements
This research was supported by the This study is supported by NIH grants R21-AR075259-01A1, R01-AR076328, R01-AR067156, and R01-AR068966, and was performed under the rubric of the Center of Advanced Imaging Innovation and Research (CAI2R), an NIBIB Biomedical Technology Resource Center (NIH P41-EB017183).References
1. Gilani IA, Sepponen R. Quantitative rotating frame relaxometry methods in MRI. NMR Biomed 2016;29(6):841-861.
2. Pruessmann KP, Weiger M, Bornert P, Boesiger P. Advances in sensitivity encoding with arbitrary k-space trajectories. Magn Reson Med 2001;46(4):638-651.
3. Zibetti MVW, Herman GT, Regatte RR. Fast Data-Driven Learning of MRI Sampling Pattern for Large Scale Problems. arXiv Prepr 2020:1-18.
4. Haldar JP, Liang ZP. Spatiotemporal imaging with partially separable functions: A matrix recovery approach. IEEE International Symposium on Biomedical Imaging 2010;4:716-719.
5. Zibetti MVW, Helou ES, Regatte RR, Herman GT. Monotone FISTA with variable acceleration for compressed sensing magnetic resonance imaging. IEEE Trans Comput Imaging 2019;5(1):109-119.
6. Menon RG, Zibetti MVW, Jain R, Ge Y, Regatte RR. Performance Comparison of Compressed Sensing Algorithms for Accelerating T1rho Mapping of Human Brain. J Magn Reson Imaging 2020.
Figures