1276
T2 Mapping of the Cranial Nerves with Multi-Interleaved X-prepared Turbo-spine Echo with Intuitive Relaxometry (MIXTURE) FLAIR1Department of Diagnostic Radiology and Radiation Oncology, Chiba University, Chiba, Japan, 2Department of Radiology, Eastern Chiba Medical Center, Togane, Japan, 3Philips Japan, Tokyo, Japan, 4Philips Healthcare, Cleveland, OH, United States
Synopsis
Multi-Interleaved X-prepared tse with inTUitive Relaxometry (MIXTURE) is a 3D TSE sequence that can produce high-resolution morphology images and T2 map simultaneously. The purpose of this study was to evaluate MIXTURE FLAIR for T2 measurement of the cranial nerves. MIXTURE FLAIR produced reliable T2 values in the fantom study. The variance of T2 value measured by MIXTURE FLAIR was relatively small, and the T2 value was significantly smaller than multi-echo TSE and MIXTURE T2 in the volunteer study. MIXTURE FLAIR enabled the T2 value measurement of the cranial nerves, which was not previously feasible.
Introduction
Quantification of the cerebral nerves has rarely been reported. In peripheral nerves, T2 values have been reported to reflect neuropathy in demyelinating diseases and cervical spondylosis, and to be more diagnostic than known morphological features.1-4 However, cerebral nerves are thin and surrounded by cerebrospinal fluid, interfering with accurate measurement of T2 value. Multi-Interleaved X-prepared tse with inTUitive Relaxometry (MIXTURE) is a novel sequence and a series of interleaved 3D TSE scans that can set arbitrary echo numbers and echo times using the T2 preparation pulses. Several image contrasts such as FLAIR and T2 mapping can be acquired by scanning at least two echo time images. The purpose of this study is to compare classical multi-echo TSE T2 mapping, MIXTURE T2 without cerebrospinal fluid suppression, and MIXTURE FLAIR, and to evaluate the feasibility of T2 value measurements for the cerebral nerves.Materials and methods
All subjects were examined with a 3.0T whole-body clinical system (Ingenia CX, Philips Healthcare). The acquisition parameters are listed in Figure 2.Fantom study
Five phantoms were prepared by changing the mixing ratio of sucrose and water (sucrose content: 55.1%, 45.5%, 39.4%, 36.4%, 36.3%, and 24.5%). A region of interest (ROI) of 88.0 mm2 was placed, and T2 values were measured. The reproducibility of the measurements was evaluated by interclass correlation coefficients (ICCs), which were interpreted as follows: < 0.20, poor; 0.21-0.40, fair; 0.41-0.60, moderate; 0.61-0.80, good; 0.81-1.00, excellent.
Volunteer study
Eight healthy volunteers (mean 26.6 years; range, 22-39 years; 7 males and 1 female) underwent multi-echo TSE, MIXTURE T2, and MIXTURE FLAIR. A neuroradiologist (15 years' experience of neuroradiology) set ROI on bilateral trigeminal nerves, cochleovestibular nerves, and pons of the morphology images so that cerebrospinal fluid was not included (Figure 3). T2 values were evaluated by the Wilcoxon signed-rank test and P-values were corrected by the Bonferroni method. A P-value<0.05 was considered statistically significant.
Results
The T2 values of sucrose phantoms and ICCs among Multi-echo TSE, MIXTURE T2, and MIXTURE TFLAIR are shown in Figure 4. Agreements of T2 values among the three sequences were excellent. The T2 values of the trigeminal nerve, cochlear nerve, and pons in the volunteer study are shown in Figure 5. The range of T2 value was wider on multi-echo TSE and MIXTUER T2 than MIXTURE FLAIR on the trigeminal and vestibulocochlear nerves. This trend was especially evident on the vestibulocochlear nerve. MIXTURE FLAIR showed a significantly lower T2 value than multi-echo TSE in the trigeminal nerve and also higher than multi-echo TSE and MIXTURE T2 in the vestibulocochlear nerve. Although the T2 value ranges on the pons was relatively narrow, the T2 value of MIXURE FLAIR was significantly lower than multi-echo TSE.Discussion
In the phantom study, MIXTURE showed high reproducibility among conventional Multi-echo TSE, MIXTURE T2, and MIXTURE FLAIR, indicating that MIXTURE is a reliable method for T2 measurement.In the volunteer study, the Multi-echo TSE and MIXTURE T2 showed significant noise caused by surrounding cerebrospinal fluid. The noise resulted in widening the range of T2 value measurement and in reducing the reliability of measured T2 value. The wider range of T2 values in the vestibulocochlear nerve than in the trigeminal nerve may be attributed to the fact that the vestibulocochlear nerve is thinner and less prone to ROI. In contrast, MIXTURE T2-FLAIR produced a T2 map with less noise and more reliable values
MIXTURE FLAIR enables T2 values evaluation of the cranial nerves, which has not been possible in the past. In several peripheral nerve disorders, T2 value measurement is considered helpful for diagnosis. Chronic inflammatory demyelinating polyneuropathy has been reported that T2 values are more accurate than morphological changes for diagnosis.1,2 Demyelination of the peripheral nerve may occur before clinical symptoms become apparent, and early detection of neuropathy may help predict prognosis and determine treatment strategy. Cervical spondylosis often presents with multifocal nerve compression, but it is often difficult to determine which lesion is responsible for the neuropathy. There are reports that the T2 map was valuable in identifying the responsible lesion. 3,4
Conclusion
MIXTURE is a novel sequence that provides a high-resolution morphology image and T2 map and can measure T2 values with high reproducibility. MIXTURE FLAIR enabled the T2 value measurement in the cranial nerves, which was not previously feasible.Acknowledgements
No acknowledgement found.References
- Hiwatashi A, Togao O, Yamashita K, Kikuchi K, Momosaka D, Nakatake H, Yamasaki R, Ogata H, Yoneyama M, Kira J-I, Honda H. Lumbar plexus in patients with chronic inflammatory demyelinating polyradiculoneuropathy: evaluation with simultaneous T2 mapping and neurography method with SHINKEI. Br J Radiol 2018;91(1092):20180501.
- Hiwatashi A, Togao O, Yamashita K, Kikuchi K, Momosaka D, Nakatake H, Yamasaki R, Ogata H, Yoneyama M, Kira J-I, Honda H. Simultaneous MR neurography and apparent T2 mapping in brachial plexus: Evaluation of patients with chronic inflammatory demyelinating polyradiculoneuropathy. Magn Reson Imaging 2019;55:112–117.
- Eguchi Y, Enomoto K, Sato T, Watanabe A, Sakai T, Norimoto M, Yoneyama M, Aoki Y, Suzuki M, Yamanaka H, Others. Simultaneous MR neurography and apparent T2 mapping of cervical nerve roots before microendoscopic surgery to treat patient with radiculopathy due to cervical disc herniation: Preliminary results. J Clin Neurosci 2020;74:213–219.
- Sato T, Eguchi Y, Norimoto M, Inoue M, Enomoto K, Watanabe A, Sakai T, Yoneyama M, Aoki Y, Orita S, Narita M, Inage K, Shiga Y, Umimura T, Sato M, Suzuki M, Takaoka H, Mizuki N, Kim G, Hozumi T, Hirosawa N, Furuya T, Maki S, Nakamura J, Hagiwara S, Koda M, Akazawa T, Takahashi H, Takahashi K, Ohtori S. Diagnosis of lumbar radiculopathy using simultaneous MR neurography and apparent T2 mapping. J Clin Neurosci 2020. doi: 10.1016/j.jocn.2020.04.072.
Figures
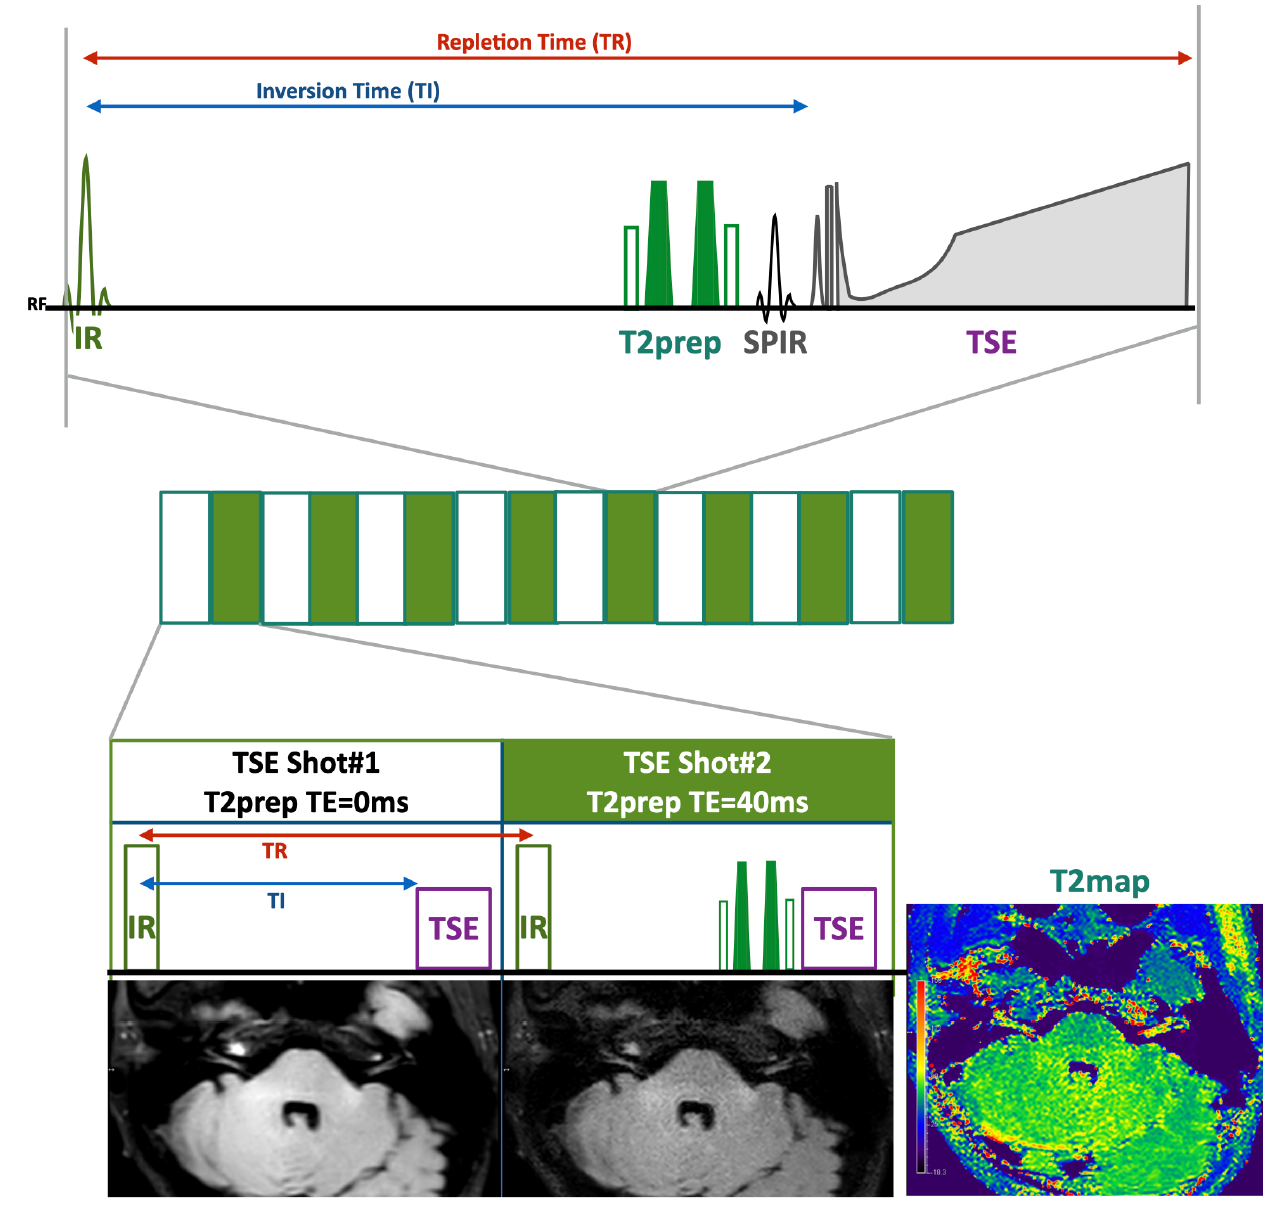
Figure 1. Scheme of the MIXTURE (Multi-Interleaved X-prepared tse with inTUitive RElaxometry)
T2-mapping was performed using T2-prepared 3D segmented turbo spin-echo (TSE) with variable refocusing pulse trains. Two images with different TE (TE = 0 and 50ms) were acquired with interleaved acquisition. To obtain FLAIR contrast, inversion time (TI) is adjusted to suppress cerebrospinal fluid.
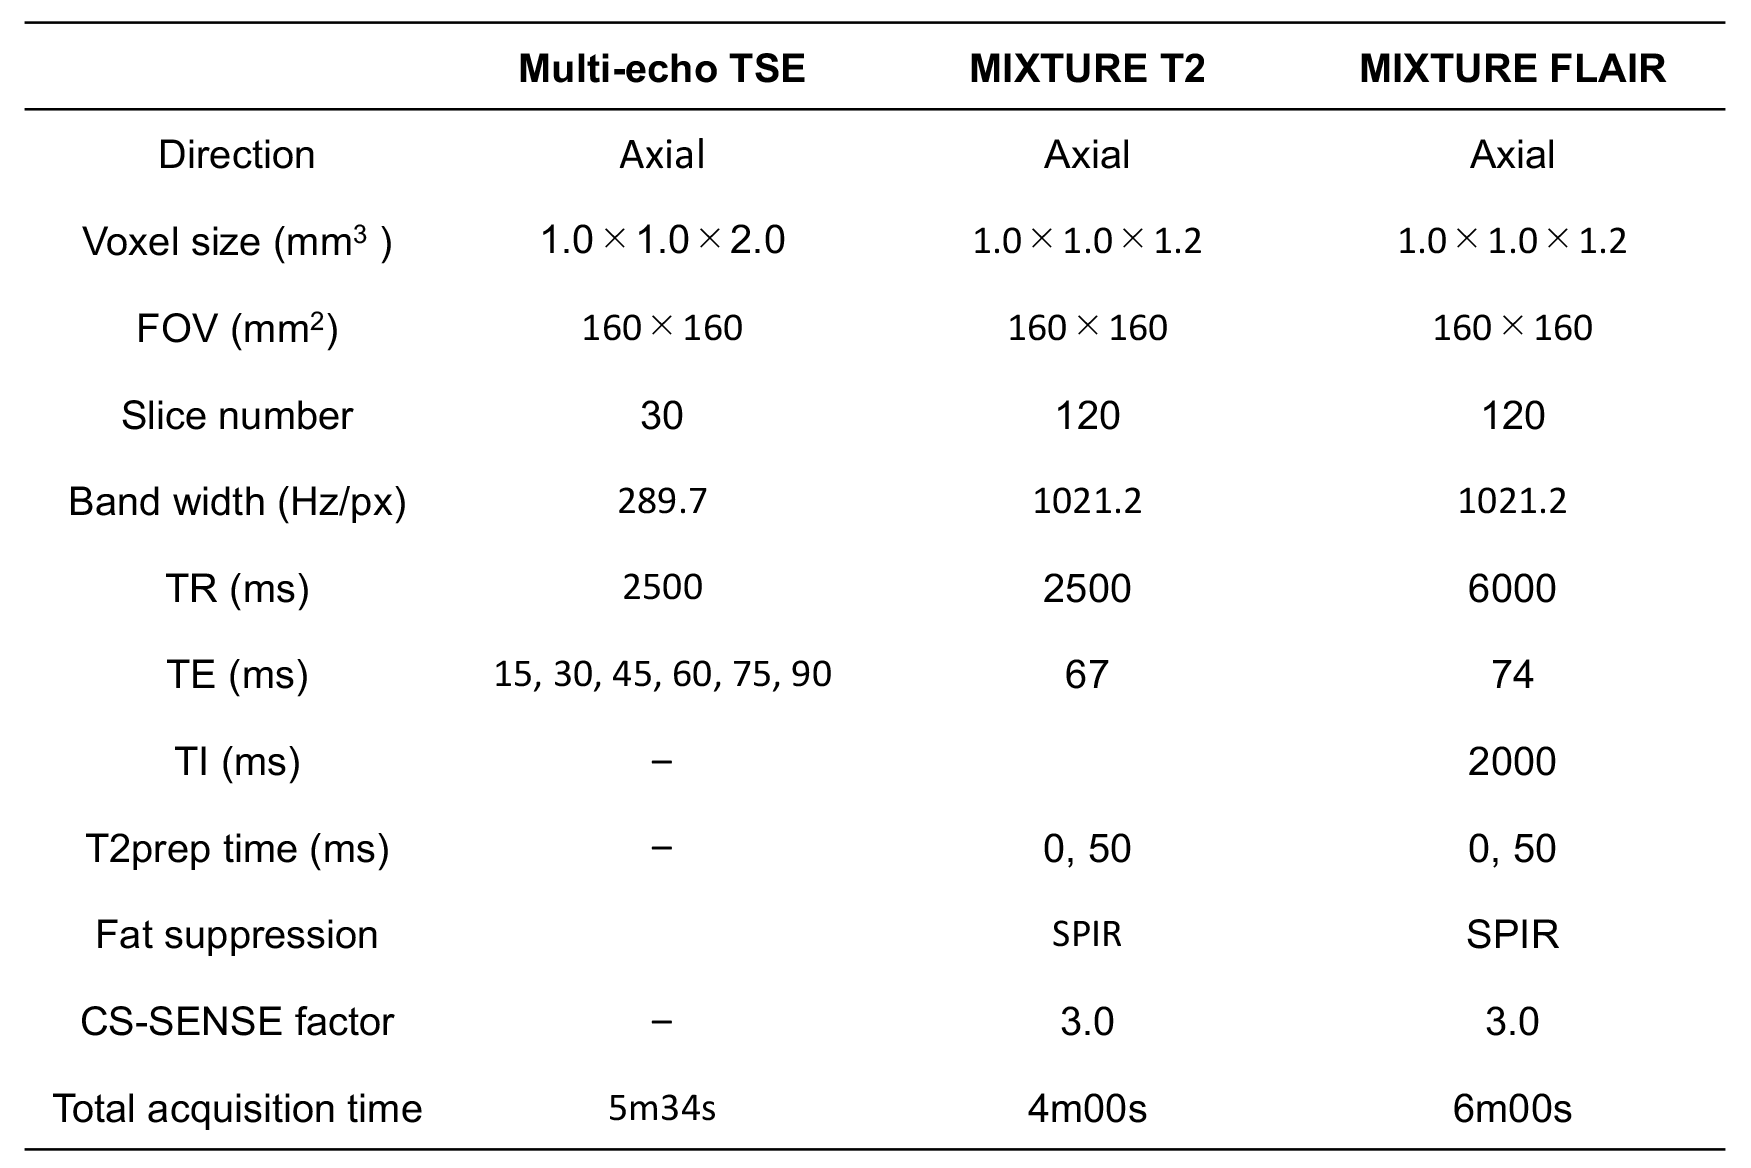
Figure 2. Acquisition parameters of multi-echo TSE, MIXURE T2, and MIXTURE FLAIR
Three sequences covered the pons including the root entry regions of the trigeminal and vestibulocochlear nerves.
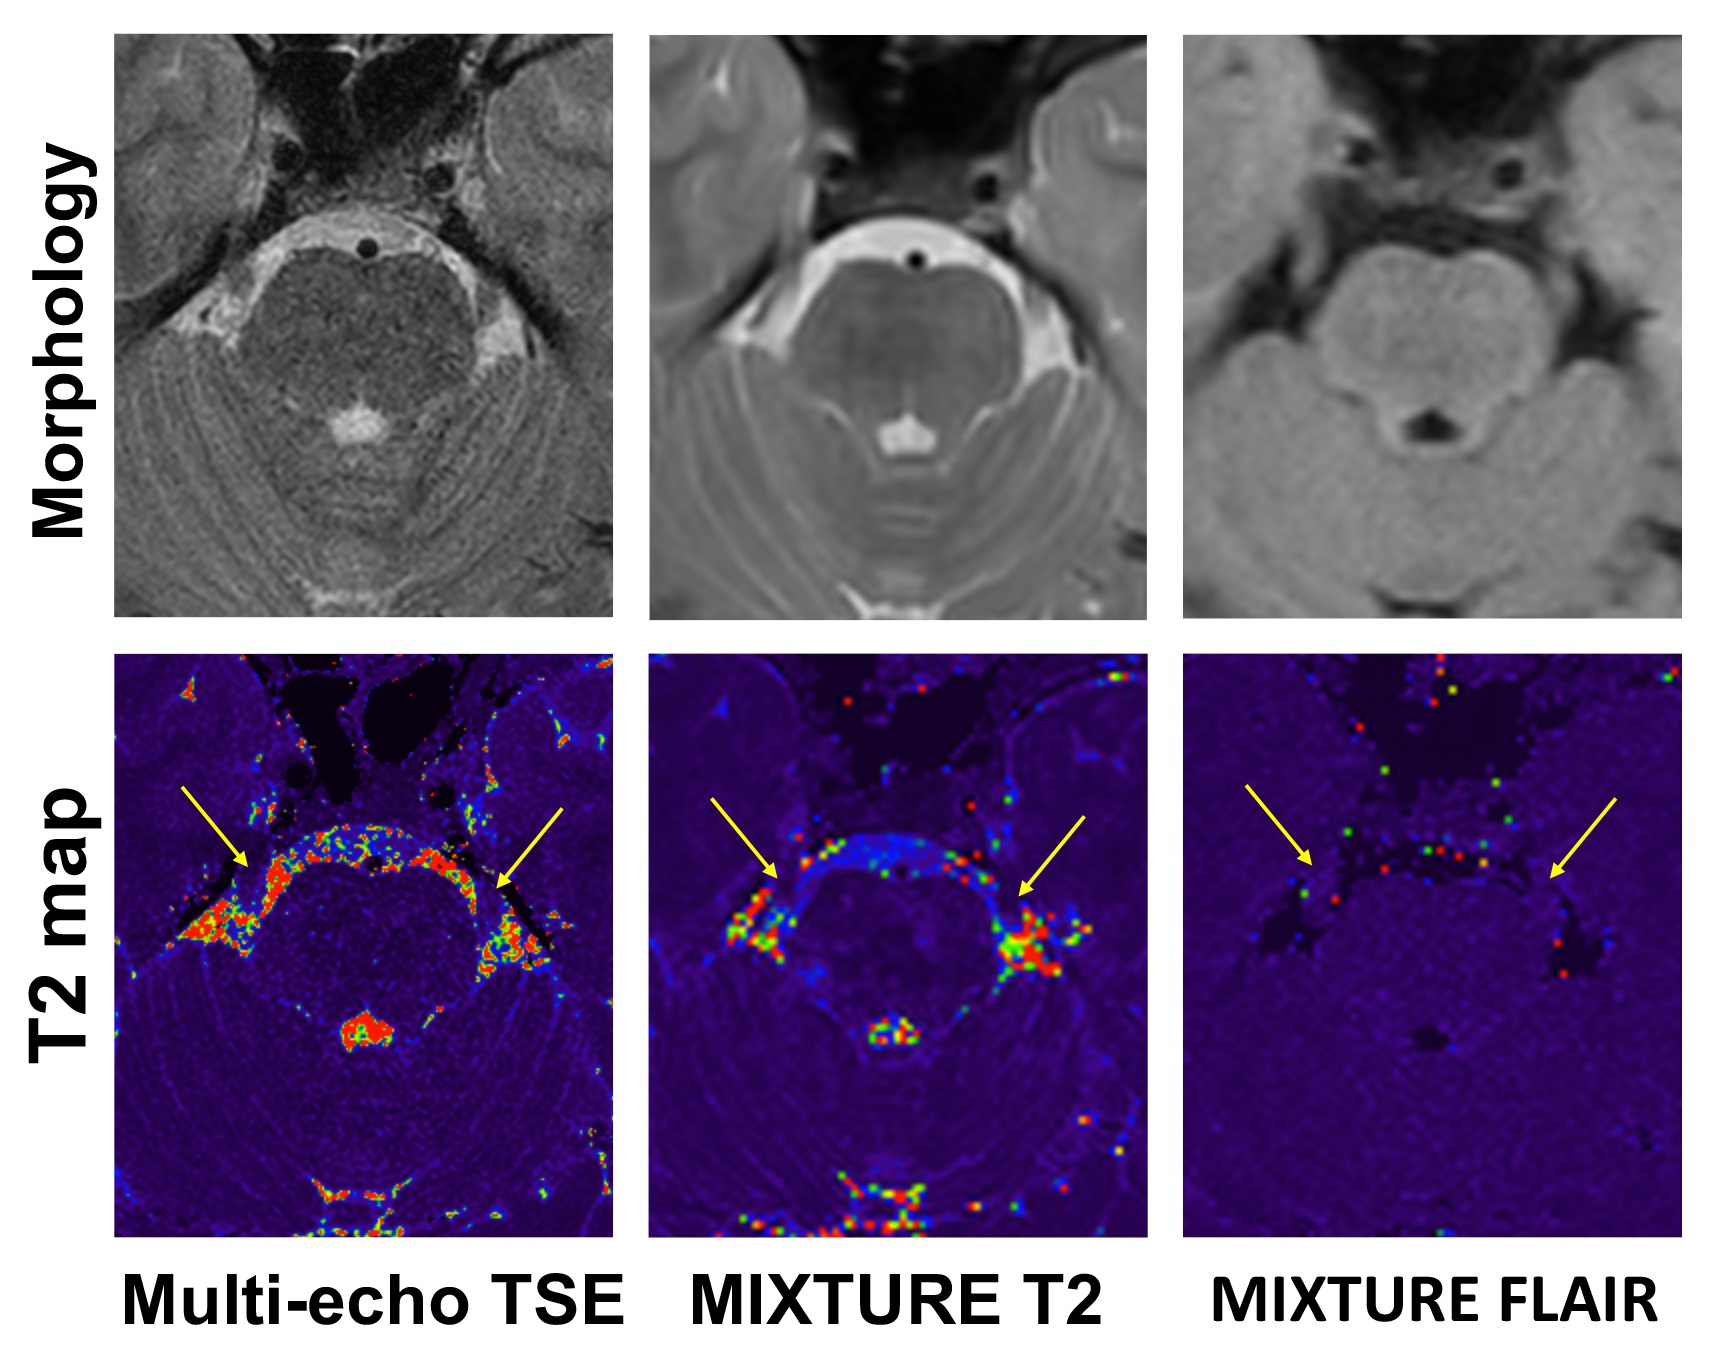
Figure 3. Trigeminal nerve presentation of multi-echo TSE, MIXURE T2, and MIXTURE FLAIR
Arrows indicates bilateral trigeminal nerves. The prepontine cistern around the trigeminal nerve looks noisy on T2 maps of multi-echo TSE and MIXURE T2, whereas the noise is reduced on the T2 map of MIXURE FLAIR.
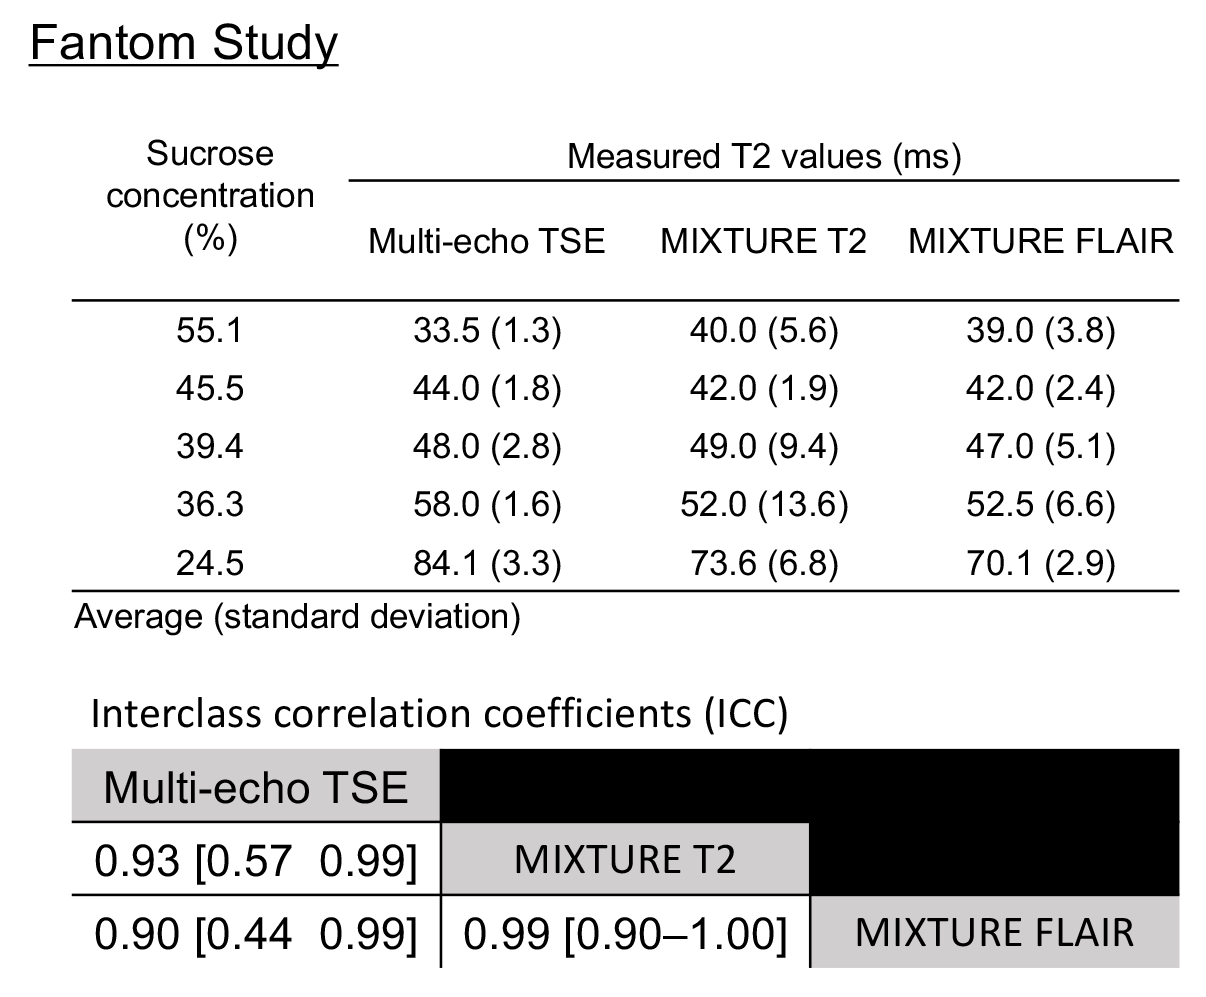
Figure 4. The result of fantom study
(Upper table) Five phantoms were prepared by varying the concentration of scrose and water. Measured T2 values with multi-echo TSE, MIXURE T2, and MIXTURE FLAIR were listed. (Lower table) Interclass correlation coefficients (ICCs) among three sequences shows almost excellent agreements (>0.81).
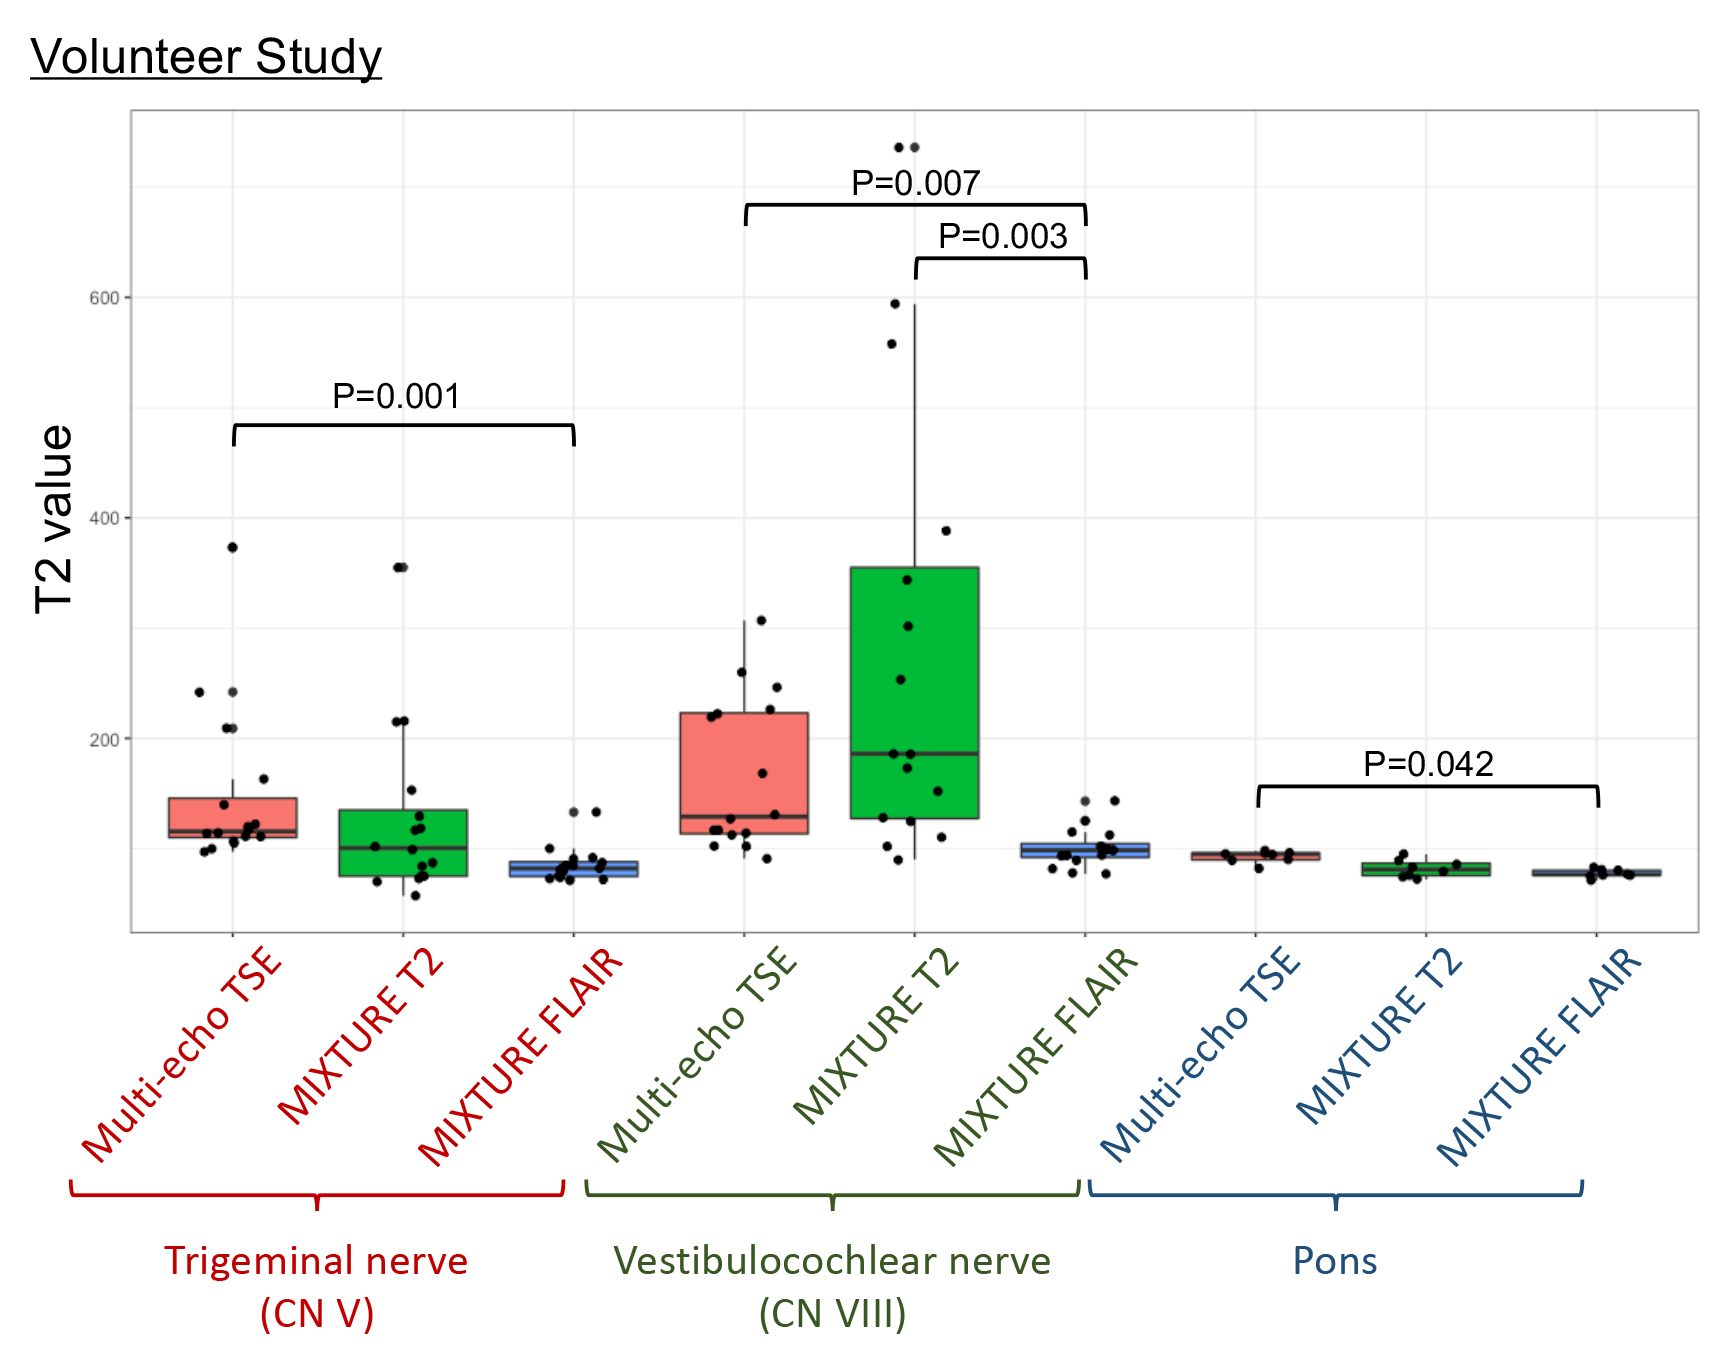
Figure 5. Boxplots of the T2 values of the trigeminal nerve, vestibulocochlear nerve, and pons in the eight healthy volunteers
The range of T2 value was wider on multi-echo TSE and MIXTUER T2 than MIXTURE FLAIR on the trigeminal and vestibulocochlear nerves. This trend was especially evident in the vestibulocochlear nerve. MIXTURE FLAIR showed a significantly higher T2 value than multi-echo TSE in the trigeminal nerve and pons, and also higher than multi-echo TSE and MIXTURE T2 in the vestibulocochlear nerve.