1272
Precise localization of Deep brain nuclei in MNI-space guided by Hybrid Multi-modal MRI Brain Atlas1School of Information Science and Technology, ShanghaiTech University, Shanghai, China, 2Department of Radiology, The Second Affiliated Hospital, Zhejiang, University School of Medicine, Hangzhou, China, 3Institute for Medical Imaging Technology, School of Biomedical Engineering, Shanghai, Jiao Tong University, Shanghai, China, 4Shanghai Engineering Research Center of Intelligent Vision and Imaging, ShanghaiTech University, Shanghai, China, 5iHuman Institute, ShanghaiTech University, Shanghai, China
Synopsis
Our work successfully provides precious manual depiction of typical DBNs in the standard MNI space with the guidance of constructed MNI-spaced average multi-modal template (T1-weighted and quantitative susceptibility mapping (QSM)). 10 pairs of DBN and their sub-nuclei, are manually depicted including caudate nucleus (CN), putamen (Pu), ventral pallidum (VP), globus pallidus (GP) (internal and external divisions, GPi & GPe), nucleus accumbens (NAC), subthalamic nucleus (STN), substantia nigra (SN) (substantia nigra pars compacta (SNc) & substantia nigra pars reticulata (SNr)) and red nucleus (RN).
Introduction
Deep brain nuclei (DBN) are closely related to the pathogenesis of neurodegenerative diseases, such as Parkinson’s Disease, Dystonia or Obsessive-compulsive Disorder. It is thus crucial to correctly identify and localize the DBN for refining targets of neurologic disease treatment such as deep brain stimulation. However, due to the iron-deposition, DBN are difficult to distinguish on routine imaging (i.e. T1 weighted (T1w) MRI). Standard space brain atlas, such as the most widely used MNI space3, serves as reference for DBN identification. There have been several atlases were constructed with specific emphasis on the identification of DBN. Without the guidance of the most iron-sensitive contrast quantitative susceptibility mapping (QSM), the boundary of DBN structure in MNI space are however ambiguous4. Many small-size nuclei (i.e. subthalamic nucleus (STN), thalamic ventral intermediate (Vim) and nucleus accumbens (NAC)) are never defined in MNI space. To-this-end, we propose to construct a QSM atlas in MNI space, which is achieved by performing weighted hybrid image fusion on T1w and QSM. In our strategy, T1w provides clear GM&WM contrast and acts as guidance to MNI space; while QSM perform superb contrast in DBN and highlights positions for iron-rich nuclei in the MNI space. A number of 100 healthy subjects with paired T1w & QSM images are involved in the atlas construction. In the standard template, we manually depict 10 pairs of DBN and their subnuclei, including caudate nucleus (CN), putamen (Pu), ventral pallidum (VP), globus pallidus (GP) (internal and external divisions, GPi & GPe), nucleus accumbens (NAC), subthalamic nucleus (STN), substantia nigra (SN) (substantia nigra pars compacta (SNc) & substantia nigra pars reticulata (SNr)) and red nucleus (RN). Specially, thalamus depiction is conducted on a handcrafted parcellation map on an individual 7 T QSM following the Hassler terminology, then carefully warped into 3T individual space and weighted fused into MNI space. To our best knowledge, nuclei including VP, STN, SNc, SNr, GPe, GPi are well identified in MNI space for the first time5.Methods
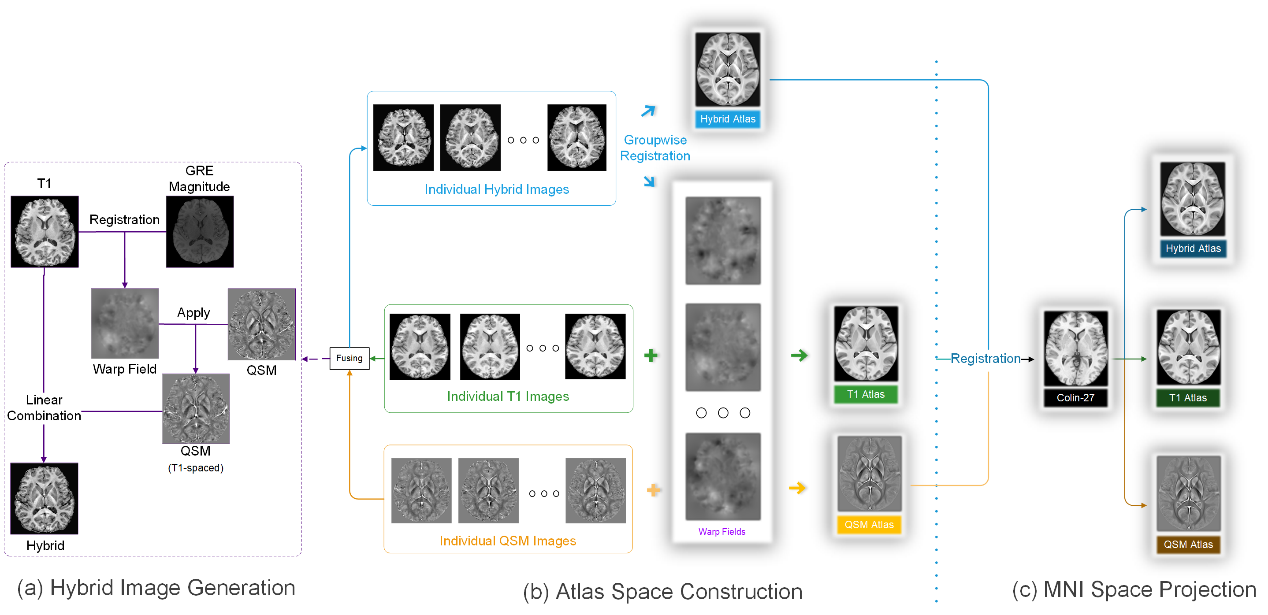
MRI scans of 100 young healthy volunteer (24.03±5 years old) was conducted on a 3.0-Tesla MR system (GE 750 Medical Systems, Milwaukee, WI). Structural T1w images were acquired using a fast-spoiled gradient recalled sequence; A three-dimensional multi-echo GRE sequence was utilized to acquire QSM images. The susceptibility maps were determined by the STAR-QSM algorithm2. Image processing on T1w including N4 bias field correction and BET brain extraction. For each subject, QSM is aligned with T1w using GRE magnitude as intermediate. The hybrid images are created by linear combination of T1w and QSM. Marking 3D image volume as $$$S$$$, the fusion process can be denoted as: $$$S_{hybrid}=S_{T1w}-\mu S_{QSM}$$$. Atlas space is created by invoking symmetric group-wise normalization (SyGN) algorithm1 on hybrid images. Initially, an average image is determined. In the following iterative process, we firstly perform registrations of all individual images to the average image, then average output warped images, finally perform a shift operation to the averaged image1, for keeping the template shape stable over iterations. In basal ganglia, nucleus annotations are manually performed, and thalamus is parceled referring to a 7 T individual QSM image.Result
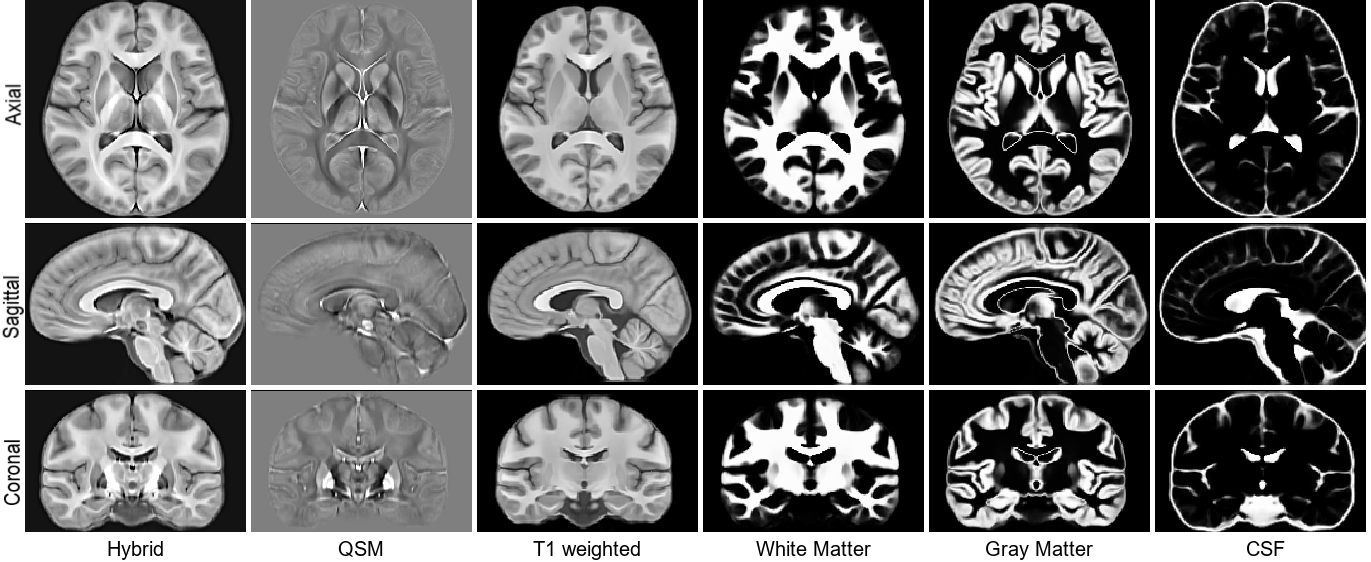
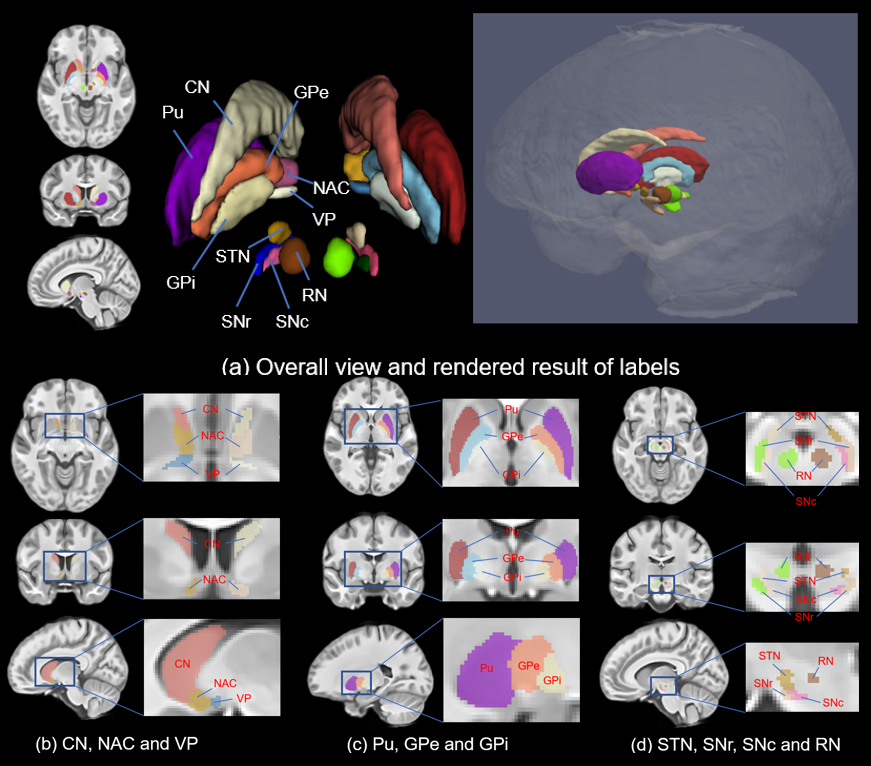
The representative slices of axial, sagittal and coronal views of the proposed MNI space Hybrid, QSM and T1w atlases, and probabilistic segmentation maps are shown in Fig.2. Both the T1w and QSM atlases exhibit sharp contrast among tissues, along with clear partition of tissues. Besides, the QSM atlas shows sharp cortical gully. Figure 3 shows the manual annotations of deep brain nuclei overlaid on the hybrid sections and the 3D rendering shown on the right. All the 10 labeled subcortical structures are displayed in the rendering image. Note that the thalamus is divided into 10 sub-regions, so there are in all 20 labels in the rendering image.Conclusion
In this contribution, we proposed MNI-space multi-contrast atlases, aiming at precisely localizing deep brain stimulation targeted small-size DBN. Benefitting from the well-defined data acquisition and processing strategy, the constructed MNI space QSM and T1w atlases exhibit both sharp brain tissue and clear DBN boundary. More importantly, the rich deep gray matter feature from QSM atlas enables providing accurate parcellation on more interesting small-size nuclei in MNI space, to satisfy the requirement of high-accuracy DBN parcellation in deep brain stimulation.Acknowledgements
No acknowledgement found.References
1. Avants, B. B., et al. (2010). "The optimal template effect in hippocampus studies of diseased populations." Neuroimage 49(3): 2457-2466.
2. Wei, H., Dibb, R., Zhou, Y., Sun, Y., Xu, J., Wang, N., & Liu, C. (2015). Streaking artifact reduction for quantitative susceptibility mapping of sources with large dynamic range. NMR in Biomedicine, 28(10), 1294-1303.
3. Brett, M., Johnsrude, I. S., & Owen, A. M. (2002). The problem of functional localization in the human brain. Nature reviews neuroscience, 3(3), 243-249.
4. Li, W., Wu, B., & Liu, C. (2011). Quantitative susceptibility mapping of human brain reflects spatial variation in tissue composition. Neuroimage, 55(4), 1645-1656.
5. Telford, R., & Vattoth, S. (2014). MR anatomy of deep brain nuclei with special reference to specific diseases and deep brain stimulation localization. The neuroradiology journal, 27(1), 29-43.
Figures