1271
Feasibility of model-based omega-3 fatty acid fraction mapping using multi-echo gradient-echo imaging at 3T1Department of Diagnostic and Interventional Radiology, School of Medicine, Technical University of Munich, Munich, Germany, 2Else Kröner Fresenius Center for Nutritional Medicine, Technical University of Munich, Freising, Germany
Synopsis
A non-invasive method allowing the probing of the relative ω-3 fatty acid content in adipose tissue has the potential to reveal unknown metabolic patterns in physiology and pathology. In the current study, a model-based triglyceride mapping scheme is extended to enable the differentiation between ω-3 and non-ω-3 fatty acids by exploiting additional knowledge about the chemical shift properties. This extended scheme is combined with a chemical shift encoding imaging sequence and evaluated in a phantom validation experiment against gas chromatography–mass spectrometry. Furthermore, feasibility is demonstrated in both in vitro and in vivo settings.
Introduction / Purpose
Metabolic syndrome causes a huge socioeconomic burden given its high prevalence and associated medical disorders, including cardiovascular diseases and type 2 diabetes.1 Based on its manifestation; the metabolic syndrome is considered as a result of disturbed metabolic processes in response to the modern Western lifestyle and is linked with triglyceride storage in adipose tissue (AT). The study of the structure of the stored fatty acids (esterified with glycerol to form triglycerides) is therefore of great interest as their characteristics may reflect metabolic activity, nutritional aspects and pathophysiologic relevance.2 As for example, certain essential ω-3 fatty acids are required for the synthesis of anti-inflammatory prostaglandins, thromboxanes and leukotrienes.3 A better analysis of the ω-3 fatty acids patterns may therefore enable a better understanding of the underlying metabolic processes and may potentially serve as a future biomarker for chronic cardiometabolic diseases. The purpose of the present study was to investigate the feasibility of spatially-resolved model-based ω-3 fatty acid fraction mapping using multi-echo gradient-echo imaging at 3T.Methods
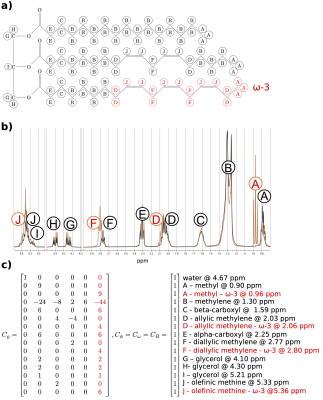
Signal modelingChemical shift information about additional deshielding effects for ω-3 fatty acids was obtained from 360MHz NMR experiments and translated into a signal model.(Fig.1) Therefore, a previously described triglyceride model4 was extended to additionally allow for the differentiation of ω-3 and non-ω-3 fatty acids. The model was implemented using a generalized formulation5 and solved using the VARPRO method6:
$$S_{n}=\sum_{m=1}^{M}\varrho_{m}e^{i\phi_{m}}e^{\left(i\omega_{m}-R_{m}\right)t_{n}}$$
where $$$S_n$$$ is the sampled complex signal at $$$n$$$ echo times $$$t_n$$$ of the sum of $$$M$$$ chemical species with their corresponding proton density $$$\varrho_m$$$, initial phase $$$\phi_m$$$, frequency $$$\omega_m$$$ and relaxation rate $$$R_m$$$. The employed set of constraints and peak frequencies (Fig.1c) allow the estimation of: the ω-3 fatty acid fraction, the number of double bonds (ndb) and the number of methylene-interrupted double bonds (nmidb) per triglyceride, the mean fatty acid carbon chain length (CL), the proton density fat fraction (PDFF), T2* and the fieldmap (not shown).
Phantom experiment
18 phantom vials with calibrated varying ω-3 fractions (0/0.5/1/1.5/2/2.5/3/4/5/7.5/10/15/20/25/30/35/40/45mol%) were produced by mixing sunflower oil (containing no ω-3 fatty acids) and linseed oil (high ω-3 fatty acid content) with known fatty acid profiles. The calibration was based on gas chromatography–mass spectrometry (GC-MS) measurements using fatty acid methyl ester GC-MS (FAME-GC-MS) as described previously7.
In vitro and in vivo experiment
A human AT sample was fixed via 4%-formaldehyde after collection during abdominoplasty and scanned in the in vitro experiment. For validation, 10 mg of the sample were analyzed using the same FAME-GC-MS method as for the phantom experiment. For the in vivo experiment, the thigh region of a healthy volunteer was scanned. All participants gave prior written informed consent. The study protocol was approved by the local ethics committee.
Imaging protocol
A 2D time-interleaved multi-echo gradient-echo (TIMGRE) sequence8 was used with the following parameters (in vivo): 192 bipolar echoes (4 interleaves, 48 echoes each), TE1: 1.42ms, dTE: 0.2ms, TR: 45ms, flip angle: 30degrees, field-of-view: 400x200mm, voxel-size: 2x2x3mm3, 16 averages (even averages with flipped read-out), readout bandwidth: 1689Hz, scan time: 05:03min. Similar parameters were also used in the phantom and in vitro. All measurements were performed acclimatized at room temperature (21±1°C) on a 3T scanner (Ingenia Elition X, Philips Healthcare, The Netherlands) using the 16-channel head coil in the phantom and in vitro experiments and the 16-channel-anterior and the 12-channel-posterior-coil arrays for the in vivo scan.
Results
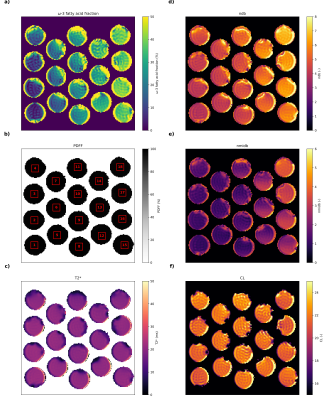
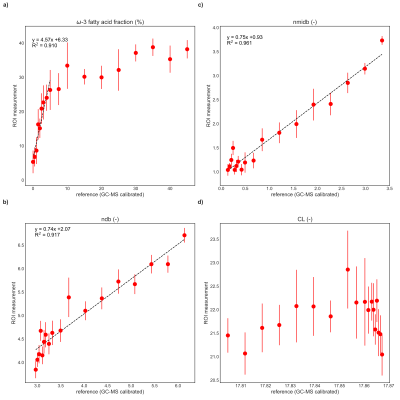
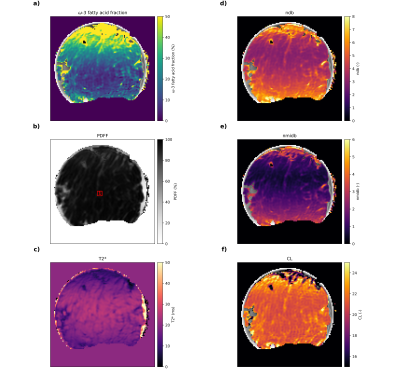
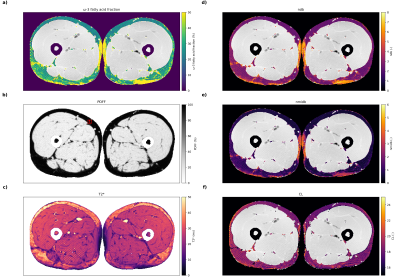
Obtained parameter maps from the phantoms, in vitro and in vivo measurements are given in Figs.2-5, respectively. The correlation analysis in the phantom ROIs vs. GC-MS calibrated reference values (Fig.3) revealed an R2 of 0.910, 0.917 and 0.961 for the ω-3 fatty acid fraction (only samples up to 5% reference value), ndb and nmidb, respectively. The obtained ω-3 fatty acid fractions showed a monotonic non-linear relationship with the GC-MS reference values. For in vitro and in vivo results see Figs.4-5.Discussion
For the first time, the feasibility of model-based ω-3 fatty acid fraction mapping was demonstrated in human AT using a gradient-echo-based imaging sequence on a clinical 3T system. It is anticipated, that a non-invasive ω-3 fatty acid fraction-based biomarker will be of high interest in the study of normal physiology, nutrition and pathologies including the metabolic syndrome and cardiometabolic complications.The current work goes beyond existing studies4,9–11 aiming at the extraction of the three triglyceride characteristics ndb, nmidb, CL and thereof derived fatty acid characteristics. Previous work only exists on the characterization of fatty acid subtypes using MR include the differentiation of diacylglycerols and triacylglycerols exploiting J-modulations12, and the characterization of the ω-3 fraction using MR spectroscopy13–16.
The accurate assessment of the ω-3 fatty acid fraction remains challenging and additional work on its requirements is needed, given the observed parameters drift together with a decreasing T2* e.g. in the medial thigh region. (Fig.5) Main limitations of the study include that i) the chemical shift displacement was not considered, ii) relaxation effects including differences in T1 and T2 were neglected, iii) a thorough model refinement and optimization of the acquisition scheme has yet to be performed
Conclusion
ω-3 fatty acid fraction mapping using a TIMGRE sequence was validated in phantoms and its feasibility was demonstrated in vitro and in vivo in human AT.Acknowledgements
The present work was funded by the Deutsche Forschungsgemeinschaft (DFG, German Research Foundation) – Project number 446320752. The authors also acknowledge research support from Philips Healthcare.References
1. Cameron AJ, Shaw JE, Zimmet PZ. The metabolic syndrome: prevalence in worldwide populations. Endocrinology and metabolism clinics of North America. 2004;33(2):351-75-table of contents. doi:10.1016/j.ecl.2004.03.005
2. Phinney SD, Stern JS, Burke KE, Tang AB, Miller G, Holman RT. Human subcutaneous adipose tissue shows site-specific differences in fatty acid composition. The American journal of clinical nutrition. 1994;60(5):725-729. doi:10.1093/ajcn/60.5.725
3. Simopoulos AP. Omega-3 fatty acids in inflammation and autoimmune diseases. Journal of the American College of Nutrition. 2013;21(6):495-505. doi:10.1080/07315724.2002.10719248
4. Berglund J, Ahlström H, Kullberg J. Model-based mapping of fat unsaturation and chain length by chemical shift imaging-phantom validation and in vivo feasibility. Magnetic Resonance in Medicine. 2012;68(6):1815-1827. doi:10.1002/mrm.24196 5. Diefenbach MN, Liu C, Karampinos DC. Generalized parameter estimation in multi-echo gradient-echo-based chemical species separation. Quantitative Imaging in Medicine and Surgery. 2020;10(3):554-567-567. doi:10.21037/qims.2020.02.07
6. Golub G, Pereyra V. Separable nonlinear least squares: the variable projection method and its applications. Inverse Problems. 2003;19(2):R1–R26. doi:10.1088/0266-5611/19/2/201
7. Ecker J, Scherer M, Schmitz G, Liebisch G. A rapid GC-MS method for quantification of positional and geometric isomers of fatty acid methyl esters. Journal of chromatography B, Analytical technologies in the biomedical and life sciences. 2012;897:98-104. doi:10.1016/j.jchromb.2012.04.015
8. Ruschke S, Eggers H, Kooijman-Kurfuerst H, et al. Correction of phase errors in quantitative water–fat imaging using a monopolar time-interleaved multi-echo gradient echo sequence. Magnetic Resonance in Medicine. 2017;78(3):984-996. doi:10.1002/mrm.26485
9. Leporq B, Lambert SA, Ronot M, Vilgrain V, Van Beers BE. Quantification of the triglyceride fatty acid composition with 3.0 T MRI. NMR in Biomedicine. 2014;27(10):1211-1221. doi:10.1002/nbm.3175
10. Schneider M, Janas G, Lugauer F, et al. Accurate fatty acid composition estimation of adipose tissue in the abdomen based on bipolar multi-echo MRI. Magnetic Resonance in Medicine. 2018;20:12. doi:10.1002/mrm.27557
11. Trinh L, Peterson P, Leander P, Brorson H, Månsson S. In vivo comparison of MRI-based and MRS-based quantification of adipose tissue fatty acid composition against gas chromatography. Magnetic Resonance in Medicine. 2020;84(5):2484-2494. doi:10.1002/mrm.28300
12. Uche IK, Galiana G. Distinguishing Lipid Subtypes by Amplifying Contrast from J-Coupling. Scientific Reports. 2019;9(1):3600. doi:10.1038/s41598-019-39780-4
13. Lundbom J, Heikkinen S, Fielding B, Hakkarainen A, Taskinen MR, Lundbom N. PRESS echo time behavior of triglyceride resonances at 1.5 T: Detecting ω-3 fatty acids in adipose tissue in vivo. Journal of Magnetic Resonance. 2009;201(1):39-47. doi:10.1016/j.jmr.2009.07.026
14. Skoch A, Tošner Z, Hájek M. The in vivo J-difference editing MEGA-PRESS technique for the detection of n-3 fatty acids. NMR in Biomedicine. 2014;27(11):1293-1299. doi:10.1002/nbm.3189
15. Fallone CJ, McKay RT, Yahya A. Long TE STEAM and PRESS for estimating fat olefinic/methyl ratios and relative ω-3 fat content at 3T. Journal of Magnetic Resonance Imaging. 2018;48(1):169-177. doi:10.1002/jmri.25920
16. Gajdošík M, Hingerl L, Skoch A, et al. Ultralong TE in vivo 1H MR spectroscopy of omega-3 fatty acids in subcutaneous adipose tissue at 7 t. Journal of Magnetic Resonance Imaging. 2018;6(480):7934. doi:10.1002/jmri.26605
Figures
