1270
Metabolite-specific echo planar imaging of hyperpolarized 13C-pyruvate at 4.7T1Mallinckrodt Institute of Radiology, Washington University in St. Louis, St. Louis, MO, United States, 2GE Healthcare, Dallas, TX, United States
Synopsis
Hyperpolarization greatly increases the sensitivity of MRI studies of 13C-labeled substances. To expand our ability to investigate in vivo metabolism with hyperpolarized MRI, we developed a metabolite-specific 2D EPI pulse sequence with custom flyback spatially-selective RF pulses for [1-13C]pyruvate and [1-13C]lactate at 4.7T. Spectral profiles for each metabolite obtained using a [13C]urea phantom showed good correspondence with simulated profiles. In vivo testing was performed by imaging the liver and kidney of a rat following the injection of hyperpolarized [1-13C]pyruvate. Both the temporal and spatial resolution of [1-13C]pyruvate and [1-13C]lactate images was higher with our metabolite-specific EPI sequence than with CSI.
Introduction
Hyperpolarization by the process of dissolution dynamic nuclear polarization (DNP) provides >50,000-fold sensitivity enhancements for 13C-labeled substrates, enabling real-time metabolic investigations. Metabolite-specific echo planar imaging (EPI) with spectral-spatial radiofrequency (SSRF) excitation has become a standard method for imaging hyperpolarized (HP) substrates and their downstream metabolic products1–3.Methods
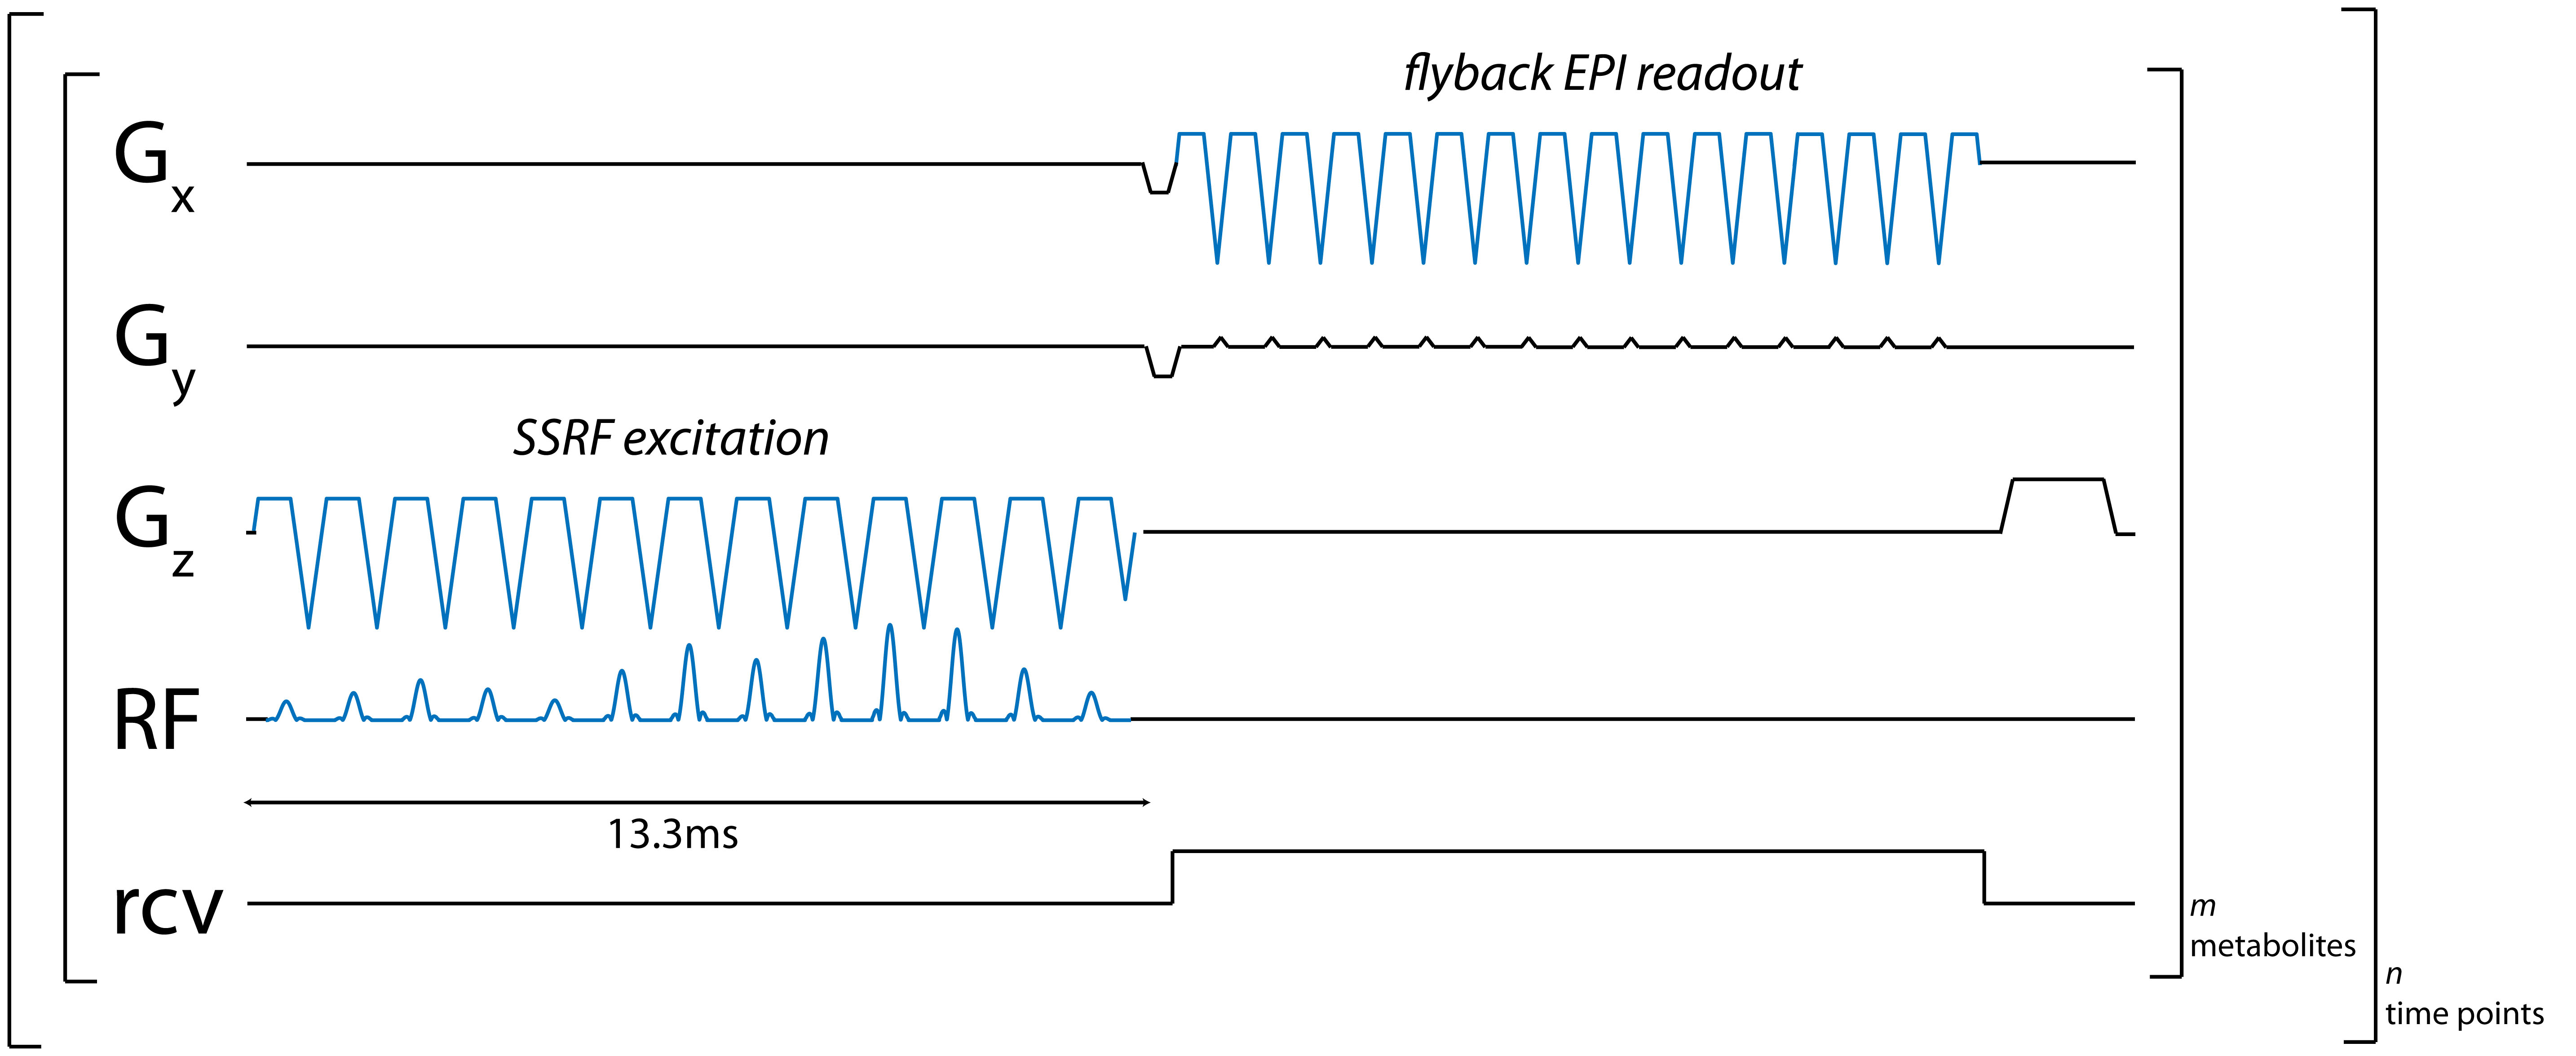
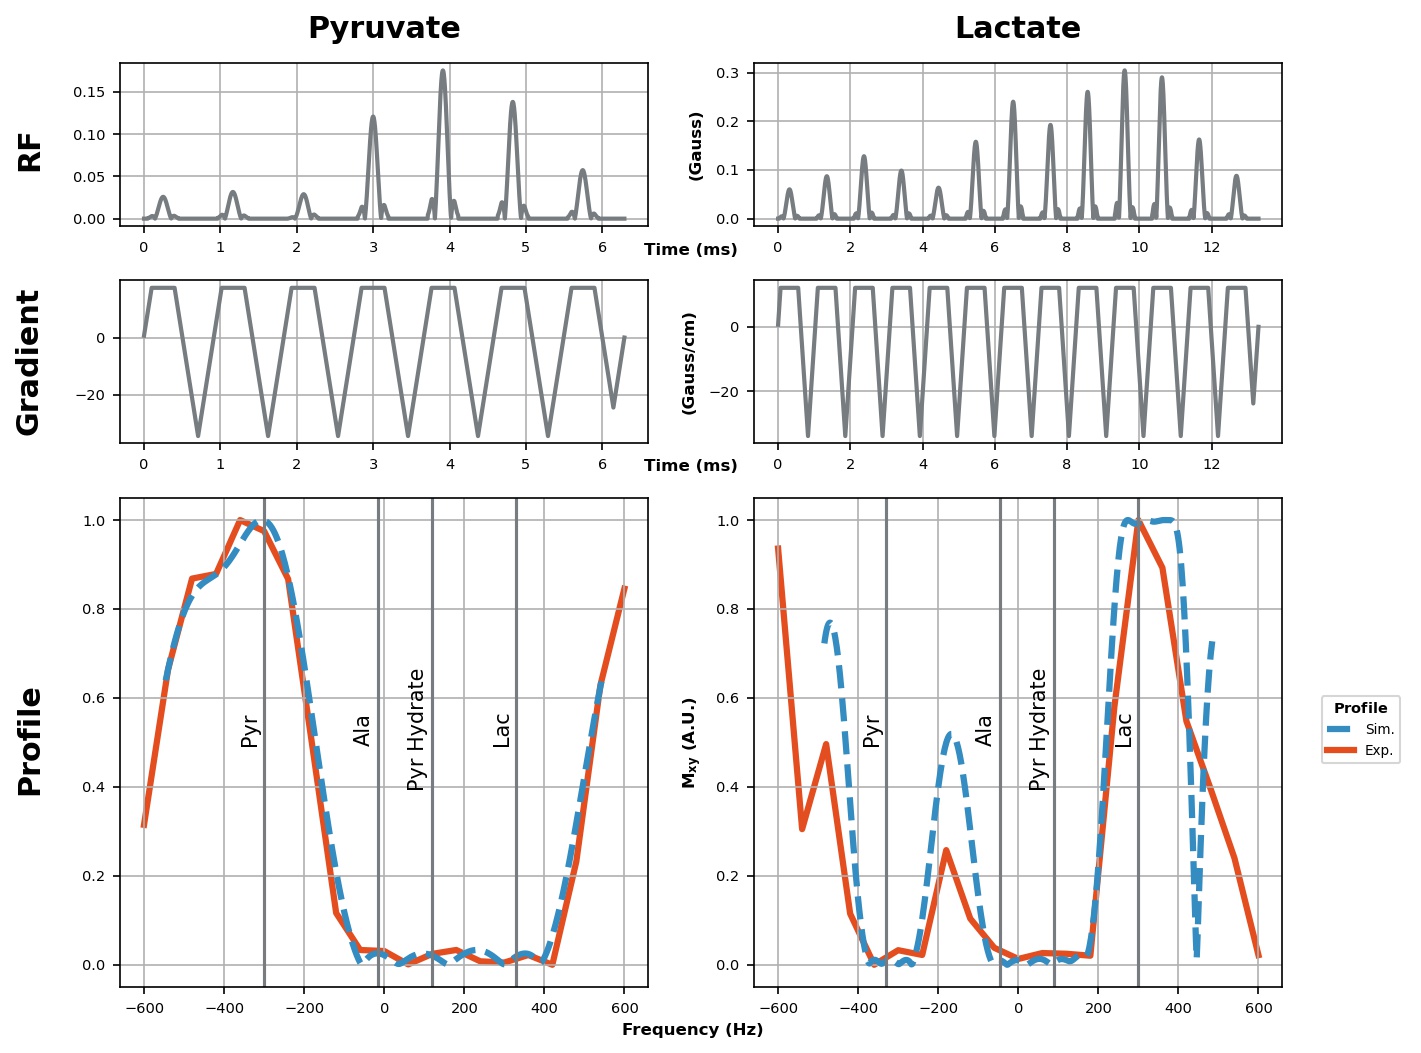
Sequence developmentWe developed a pulse sequence for metabolite-specific 2D flyback EPI of [1-13C]pyruvate and its downstream metabolic product [1-13C]lactate at 4.7T (50.7MHz), as diagrammed in Figure 1. To accomplish this, we designed custom flyback SSRF pulses that specifically excite [1-13C]lactate or [1-13C]pyruvate signals at a given spatial location, while maximally avoiding all other related species, including the corresponding redox partners as well as [1-13C]pyruvate-hydrate and [1-13C]alanine. SSRF pulse widths were 13.3ms for lactate-only excitation (B1max= 0.3G) and 6.3ms for pyruvate (B1max= 0.2G) giving uniform excitation over 0.5ppm, with time-bandwidth product= 3.5, max ripple= 1%. SSRF pulse profiles were simulated and verified experimentally by varying the center frequency while imaging a [13C]urea vial phantom, which was also used for power calibration. Pulses were designed using the “Spectral-Spatial RF Pulse Design for MRI and MRSI” MATLAB package (https://github.com/LarsonLab/Spectral-Spatial-RF-Pulse-Design)4, and integrated into a previously described EPI pulse sequence used at 14T5.
In vivo testing
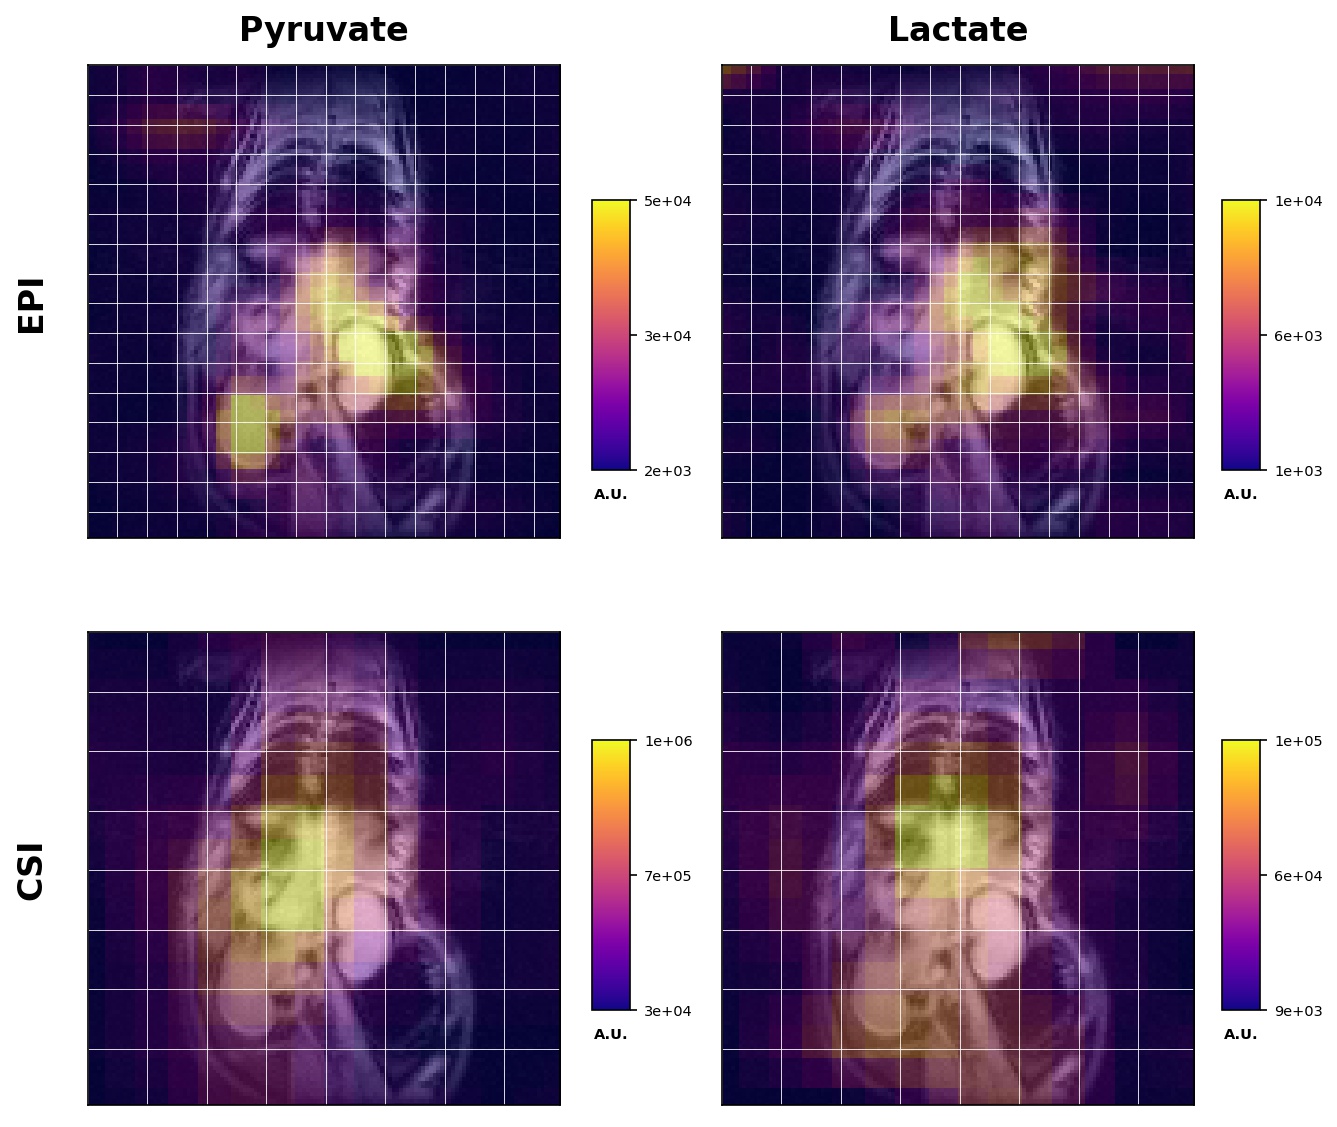
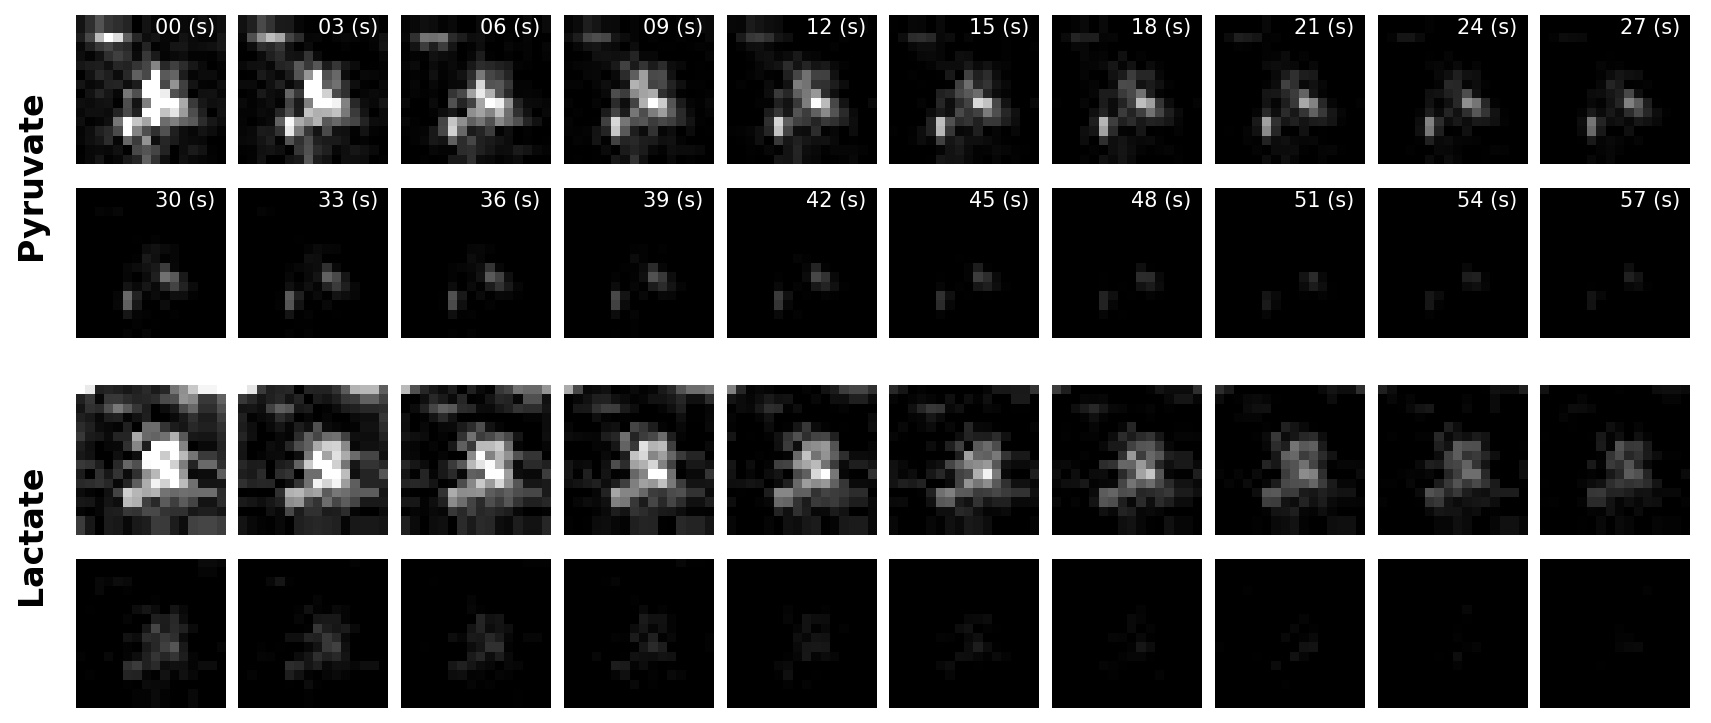
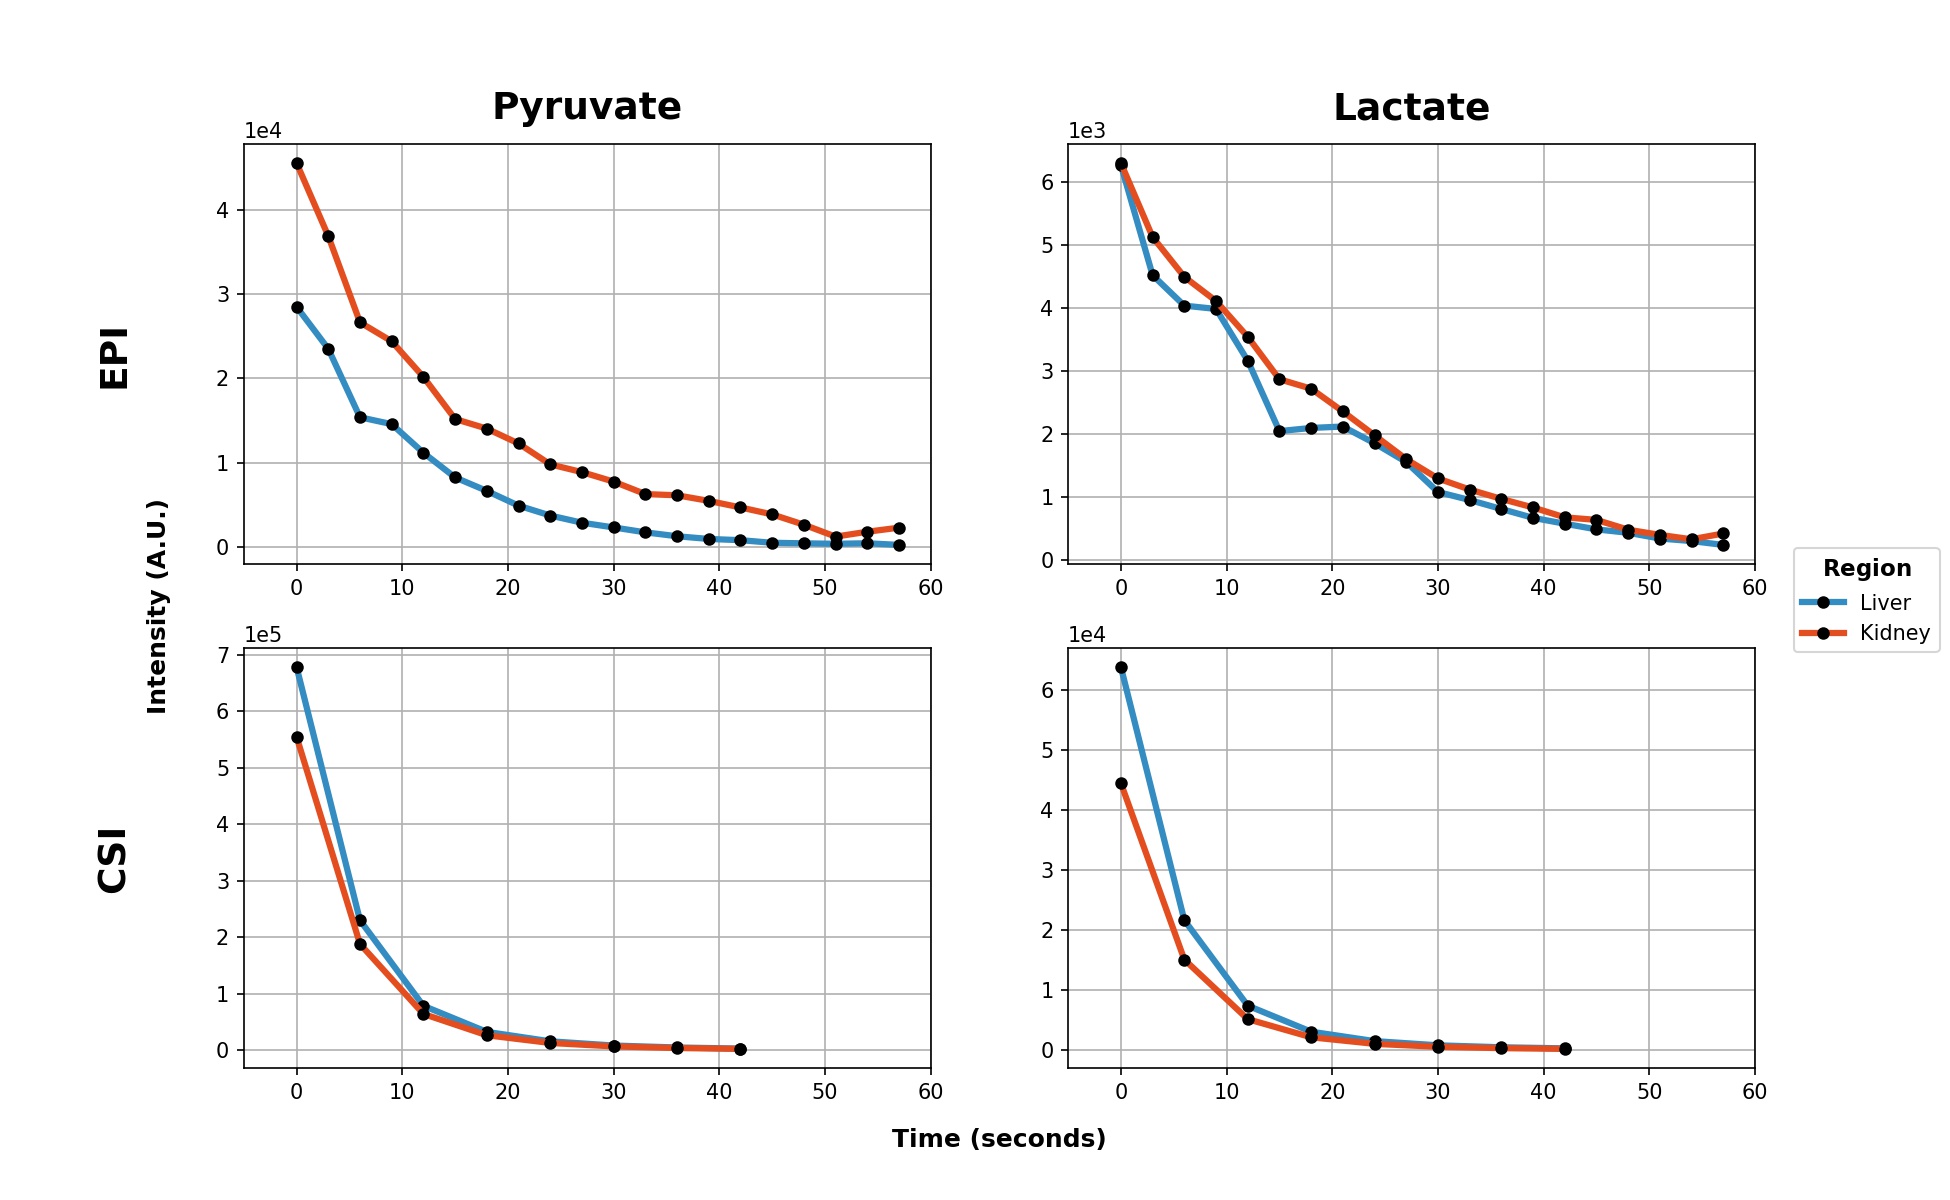
80mM HP [1-13C]pyruvate was generated in a GE 5T SPINlab hyperpolarizer, and quickly transferred to a 4.7T MRI scanner (Agilent, Santa Clara, CA) equipped with a 72-mm i.d. dual-tuned 13C/1H volume coil (ExtendMR, Milpitas, CA). Following pyruvate injection into a normal rat via tail vein (2.5mL), rapid images of pyruvate and lactate were acquired every 3s for 60s. Images were acquired coronally through the rat body, with 16x16 matrix (96 x 96mm FOV) for 6-mm in-plane resolution and 20-mm slice thickness. To preserve HP magnetization for metabolic conversion over time, a lower flip angle was applied on the injected [1-13C]pyruvate substrate (20°) compared with the downstream [1-13C]lactate product (90°). For comparison, we also executed a separate HP pyruvate injection within the same scanning session with coronal dynamic 2D CSI imaging of the same FOV (8 x 8, 12mm x 12mm).
Results and Discussion
Custom SSRF excitation pulse waveforms and corresponding spectral profiles (simulated and measured,) given in Figure 2, show close correspondence as expected. Coronal 2D images of HP pyruvate and lactate are given in Figure 3. Dynamic images and signal curves for HP pyruvate and lactate in liver and kidney are shown in Figures 4 and 5 respectively. The use of lower flip angles on the pyruvate vs the downstream metabolic product lactate extends the imaging window compared with the conventional broadband CSI acquisition.Since SSRF pulse passbands were not centered on the resonances of interest, in-plane reconstruction shifts were applied. While CSI acquisition cannot compete with EPI in terms of temporal resolution, it is useful for defining the exact resonances frequencies of the metabolites. This is important because the sensitivity to B0 off-resonance is a significant vulnerability of the EPI approach, resulting in potentially incorrect flip angles and/or incorrect in-plane reconstruction offsets. Pulse center frequencies are typically referenced to an external 13C phantom such as [13C]urea, in a different region of the B0 field.
Conclusions
We have developed new SSRF pulse waveforms for metabolite-specific excitation of HP [1-13C]pyruvate and [1-13C]lactate at 4.7T.Acknowledgements
We acknowledge support for this work by Mallinckrodt Institute of Radiology (MIR). Experiments were conducted in the Small Animal Magnetic Resonance Facility at MIR.References
1. Meyer, C. H., Pauly, J. M., Macovskiand, A. & Nishimura, D. G. Simultaneous spatial and spectral selective excitation. Magn. Reson. Med. 15, 287–304 (1990).
2. Cunningham, C. H. et al. Pulse sequence for dynamic volumetric imaging of hyperpolarized metabolic products. J. Magn. Reson. 193, 139–146 (2008).
3. Miller, J. J. et al. Robust and high resolution hyperpolarized metabolic imaging of the rat heart at 7 t with 3d spectral-spatial EPI. Magn. Reson. Med. 75, 1515–1524 (2016).
4. Larson, P. E. Z. et al. Multiband excitation pulses for hyperpolarized 13C dynamic chemical-shift imaging. J. Magn. Reson. 194, 121–127 (2008).
5. Sukumar, S. et al. Single-Shot, 2D and 3D Dynamic Imaging of Hyperpolarized 13C Biomarkers In Vivo at 14.1 Tesla. Proc. 20th Annu. Meet. ISMRM 8615, 4292 (2012).
Figures