1268
Analysis of neurodegeneration using diffusion and functional MRI in FTLD model marmoset1Department of Redioligical Science, Human Health Science, Tokyo Metroplitan University, Tokyo, Japan, 2Jikei University Graduate School of Medicine, Tokyo, Japan, 3Central Institute for Experimental Animals, Kanagawa, Japan, 4Department of Neurology, Nagoya University Graduate School of Medicine, Nagoya, Japan, 5RIKEN Center of Brain Science, Saitama, Japan
Synopsis
Symptom of FTLD is known brain atrophy and neurodegeneration predominantly in frontal and temporal lobes.However, the regularity of neurodegeneration and image analysis methods have not been established.The purpose of this study was to conduct multiparametric MRI to analyze the neurodegeneration caused by FTLD using structural MRI and fMRI.We used marmosets, which have a relatively similar brain structure to humans, as the experimental subjects.Statistical imaging analysis using diffusion MRI showed gray matter degeneration was observed, mainly in the caudate nucleus.The fMRI showed decreased brain activity in the frontal lobe and basal ganglia.
Introduction
Frontotemporal lobar degeneration (FTLD) refers to the pathological concept of degenerative diseases that show brain atrophy and neurodegeneration predominantly in frontal and temporal lobes.Previous studies have described the mechanism of the genetic mutations.1 However, the regularity of neurodegeneration and image analysis methods have not been established. However, the regularity of neurodegeneration and image analysis methods have not been established. By using the marmoset FTLD model, which has a brain structure similar to that of humans and it enabled to compare the same individual using many image parameters. Diffusion Tensor Image (DTI) was also used in VBA analysis. DTI can quantify neural structures and to examine gray and white matter degeneration in brain diseases such as FTLD.2,3 NODDI analysis is a multi-component model that uses MR diffusion data to capture the morphology of dendrites and axons. Neurodevelopmental development analysis and neurodegeneration analysis methods for various disease models have been reported. 4,5 In addition, we considered that functional MRI (fMRI) analysis could link the tissue degeneration of the brain and the decline in brain activity due to FUS knockout.The purpose of this study was to analyze brain images using various structural MRI and fMRI to identify the locations of neurodegeneration caused by FTLD.Method
All data were acquired in common marmosets (2 year old males, n=8).The AAV9 virus encoding the most effective shRNA for FUS knockout (shFUS) was introduced against four animals.For comparison, saline were injected to remaining four animals . All individuals were imaged six months later under same conditions.We used 9.4T Biospec 94/30 MRI Scanner (Bruker, Biospec) with 86mm volume coil.T1WI, T2WI, and DWI and fMRI were acquired.Voxel-based morphometry (VBM) and voxel-based analysis (VBA) analysis were performed by paired-t-test.VBM and VBA have the advantage of not being biased towards any particular brain region or neural structure and the ability to evaluate voxel-by-voxel differences in volume and signal values between groups.6 These statistical analyses using Statistical Parametric Mapping (SPM) have been applied to study brain degeneration in other degenerative brain diseases, such as amyotrophic lateral sclerosis and parkinson's disease.7,8 The group injected with saline was compared with the group injected with FUS.The groups before and after FUS injection were also compared.For the VBM analysis, statistical analysis was performed using T2WI images.In VBA, the T1WI was divided by the T2WI (T1w/T2w) to clarify the contrast of myelin.9 The DTI metrics used were axial diffusivity (AD), radial diffusivity , and fractional anisotropy (FA). Also, NODDI images were calculated using NODDI (Matlab Toolbox: version 1.0.1.3)10 from DWI images.In NODDI analysis, we used the orientation dispersion index (ODI) and the intracellular volume fraction (ICVF).In fMRI, we analyzed brain activity in saline injection group and FUS injection group.The registration processing and smoothing processing of standard brain images and functional images were performed using SPM. Noise was removed using CONN (The Gabrieli Lab), and Blood Oxygenation Level Dependent signal was calculated.Results and discussion
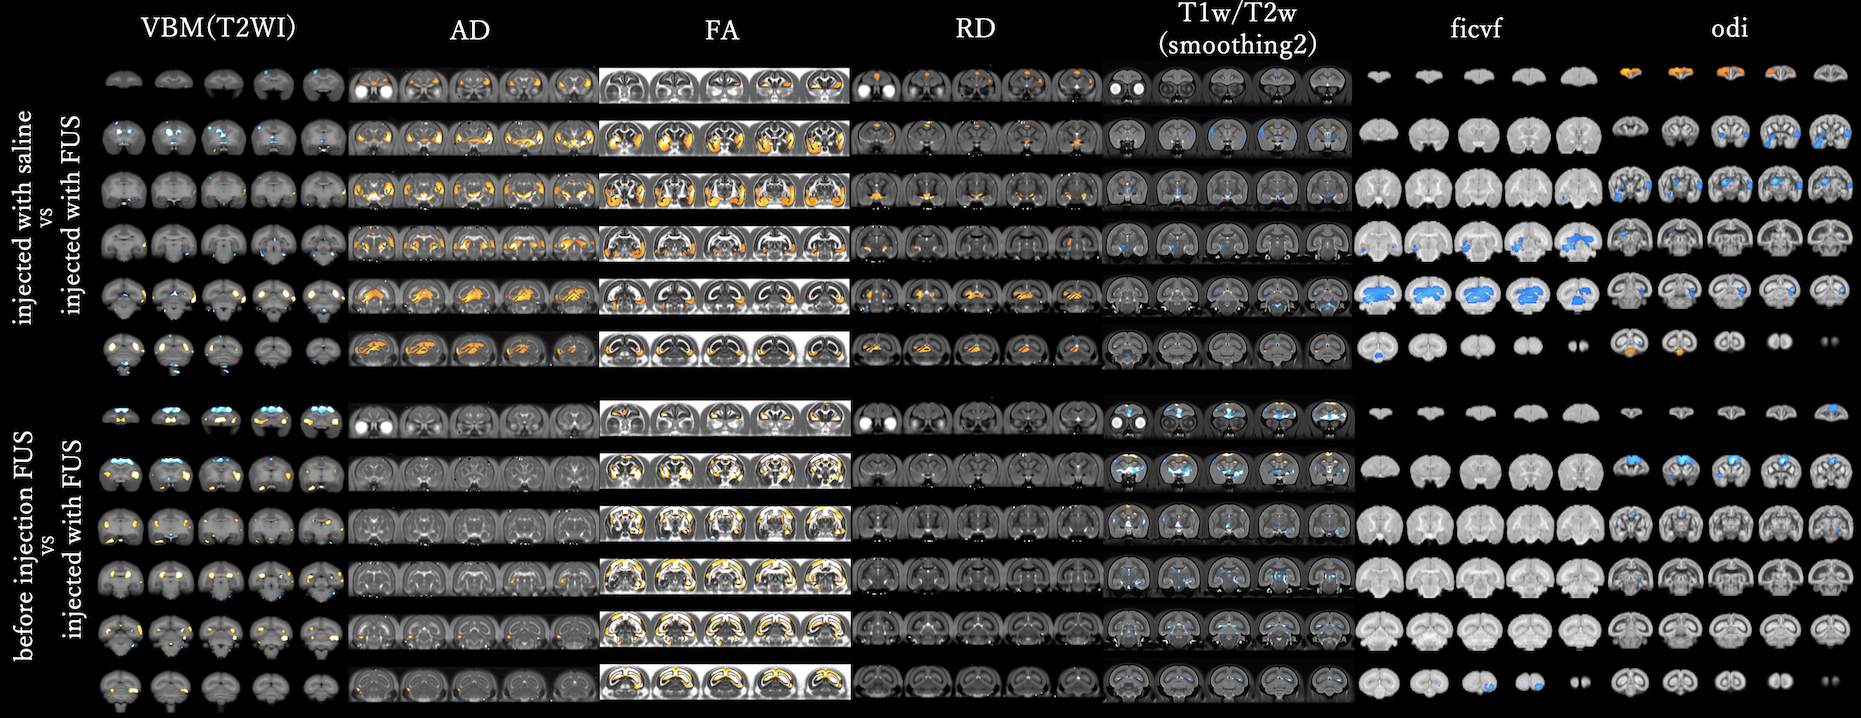
[VBM(GM)]Compared between group injected group injected with FUS with saline, the volume of caudate nucleus was reduced in group with FUS. Fig.1 shows the statistical analysis result of the gray matter (GM). (Fig1)In contrast, comparing the groups before and after FUS injection, no difference in caudate volume appeared.It might be because the degeneration of the caudate nucleus was not seen due to the relatively high degeneration of the injection site.2
[VBA(GM)]
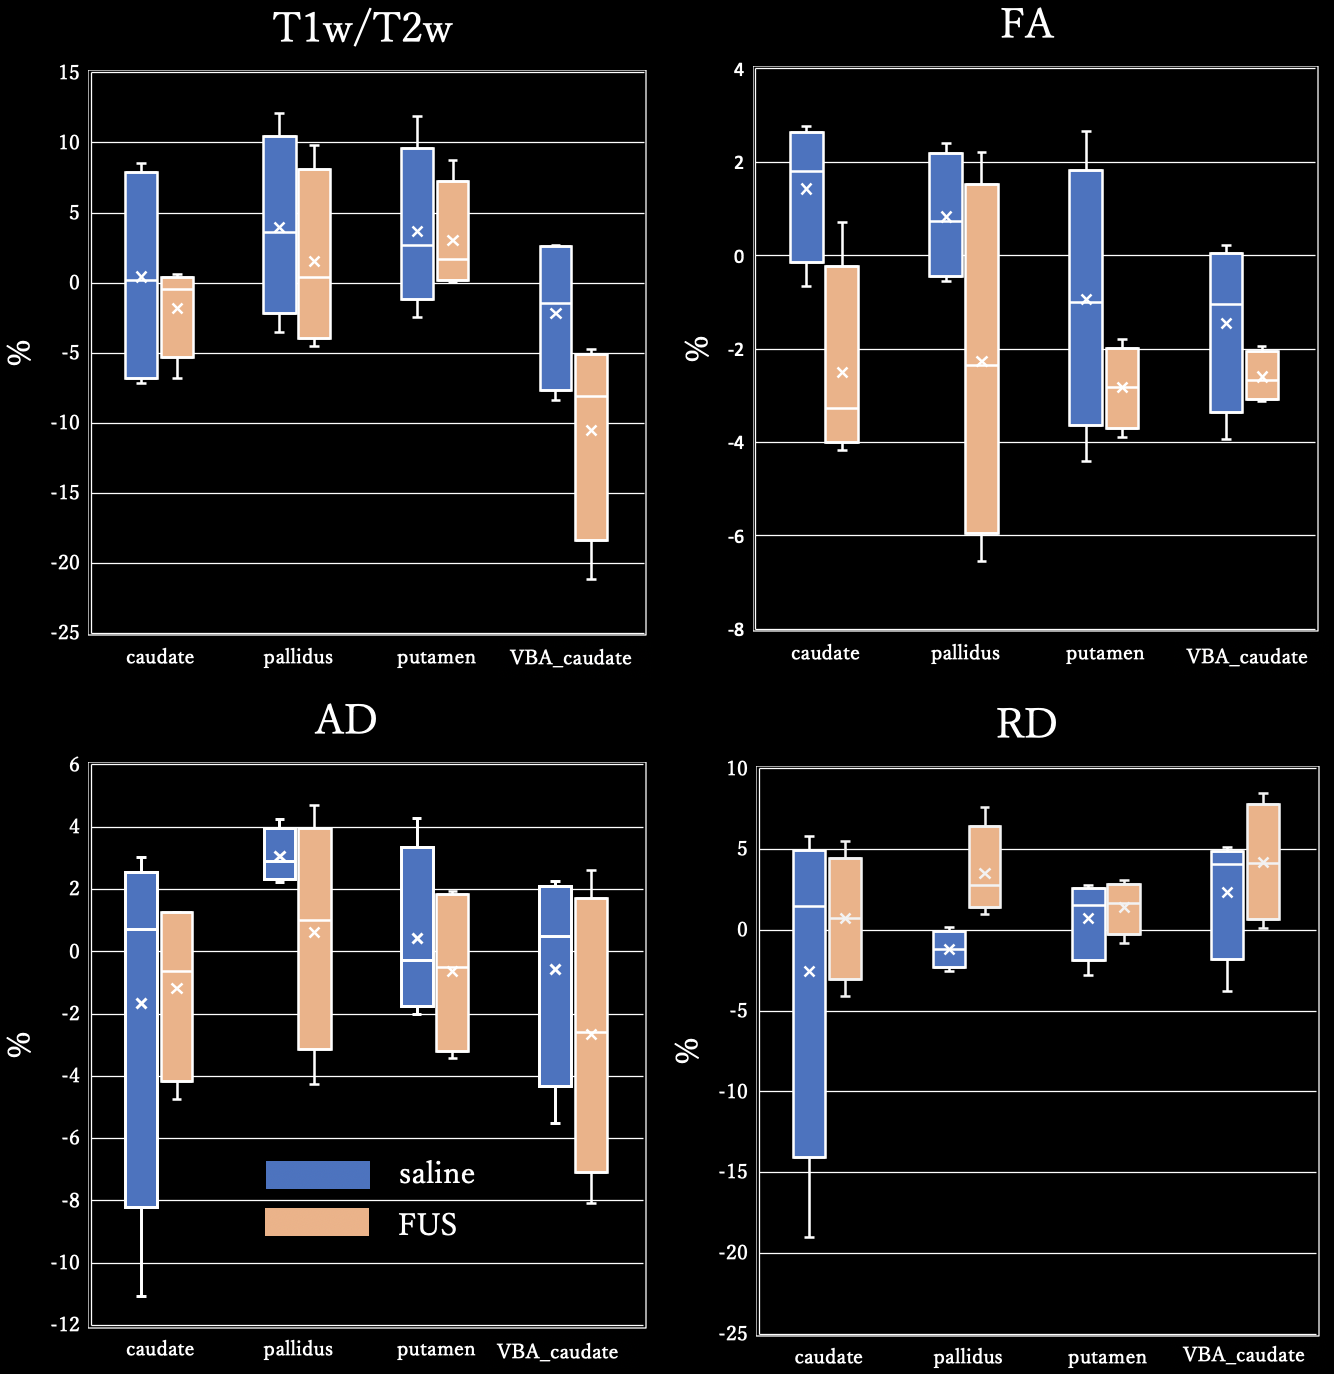
T1w/T2w signal of caudate nucleus was a significantly higher in group with FUS.And DTI metrics, the caudate nucleus, globus pallidus and putamen before and after injection of saline/FUS are shown. (fig 2)In the FA of DTI, the caudate nucleus was significantly lower.Regarding NODDI, in comparison of group injected with saline and group injected with FUS, there was significantly higher region in the frontal lobe in ODI.The previous study reports significant increase in ODI represent microglial growth.11This suggests FUS knockout might affect the neuronal composition of cortical regions.However, comparing the groups before and after FUS injection, no significant differences were detected in the frontal lobe in ODI.As mentioned above, by AAV injection, it is estimated that no significant difference was out.2
[WM]
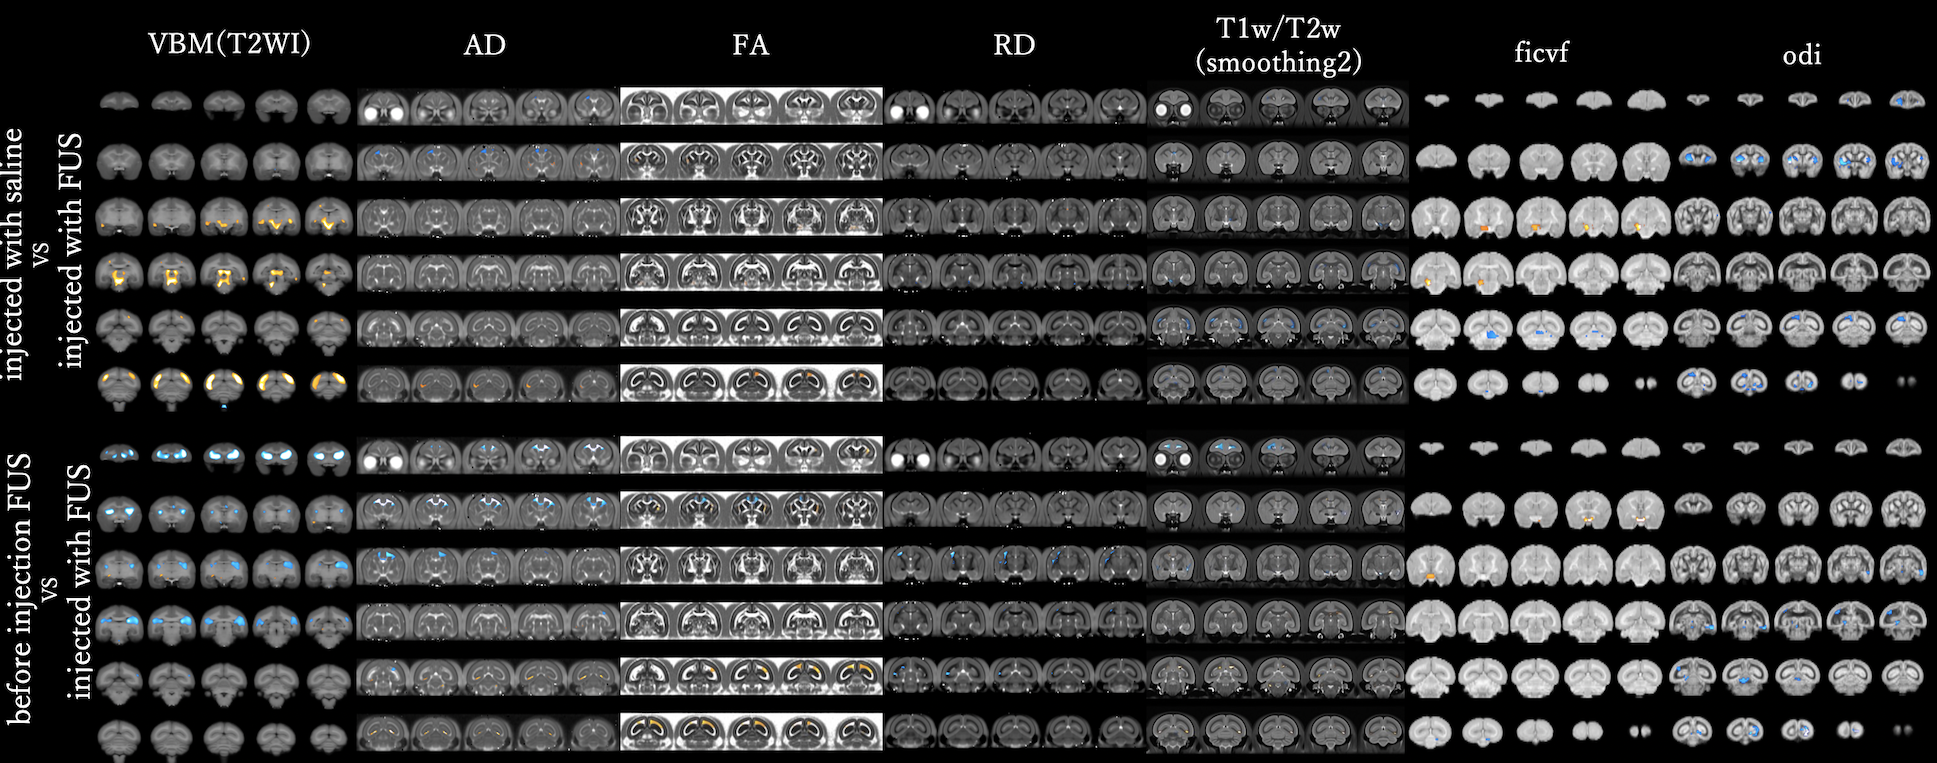
Comparing the groups before and after FUS injection, in VBM, there were significant differences around prefrontal cortex and caudate nucleus as shown in Fig3.The VBA did not observe significant differences in any of the parameters.But the relevance of white matter in FTLD has been reported to be extensive3, it suggests that white matter degeneration may play a role as a biomarker of FTLD disease in the future.
[fMRI]
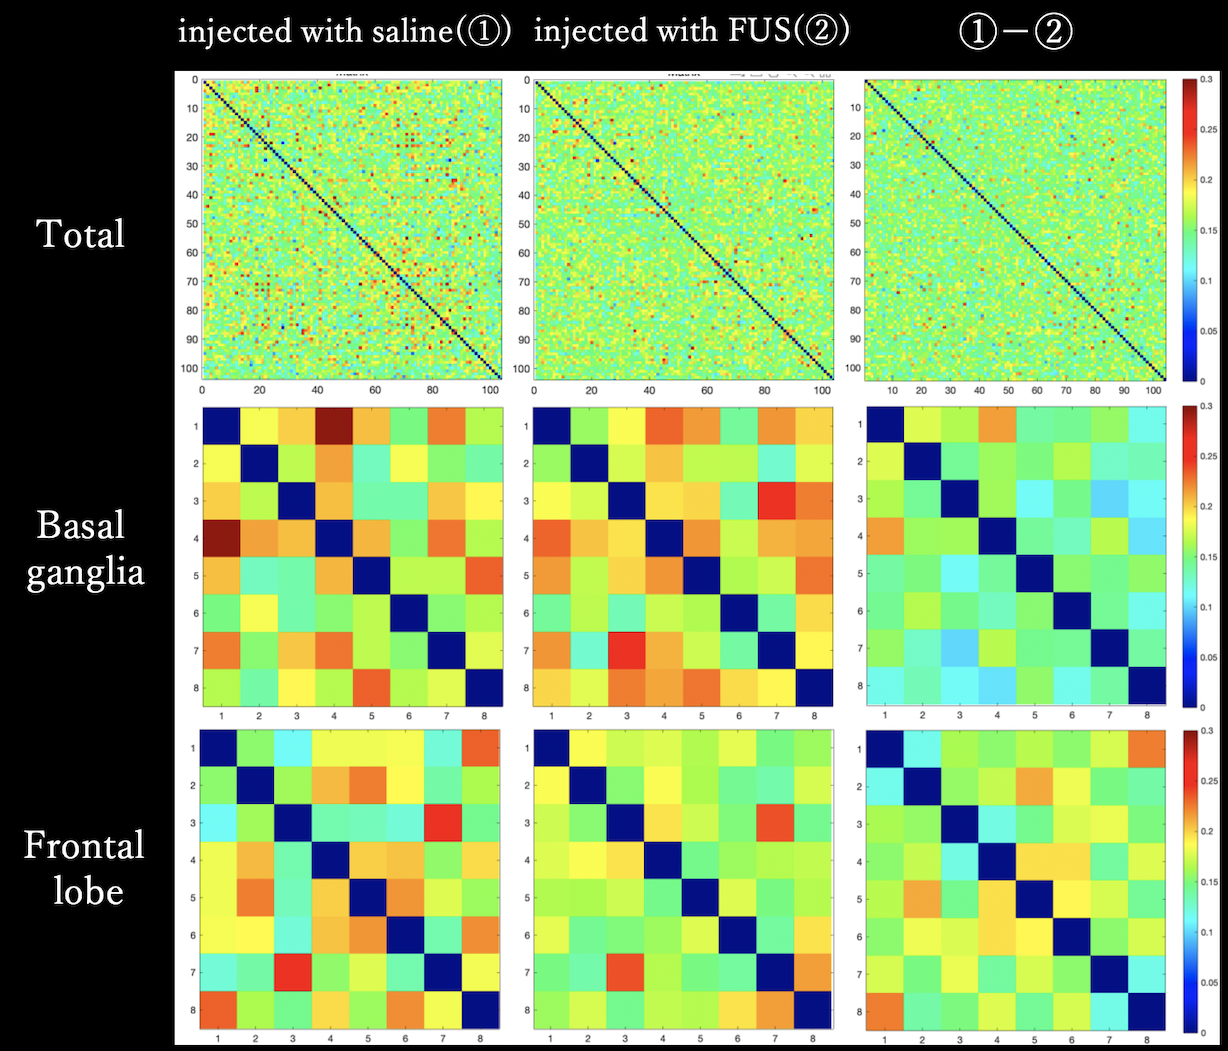
In this study, brain activity was also examined.Both negative/positive activity correlation decreased mainly in the frontal lobe as shown in Fig4. Previous studies have reported frontal lobe atrophy and functional decline12, demonstrating the validity of this study.
Conclusion
In this study, we were able to assess the brain degeneration using various structural MRI image. In addition, we found brain activity tendencies specific to FTLD.The changes in brain structure and function caused by FUS knockdown were assessed without tissue destruction.Acknowledgements
This research is partially supported by the program for Brain Mapping by Integrated Neurotechnologies for Disease Studies (Brain/MINDS) from Japan Agency for Medical Research and development, AMED .Conflict of Interest (COI) of the Principal Presenter:No potential COI to disclose.References
[1]S.Ishigaki, et al. Scientific Reports, Article number : 00529, 2012
[2] R. J. Anderson, et al, Neuroinformatics, vol.17(3), pp.451-472, 2019
[3]Laura E.Downey, NeuroImage: Clinical, vol.8, pp.640-651, 2015
[4]Samantha B, et al. NeuroImage, vol.15, pp.333-342, 2017
[5]Thibo B et al. NeuroImage, vol.4, pp649-658, 2014
[6] J. Ashburner, et al. NeuroImage, vol.11, pp.805-821,2000
[7]C.M.Stonnington, et al. NeuroImage, vol.51, pp.1405-1413, 2010
[8] Ching-Hung Lin, et al. Frontiers in Human Neuroscience, vol.7 Article number : 247, 2013
[9] Matthew F Glasser, Journal of Neuroscience, vol.31(32) pp.11597-11616, 2011
[10] Zhang H. et al. Neuroimage, vol. 61, pp.1000–1016, 2012[11] Sue Y. Yi, et al. Front Neurosci, vol.13, Article number : 00081, 2019[12]David C.P, et al. Brain, vol.140(12), pp.3329-3345, 2017
[11] Sue Y. Yi, et al. Front Neurosci, vol.13, Article number : 00081, 2019
[12]David C.P, et al. Brain, vol.140(12), pp.3329-3345, 2017
Figures