1265
Effects of T2* on accuracy of single reference variable flip angle T1 – mapping for MR thermometry1Biomedical Engineering, University of Utah, Salt Lake City, UT, United States, 2Radiology and Imaging Sciences, University of Utah, Salt Lake City, UT, United States
Synopsis
Neglecting the effects of T2* changes in the single reference variable flip angle (SR-VFA) method for T1-mapping produces a substantial systematic bias on T1 that increases with TE, T1 changes, and T2* changes. These effects were simulated using 1000 noisy signals of a single voxel using the SPGR equation. It was found that the bias can be corrected by measuring T2* changes dynamically, at the expense of noise, which noise could be mitigated through weighted T1-map combinations across echo times. Multi-echo T1-mapping with the SR-VFA method could be combined with PRFS thermometry to allow fast, accurate T1-mapping of heterogeneous tissue.
Introduction
MR-guided focused ultrasound (tcMRgFUS) procedures for breast cancer need faster methods of accurately measuring temperature simultaneously in adipose tissue and glandular tissue. Since the proton resonance frequency shift (PRFS) method is not effective at measuring temperature change in fat1,2, the T1-to-temperature relationship has been investigated for this need due to its versatility across all tissue types. In 2019, a single reference (SR) method was published for the dual-angle variable flip angle (VFA) method of T1-mapping, which method cut the necessary number of required dynamic acquisitions in half3. However, this SR-VFA method neglected changes in T2* with temperature3. This study eliminates that assumption and provides an understanding, through simulation, of the calculation bias produced by T2* changes with temperature. In addition, appropriate scanning parameters to minimize or eliminate this bias were determined to make the SR-VFA method a more viable choice towards fast T1 thermometry during MRgFUS procedures.Materials and Methods
Monte Carlo simulations were performed 1000 times on noisy signals of a single simulated voxel generated using the SPGR equation, $$$ (1-E_1) \sin (\alpha) / (1-E_1 \cos (\alpha)) , (E_1 = e^{(-TR/T_1)}) $$$ to compare the VFA method with the SR-VFA method and the T2*-corrected SR-VFA method in terms of accuracy and precision relative to the true T1 value. SNR was adjusted to be 100 relative to the signal at the Ernst angle for each TR/T1 baseline pair for all signals. Results were parameterized based on % change in T1 from the baseline T1, TE/T2*, TR/T1 baseline, and a temperature sensitivity ratio Z, defined as (T2* % change) / (T1 % change), both relative to their baseline values. Parameters were varied within the following ranges: T1 % change - [0 200%]; TE/T2* - [0 0.5]; TR/T1 - [0.01 0.3]; Z - [0 1]. Z was kept positive because in general T2 and T1 both increase with temperature1. The bias and standard deviation of the 1000 T1 estimates were calculated with each parameter set. The bias value was found by taking the difference between the true T1 value and the mean of the noisy estimates.For the flip angle sensitivity simulations, the reference and dynamic flip angles α and β were varied from 0 to 90°. The angles that produced the minimum variance for a simulated parameter set were compared with the theoretical minimum obtained through the theory of propagation of errors applied to the SR-VFA T1 calculation. The “optimal” angles were defined as those that produced the minimum average variance over the 0-200% change in T1 for each parameter set.
The T2* correction was simulated via additional noisy signals at TE2 > TE1 for each TE tested and fitting a mono-exponential curve to the two points for a T2* estimate.
Results
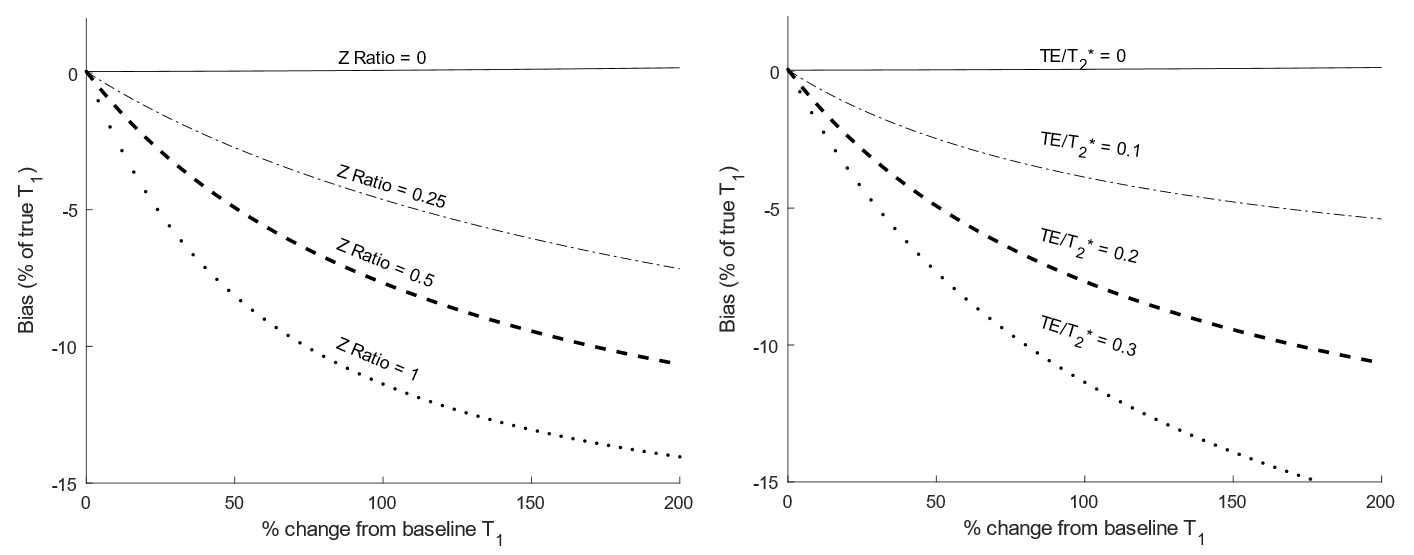
Figure 1 shows a representative example of the effects of changes in T2* on the SR-VFA calculation.When T2* effects are neglected, a negative bias is produced that increases in magnitude with larger changes in exp(-TE/T2*).
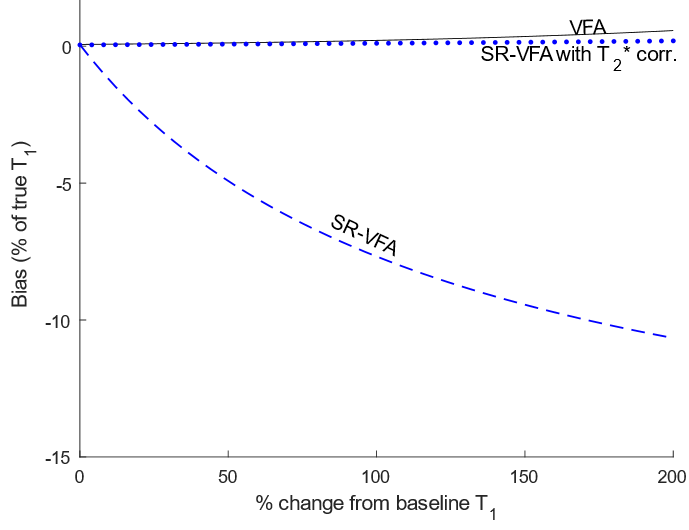
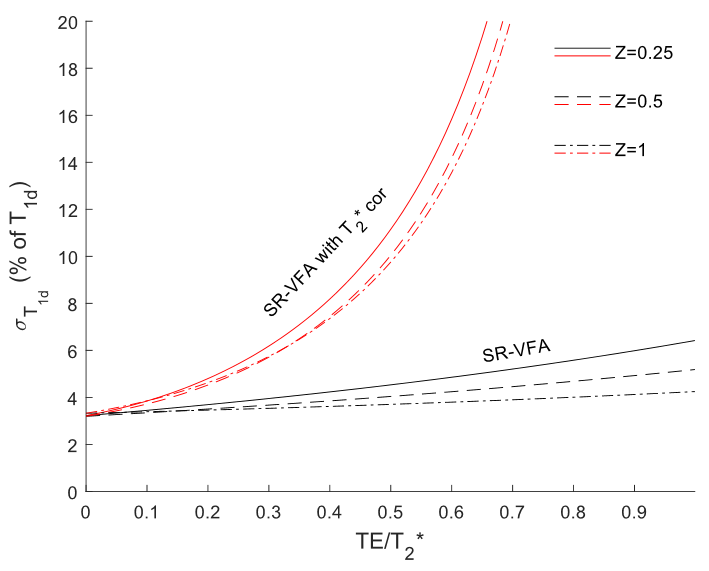
When noisy T2* estimates were applied to the SR-VFA method’s calculations on the bolded lines’ data from Figure 1, the absolute bias dropped to <0.2% of the baseline T1, shown in Figure 2. While this 2-point estimate eliminated the bias, Figure 3 shows that substantial noise was introduced due to the T2* measurements. Additionally, a weighted combination of T1 measurements at each echo to minimize noise is only partially effective due to the correlation between each echo’s corrected T1 after applying the same T2* correction to each echo prior to combination.
Further, it was found that the “optimal” reference flip angle produces ~77% of the signal at the Ernst angle of the baseline TR/T1, while the “optimal” dynamic angle produces 88-92% of the baseline TR/T1 Ernst angle signal.
Discussion and Conclusions
It is shown that the SR-VFA method produces substantial calculation bias when T2* effects are neglected, which could lead to substantial temperature errors in T1 thermometry. Minimizing TE/T2* for the SR-VFA method is crucial to its accuracy, with best results produced when TE/T2* < 0.2. However, this bias can be removed by applying a reasonable estimate of the relative changes in T2* with temperature. Since only accurate relative changes in T2* are required for the T2* correction to the SR-VFA method, a properly spaced two-point approximation of T2* is sufficient for a reasonable correction to the bias. To mitigate the problem of substantially increased noise, further work will determine the best strategies for estimating T2* while keeping noise uncorrelated, perhaps through changing which signals are used to produce each estimate of T2*, or by optimizing the number and spacing of echo times.While the SR-VFA method is most accurate when TE << T2*, PRFS thermometry performs best when TE~ T2* 2. However, the SR-VFA method with T2* correction can utilize both these needs by utilizing multi-echo acquisitions. If the first echo TE << T2* and the second TE is closer to T2*, simultaneous PRFS and the T2* - corrected SR-VFA method could both be performed with reasonable speed. In future work, these relationships will be verified in experiment, and echo times for optimizing scan time in tandem with T1 accuracy and PRFS viability will be determined.
Acknowledgements
NIH R01EB028316 and R01CA224141
Mark H. Huntsman Endowed Chair.
References
1Rieke, V., & Pauly, K. B. (2008). MR Thermometry. Journal of Magnetic Resonance Imaging: JMRI, 27(2), 376–390. https://doi.org/10.1002/jmri.21265
2Odéen, H., & Parker, D. L. (2019). Magnetic resonance thermometry and its biological applications – Physical principles and practical considerations. Progress in Nuclear Magnetic Resonance Spectroscopy, 110, 34–61. https://doi.org/10.1016/j.pnmrs.2019.01.003
3Svedin,
B. T., Payne, A., & Parker, D. L. (2019). Simultaneous proton resonance frequency
shift thermometry and T1 measurements using a single reference variable flip
angle T1 method. Magnetic Resonance in Medicine, 81(5),
3138–3152. https://doi.org/10.1002/mrm.27643
Figures