1264
Improved PRF-based MR Thermometry for Tissues with Aqueous and Adipose1Department of Physics, Soochow University, Taipei, Taiwan, 2Biomedical Instrument Institute, School of Biomedical Engineering, Shanghai Jiao Tong University, Shanghai, China
Synopsis
The proton resonance frequency (PRF) offset, which is linear to the temperature changes, has been developed and applied for thermal ablation therapies. However, the conventional PRF-based thermometry is limited in temperature measurements of fat due to the absence of hydrogen bonds. In this work, we proposed a revised and retrospective PRF method merged with the nonlinear circle fitting, to detect the accurate phase changes of water for achieving temperature measurements in aqueous and adipose tissues. The in vitro water-bathing heating for phantom and ex vivo focused ultrasound (FUS) heating for swine tissues were performed to verify the proposed method.
Introduction
The proton frequency of water protons provides a linear temperature-sensitivity coefficient of 1.28 Hz/℃ at 3 Tesla magnetic field1, which has been explored for monitoring the temperature changes through converting MR phase maps to temperature maps. However, the proton resonance frequency (PRF) shift-based method can not be used for temperature measurements of fat-containing tissues, due to the lack of hydrogen bonds1,2. Other temperature-associated imaging parameters, such as T1, T2 relaxation times, are the alternatives for getting temperature information3,4. But these parameters are only linear over a specific scope and are tissue dependent. In this work, an improved and evolved PRF method incorporated with the circle fitting5 was proposed here to measure the actual temperature changes of water for water and fat mixed tissues.Methods
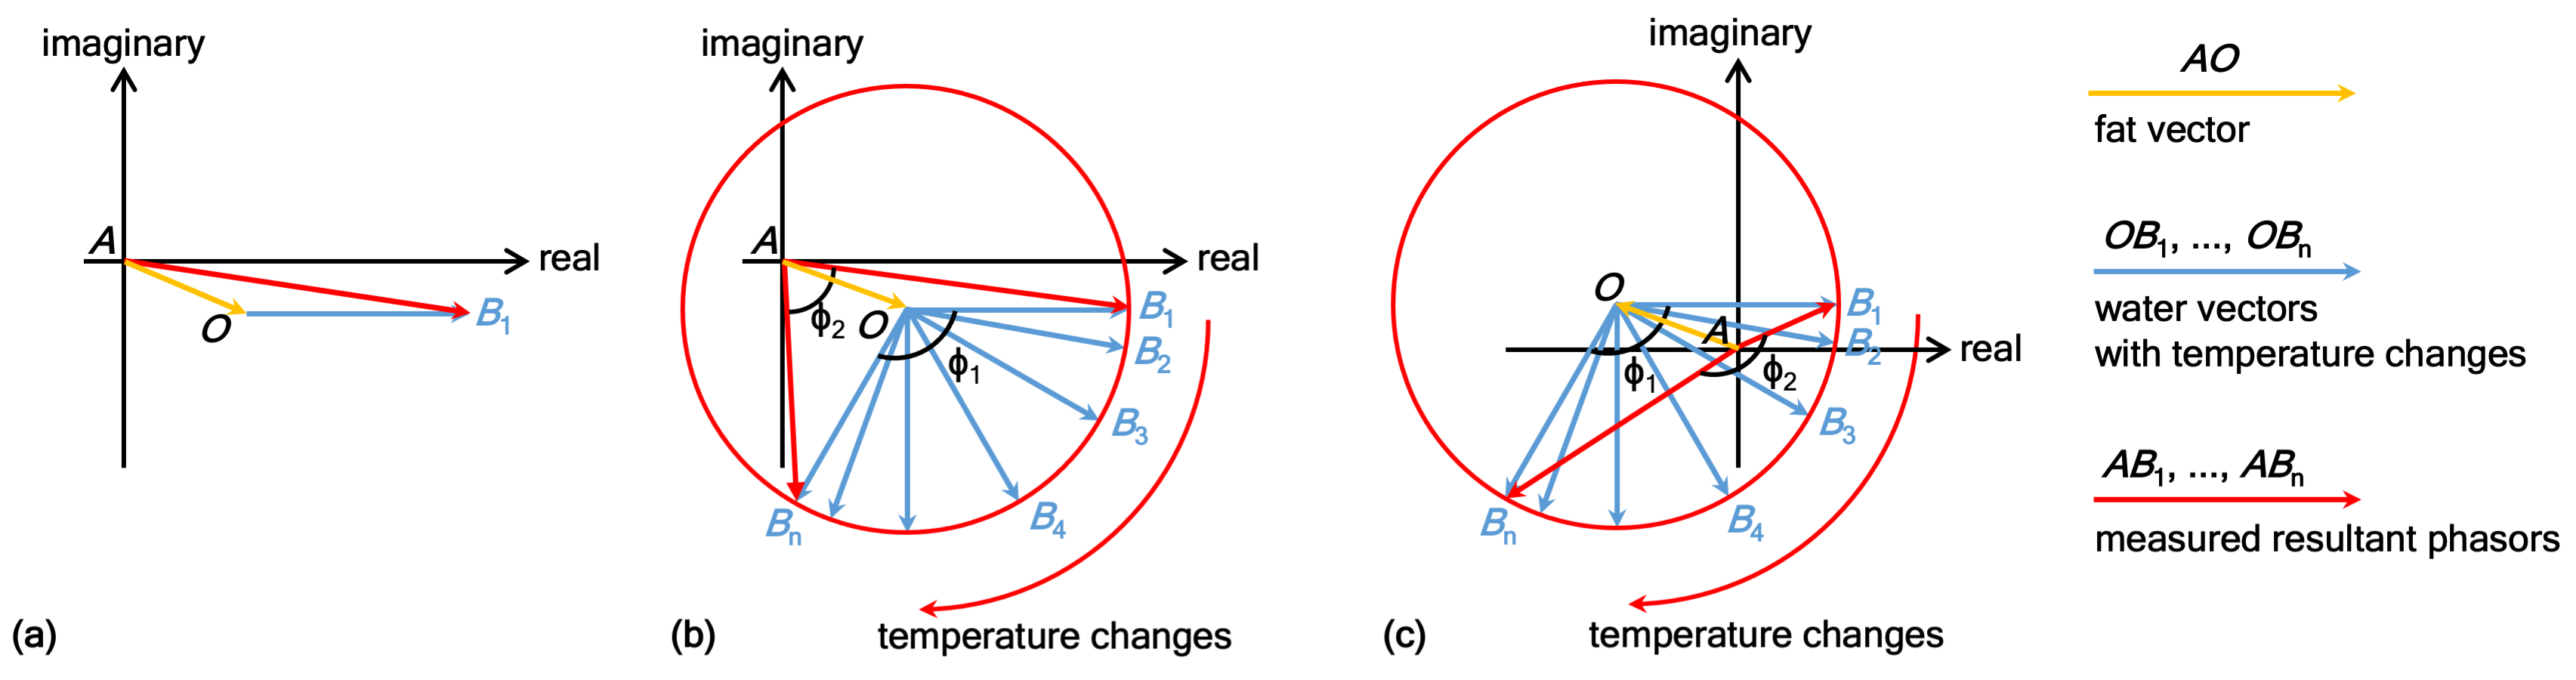
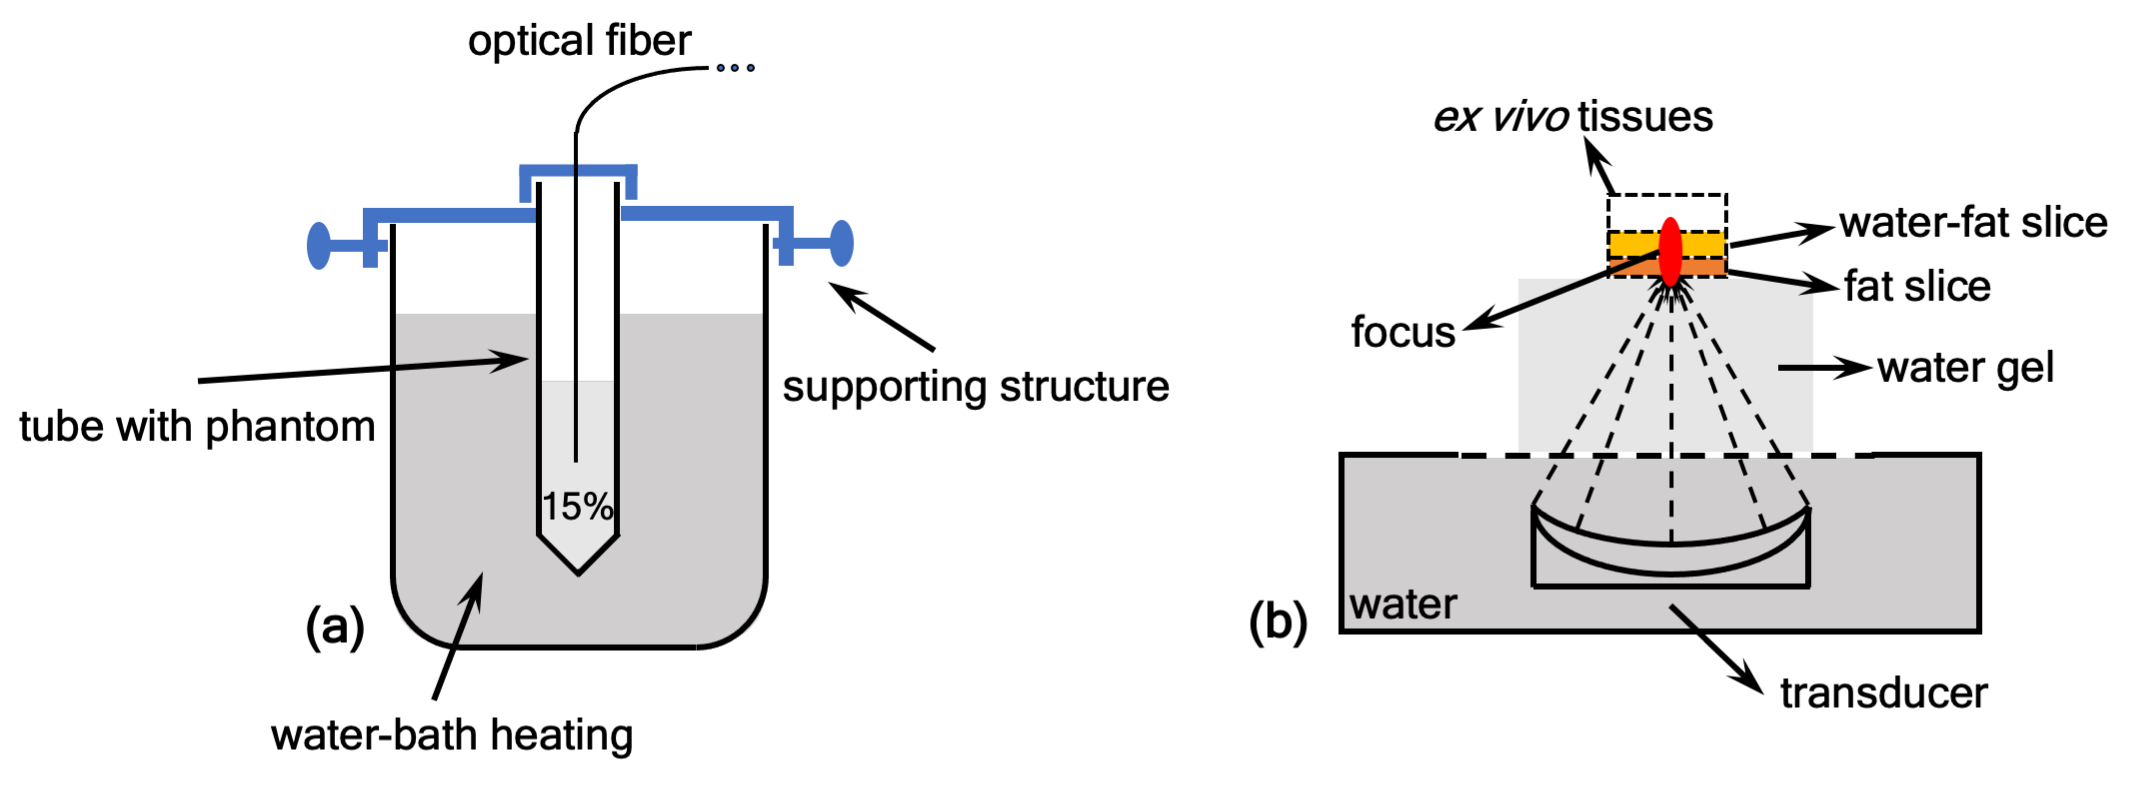
In MR data domain, the obtained voxel data usually possess two attributes, magnitude and phase, which are able to be expressed as read and imaginary parts in Cartesian coordinates6. As shown in Fig. 1a, the orange and blue phasor arrows (AO and OB1) in the complex domain could represent the fat and water protons for a given voxel in aqueous and adipose tissues, respectively. In reality, the add-up phasor (AB1) referred to the actually acquired MR data from imaging for that selected voxel. With temperature changes, the water phase OB1 would rotate around the point 'O' and generate B1 to Bn, as displayed in Fig. 1b and 1c. The fat can result in either overestimated or underestimated temperatures in the conventional PRF method. For example, the two opposite cases were displayed with φ2 < φ1 for underestimating in Fig. 1b and φ2 > φ1 for overestimating in Fig. 1c. As observed, those temperature-induced B1 to Bn distributed on a circumference of a circle centered at the point 'O'. The circle fitting algorithm was proposed to determine the circle center 'O', namely the constant fat phasor AO. Then, the accurate phase changes of water OB1 to OBn caused by temperature can be calculated by Eq. 1: OBn = ABn - AO, where n is an integer [1]. Finally, the temperature measurements in fat-containing tissues could be realized by the conversion of the obtained accurate water phase changes through PRF calculation.The heating experiments of in-vitro phantom and ex-vivo swine were performed to verify the proposed method. The diagrams of the experimental setups were depicted in Fig. 2. In Fig. 2a, the cuvette containing the gel phantom with 15% fat was placed in a larger beaker for conducting the water-bathing heating. An optical fiber (Ptsensor, Xi'an, China, ThermAgile-RF) was inserted to get the absolute temperature for the reference at the rate of 1 Hz. In Fig. 2b, the heating focus was generated by a custom-made 128-element focused ultrasound (FUS) transducer and properly located on the ex vivo tissues. The applied acoustic power was 70 W for 12s. Imaging for thermometry was implemented on a 3T MR equipment (GE Healthcare, Milwaukee, WI, Discovery MR750) using the spoiled gradient echo (SPGR) sequence with parameters: TR/TE = 15.3/11.8 ms, flip angle = 20°, slice thickness = 3 mm, matrix size = 128×128. The bandwidth was set to ±62.5 kHz to eliminate the artifacts resulted from chemical shift between water and fat. In addition, the ex vivo tissues were also imaged using the GE product IDEAL sequence with parameters: TR/TE = 2000/35.68 ms, flip angle = 111°, bandwidth = ±100 kHz, echo train = 16, slice thickness = 3 mm, matrix size = 128×128.
Results
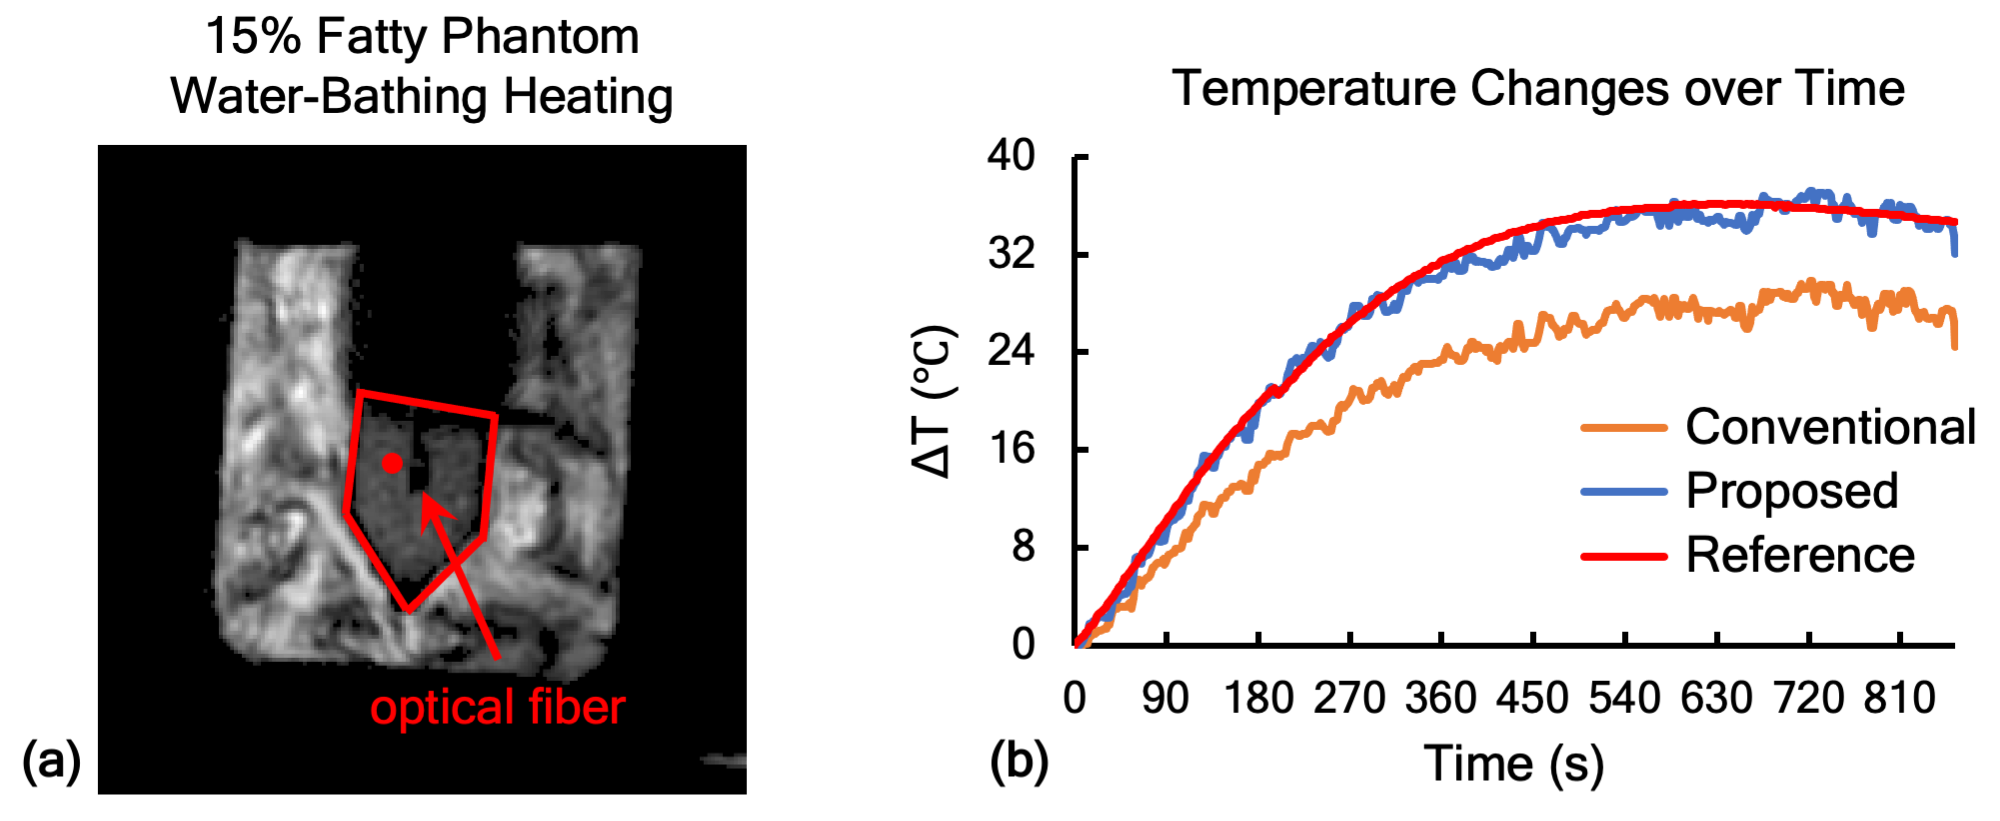
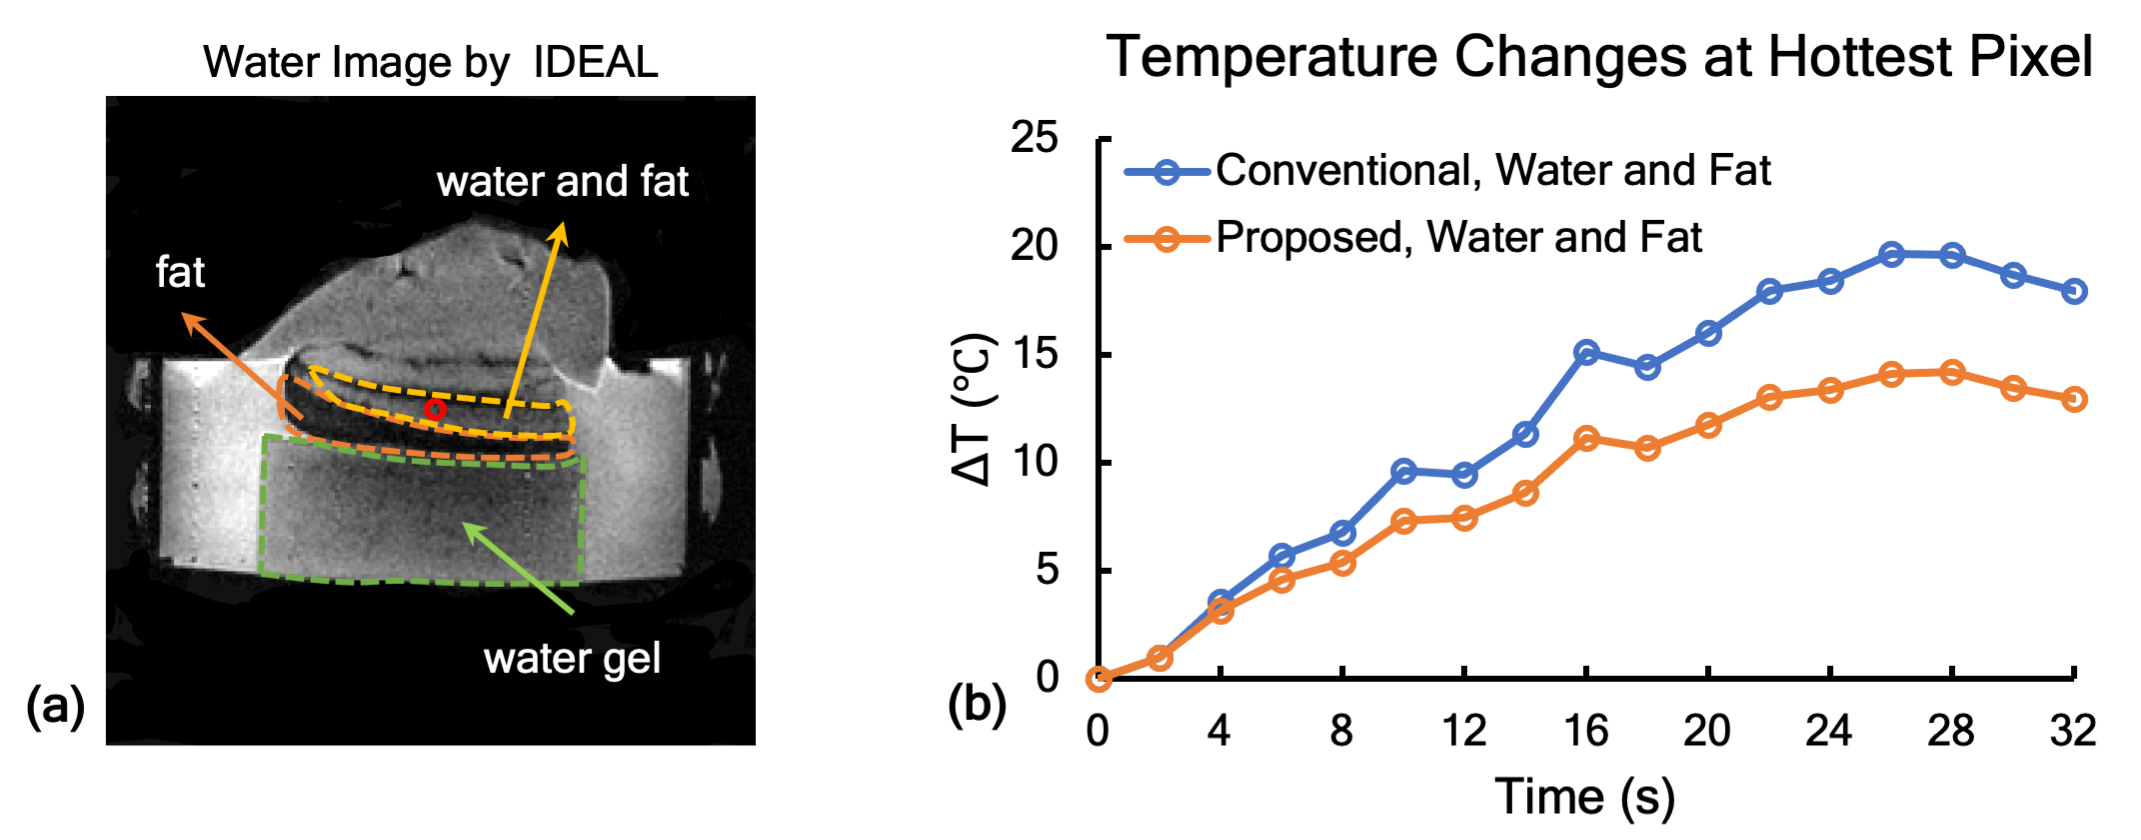
The magnitude map for in vitro phantom was obtained in Fig. 3a. The phantom region and the selected voxel were marked with the red pentagon and the filled circle. Its temperature evolution was plotted to compare with the reference acquired from the optical fiber. As shown in Fig. 3b, the orange, blue and red lines represent the temperature changes from the conventional method, the proposed method and the optical fiber. The 33% temperature error caused by fat were corrected by the proposed method. For ex vivo swine experiment, the three layers, water gel, fat and water plus fat were demonstrated in Fig. 4a. The temperature changes over time for the voxel marked with the hole circle were depicted in Fig. 4b. Approximately 28% of temperature error was observed in our experiment and corrected by the proposed method.Conclusion and Discussion
The presence of fat can significantly affect the temperature accuracy calculated by the conventional PRF method. The proposed and improved PRF method utilized the circle fitting to determine the fat phasor first, and then to eliminate its influence on the conventional PRF calculation. As exhibited in Fig. 1b and 1c, a series of B1 and Bn points was required to realize the circle fitting, which meant that the post-processing after heating for our proposed method decided that this was a retrospective method and was not able to be used for real-time monitor in thermal therapies. The critical factor to this approach was that the larger temperature rises and the longer scanning time for thermometry could facilitate to get the fat phasor for correction. At all events, the proposed method achieved the temperature measurements in fat-containing tissues through getting the accurate water phase changes.Acknowledgements
This work was supported by financial from National Key Research and Development Program of Ministry of Science and Technology (No. 2017YFC0108900), Key Project of Shanghai Science and Technology Commission (No. 17441906400), and National Natural Science Foundation of China (No. 81727806, No. 11774231).References
1. Rieke V. MR Thermometry. In: Kahn T, Busse H, eds. Interventional Magnetic Resonance Imaging. Springer Berlin Heidelberg; 2011:271-288. doi:10.1007/174_2011_4782.
2. Odéen H, Parker DL. Magnetic resonance thermometry and its biological applications-Physical principles and practical considerations. Progress in Nuclear Magnetic Resonance Spectroscopy. 2019;110:34-61. doi:10.1016/j.pnmrs.2019.01.0033.
3. Hey S, de Smet M, Stehning C, et al. Simultaneous T1 measurements and proton resonance frequency shift based thermometry using variable flip angles. Magnetic Resonance in Medicine. 2012;67(2):457-463. doi:10.1002/mrm.229874.
4. Baron P, Ries M, Deckers R, et al. In vivo T2-based MR thermometry in adipose tissue layers for high-intensity focused ultrasound near-field monitoring. Magnetic Resonance in Medicine. 2014;72(4):1057-1064. doi:10.1002/mrm.250255.
5. Umbach D, Jones KN. A few methods for fitting circles to data. IEEE Transactions on Instrumentation and Measurement. 2003;52(6):1881-1885. doi:10.1109/TIM.2003.8204726.
6. Gallagher TA, Nemeth AJ, Hacein-Bey L. An Introduction to the Fourier Transform: Relationship to MRI. American Journal of Roentgenology. 2008;190(5):1396-1405. doi:10.2214/AJR.07.2874
Figures