1262
Monte Carlo Simulation for Magnetic Nanoparticle Biosensors1University of Windsor, Windsor, ON, Canada, 2Southeast University, Nanjing, China
Synopsis
Magnetic nanoparticles can bind to biomarkers. The particles dispersed in solution become clustered if the targets exist, leading to a different T2 relaxation time. The relaxation switch mechanism has been applied as a biosensor for various biomarkers. However, the change in relaxation rate is related to the nanoparticle size and concentration. Some theoretical models have been applied to predict this rate of change in search for the optimal system parameters. In this work, an open-source Monte Carlo algorithm has been developed to simulate water diffusion in microscopic environments with nanoparticles and the effective T2 relaxation times.
Introduction
Magnetic nanoparticles can bind to biomarkers. The particles dispersed in solution become clustered if the targets exist. The configuration change leads to a different T2 relaxation time, that can be detected with a bulk measurement. The relaxation switch mechanism has been applied as a biosensor for various biomarkers1. However, the change in relaxation rate is related to the nanoparticle size and concentration. Some theoretical models have been applied to predict this rate of change in search for the optimal system parameters. In this work, an open-source Monte Carlo algorithm has been developed to simulate water diffusion in microscopic environments with nanoparticles and the effective T2 relaxation times.Methods
The measured T2 relaxation time is affected by diffusion in an inhomogeneous static magnetic field. Python and NumPy were employed to develop the fully multithreaded diffusion simulation with Numba to provide C-like performance in Python. Python was chosen for its accessibility and flexibility. The algorithm is easy to modify, allowing custom pulse sequences and different microscopic environments. The motion and net displacement of the particles can be visualized during the simulation. The particles are propagated in time steps, undergoing Brownian motion in the user specified environment. For each step, the particles collide and reflect on barriers. The maximum number of collisions per step can be tuned and was set to 6. The user specified pulse sequence is simulated with Bloch equations as the particles diffuse. In general, pulse sequences with arbitrary waveforms of RF pulses, magnetic field gradient pulses, and inhomogeneous magnetic fields can be included. Static magnetic field distribution due to the high susceptibility of the magnetic nanoparticles was calculated based on the analytical formula2.Results and Discussion
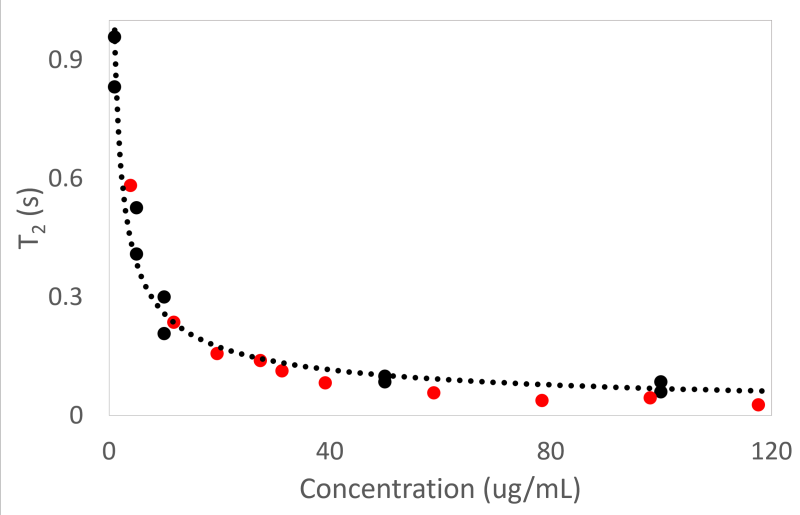
Nanoparticle ConcentrationsTo verify the Monte Carlo simulation, Carr-Purcell-Meiboom-Gill (CPMG) measurements were performed on different concentrations of streptavidin magnetic beads of 100 nm at 1T. 6000 points were acquired with a 2 ms echo spacing. The results were compared to the simulation, as shown in Fig. 1. A 50 um x 50 um region was simulated with different nanoparticle concentrations. 128 points were acquired in the simulated CPMG experiments with 32000 diffusing water molecules, subject to the nanoparticle-induced inhomogeneous field. Non-negative least squares fitting was used to determine the T2 values. The simulated results (red points) agreed well with the experimental data (solid black points). Higher concentrations of nanoparticles resulted in shorter T2 values.
Different configurations of nanoparticles
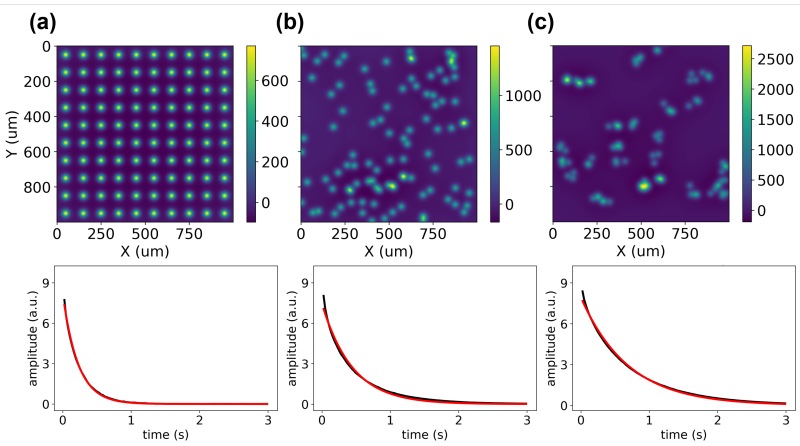
The nanoparticle biosensors detection is based on the change of particle configuration. The existence of target biomolecules leads to clustering of the otherwise dispersed nanoparticles, resulting in a change in the T2 relaxation time. Three configurations of metal nanoparticles were simulated. The magnetic field, in Hz, of a uniformly distributed, randomly distributed and clustered configuration of 100 nanoparticles is shown in the first row of Fig. 2. The clustered configuration contains groups of 3-5 particles, simulating nanoparticles binding to the targets. CPMG simulations with 128 points and an echo spacing of 0.2 s were performed on the phantoms with 64000 particles and a run time of approximately 2 minutes. The CPMG signals are shown in the 2nd row of Fig. 2. Significant differences in T2 were observed at 0.2 s, 0.4 s and 0.7 s, indicating the three configurations could be distinguished with a bulk CPMG measurement.
The simulation will be applied to investigate a large range of parameters, including the particle size, concentration and biomolecule concentration, to maximize the T2 difference and optimize biosensor sensitivity.
Conclusion
We have developed a fast, easy to implement algorithm for rapid Monte Carlo simulation to investigate the effectiveness of magnetic nanoparticle biosensors. The simulation results agreed with experiments for various concentrations of nanoparticles. The different configurations of nanoparticles can be differentiated based on T2 relaxation times. This simulation will be employed to optimize the nanoparticle biosensor systems for a wide range of targets, including cancer cells and COVID virus.Acknowledgements
T. P. thanks NSERC Canada for a CGS M Scholarship. D. X. thanks NSERC Canada for a Discovery Grant.References
1. Min et al, Mechanism of Magnetic Relaxation Switching Sensing, ACS Nano, 6, 8, 6821–6828, 2012.
2. Bhagwandien et al, Numerical analysis of the magnetic field for arbitrary magnetic susceptibility distributions in 3D, Magn. Reson. Imaging, 12, 101–107, 1994.
Figures