1261
Virtual non-contrast enhanced MRI (VNC-MRI)
Thomas Lindner1, Hanna Debus1, and Jens Fiehler1
1University Hospital Hamburg-Eppendorf, Hamburg, Germany
1University Hospital Hamburg-Eppendorf, Hamburg, Germany
Synopsis
This study presents an approach to retrospectively remove contrast agent from the final images, denoted as "virtual non-contrast enhanced imaging"
Introduction
The use of contrast agent (CA) for the enhancement of different structures and tissues is a standard method in clinical routine MRI. In oncology, usually one initial scan before injection and a second scan after are performed. However, the two scans are acquired at different times and thus movement of the patient can occur and suboptimal subtraction, potentially leading to false positive or negative diagnosis. Until now, virtual non-contrast enhanced (VNC) imaging has only been used in dual energy computed tomography (CT) [1]. Applying this technique to MRI would allow for contrast enhanced and non-contrast enhanced images without spatial shift and time saving. The aim of this study is to investigate whether it is possible to subtracted the contrast enhanced regions. Using the variable flip angle (VFA) method, two contrast enhanced images are recorded at the same time [2].Materials and Methods
VFA scans with two flip angles have been performed both on a phantom and two human subjects (Figure 1). The phantom contained different sample tubes casted in gelatin (Figure 3). The sample tubes contained Dotarem as CA (concentration of 0.5 mmol/ml, diluted 1/8 with water), pure water and oil, a mix of two materials each and one mix of all three materials (Figure 3A). The two human subjects (glioblastoma with CA uptake, Fig. 4 and glioma without CA uptake, Fig. 5) underwent scanning to test the postprocessing algorithm in vivo. All scans were acquired on a Siemens Prisma 3T Scanner (Siemens Healthcare, Erlangen, Germany) using a 64-channel head coil. The VFA scan took 4 minutes and 58 seconds. Parameters: 5° and 26° flip angle,TR/TE 15 ms/2.31, 240*240 mm field of view, 0.31*0.31 in-plane resolution and 22 slices of 3 mm slice thickness with 20 % gap. The high FA value was chosen to be optimized for signal of CA (Figure 2) Postprocessing was performed using Matlab R2018a (The Mathworks, Natick, MA) [3]. The system of three unknowns therefore looks like the following:$$ F_{CA}S_{CA,FA1}+F_{TIS}S_{TIS,FA1}+F_{BG}S_{BG,FA1} = S_{FA1} $$
$$ F_{CA}S_{CA,FA2}+F_{TIS}S_{TIS,FA2}+F_{BG}S_{BG,FA2} = S_{FA2} $$
One assumption of the equation is that the signal value of the pixel of interest only consists of the three constituent materials, i.e. the sum of the fraction of the three materials equals 1.
$$ F_{CA}+F_{TIS}+F_{BG} = 1 $$
The individual fractions can then be found by multiplying both images with the inverse of the sensitivity matrix:
$$ \begin{bmatrix} F_{CA} \\ F_{TIS} \\ F_{BG} \end{bmatrix} = \begin{bmatrix} S_{CA,FA1} & S_{TIS,FA1} & S_{BG,FA1} \\ S_{CA,FA2} & S_{TIS,FA2} & S_{BG,FA2} \\ 1 & 1 & 1 \end{bmatrix}^{-1} \begin{bmatrix} S_{FA1} \\ S_{FA2} \\ 1 \end{bmatrix} $$
BG = background, TIS = Tissue, CA = Contrast Agent, F = Fraction, S = Signal, FA = flip angle
Using six fixed values (Fig. 4) for three different materials, material decomposition is possible by using the inverse of the sensitivity matrix to calculate the material fractions [4]. This leads to a determination of the contrast enhanced areas and an elimination in the resulting image
Results and Discussion
Results of the phantom scans show that three materials can be distinguished correctly (Fig. 3). Postprocessing of the brain scans generates two output images, one for each flip angle (Fig. 4 and 5). All four output images are free of regions enhanced by the contrast agent except for the area between the two hemispheres (falx cerebri) where a slightly brighter residual is still visible (Fig. 5D). Furthermore, all VNC images show the same contrast as the corresponding VFA image. All structural borders are clearly identifiable, gray and white matter can be discriminated throughout the whole image and the visual impression of the TNC images is met.Conclusion
Using the decomposition algorithm based on six values derived from two images acquired with VFA allows for the generation of VNC images presenting the same information as the TNC image and the subsequent contrast enhanced image.Acknowledgements
No acknowledgement found.References
[1] Lehti et. al. Acta Radiol Open 2018:7:2058460118790115
[2] Cheng and Wright Magn Reson Med 2006:55:566-574
[3] Handschuh et. al. J Microsc 2017:267:3-26
[4] Badea et. al. Am J Physiol Lung Cell Mol Physiol 2012:302:L1088-L1097
Figures
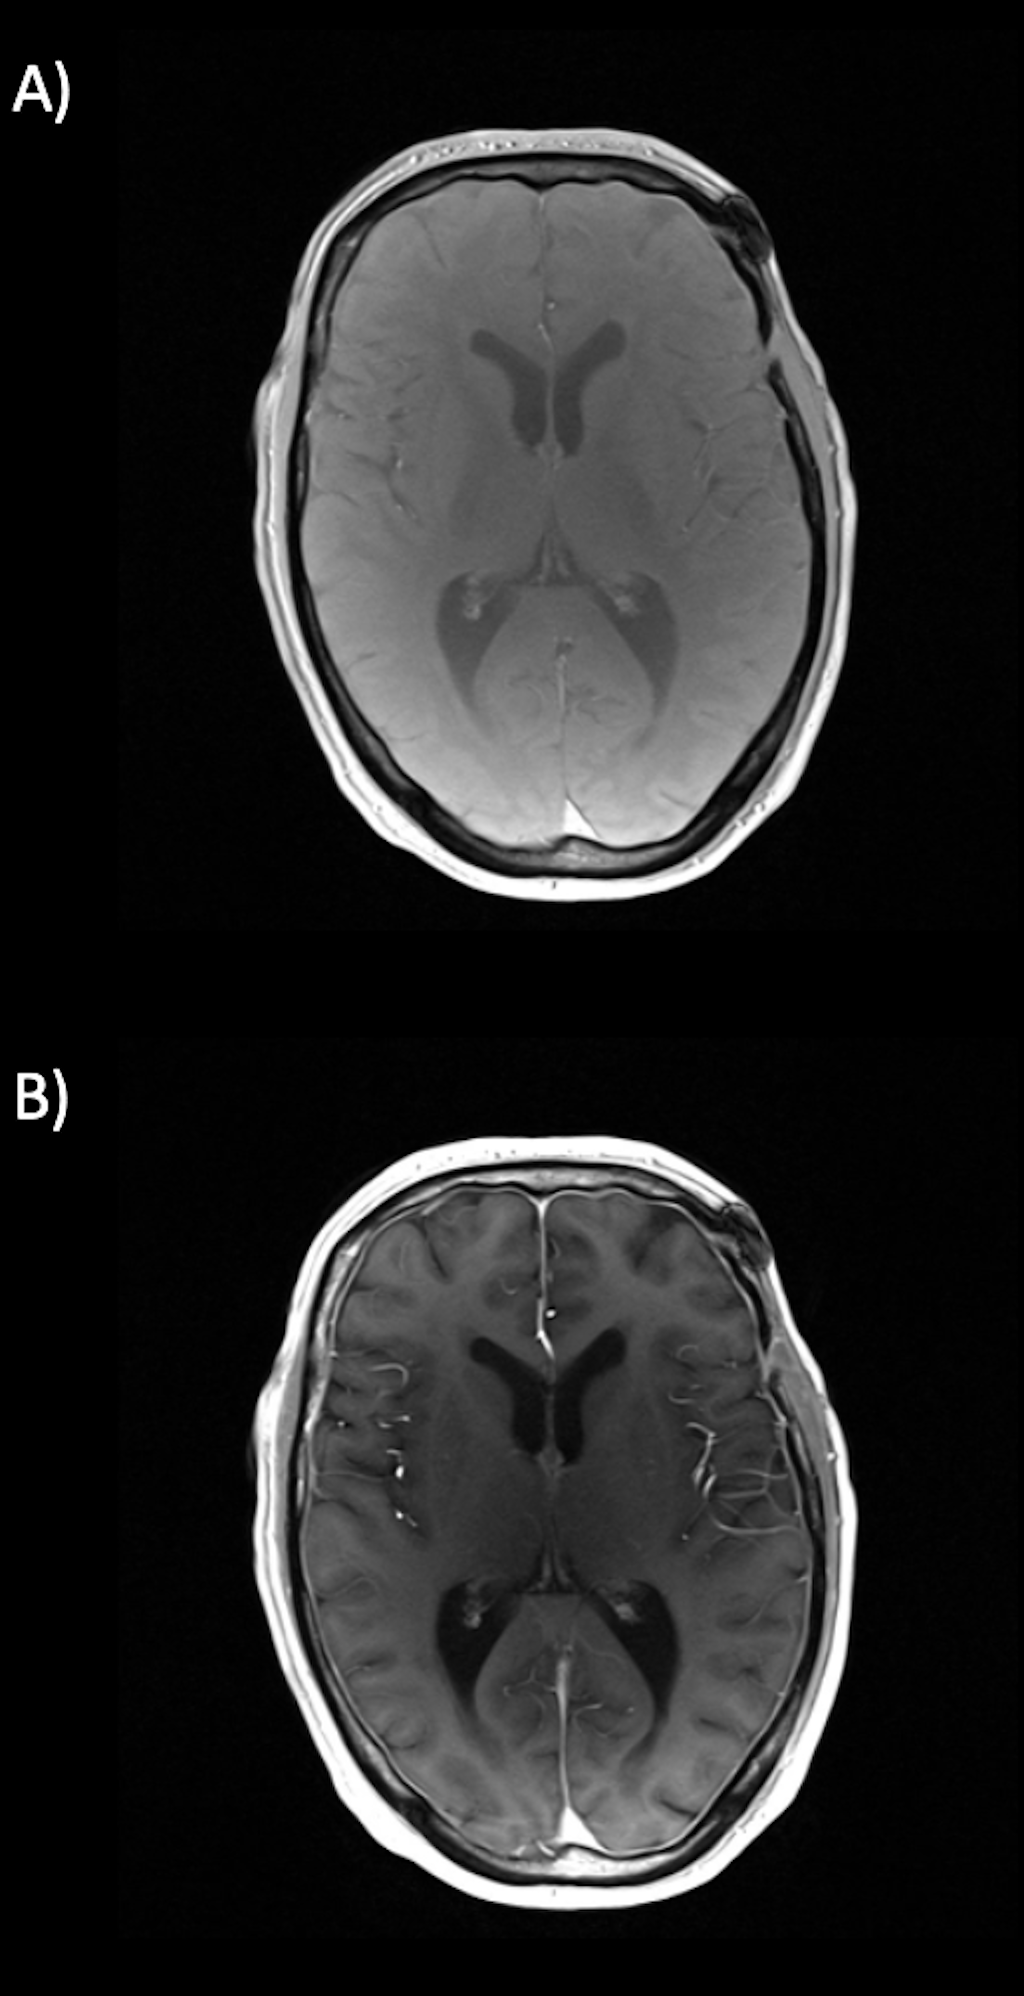
Figure 1: Exemplary VFA images, acquired with a low flip angle of 5° (A)
and a high flip angle of 26° (B).
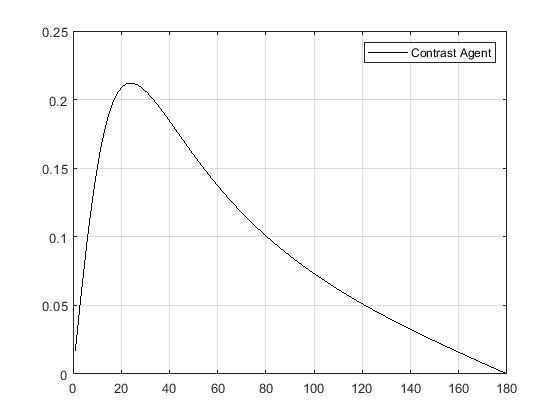
Figure
2: Signal evolution from FA 0-180 for the given T1 and TR values for contrast
agent.
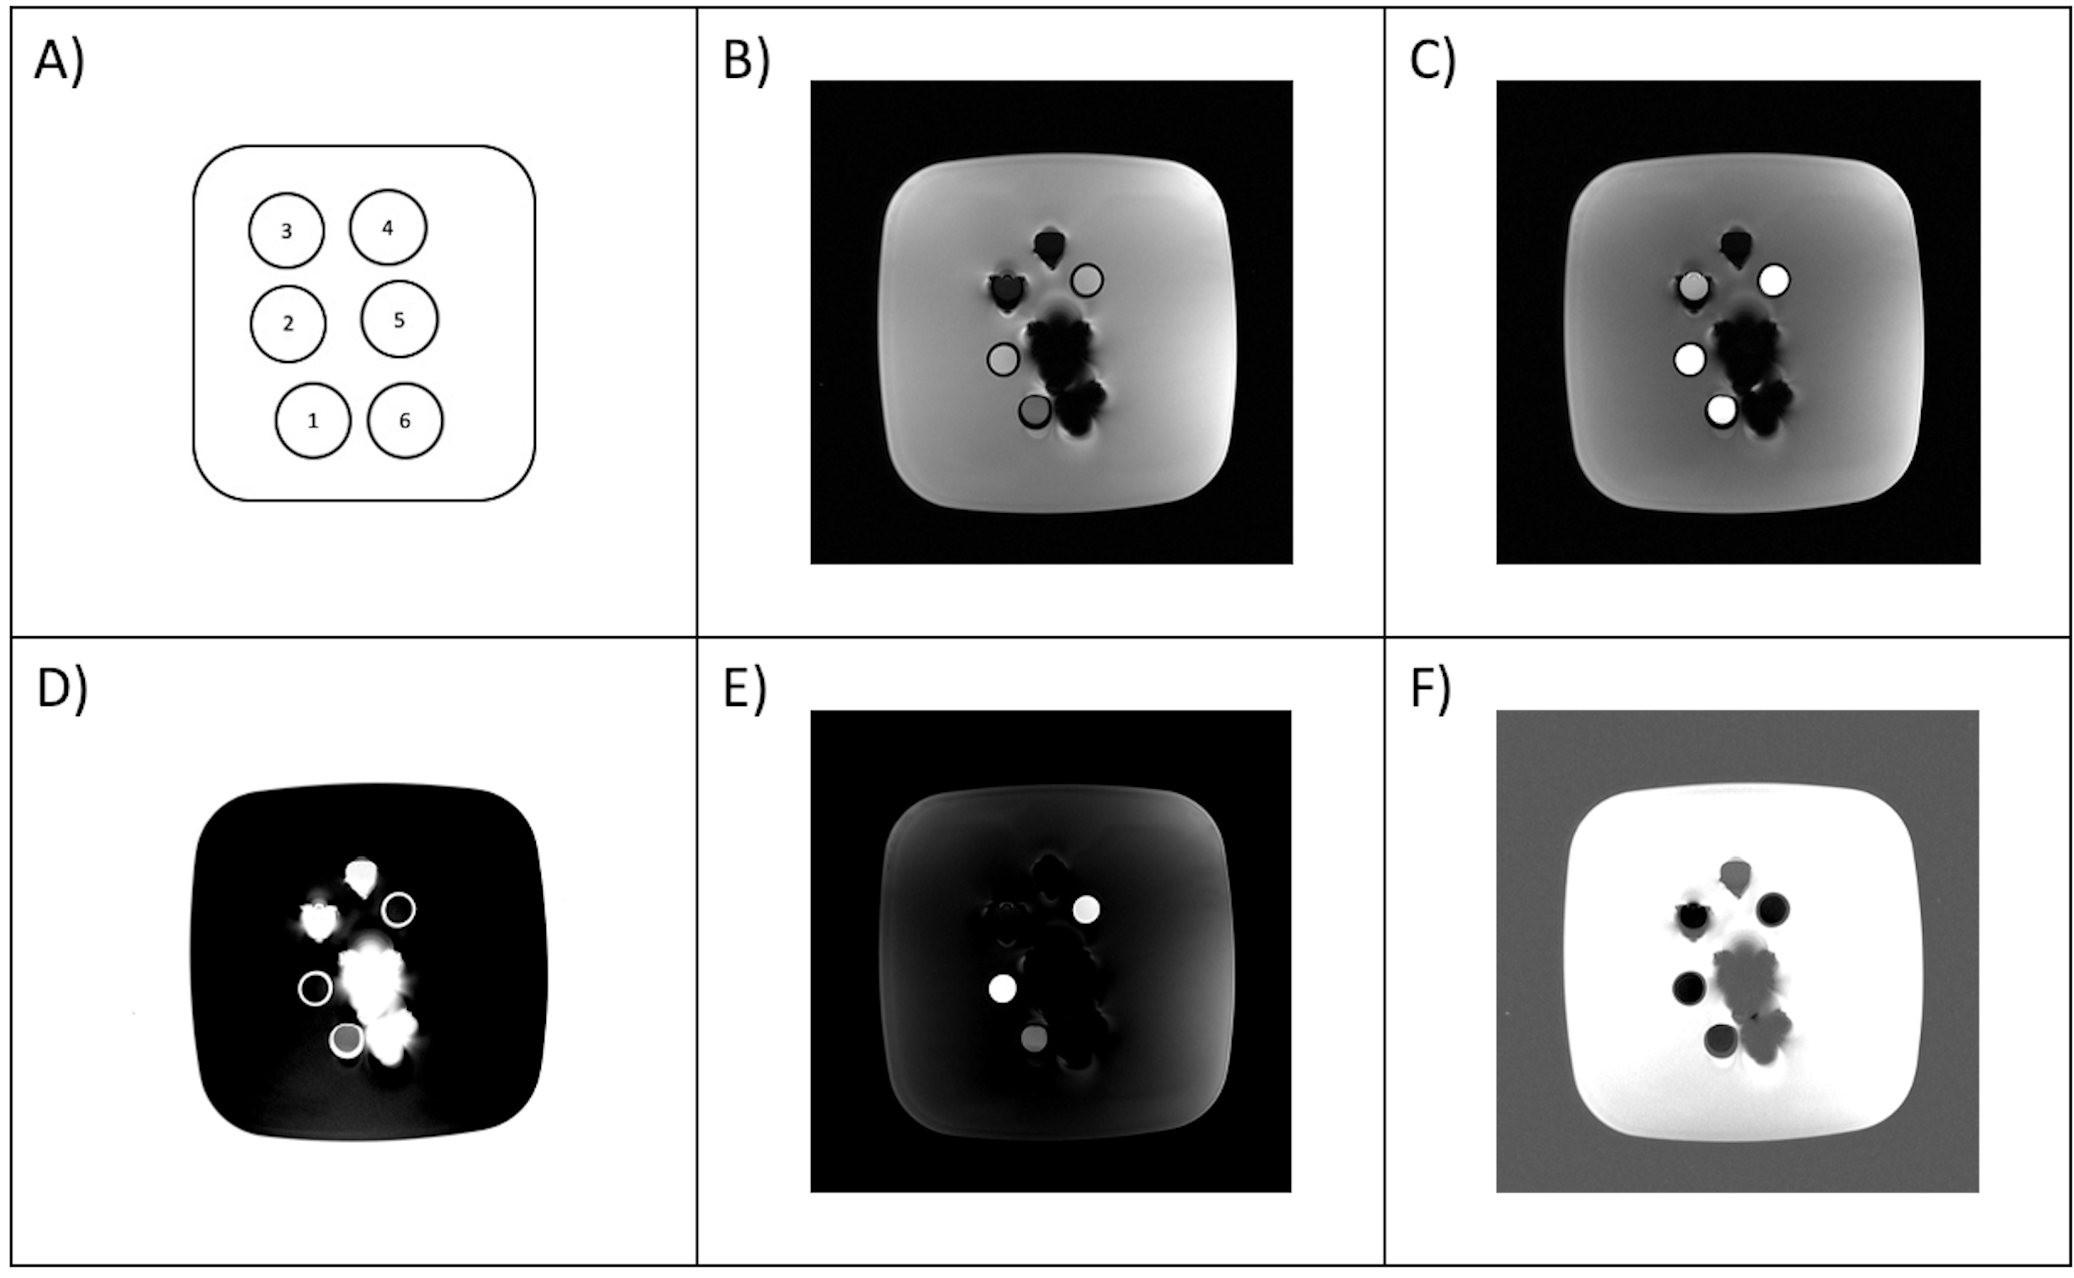
Figure
3: Schematic of the phantom (A) with sample tubes filled with oil (1), water
(2), 50/50 Dotarem with water (3), 50/50 oil and water (4), 50/50 oil and one part Dotarem (5),
and 1/3 water, oil and Dotarem respectively (6). Images acquired with 5° (A) and 26° flip angle (B).
Output images after postprocessing with decomposition of three materials:
Contrast agent Dotarem (D), water (E) and gelatin (F). ROIs for determination
of the values used for the sensitivity matrix were drawn in sample tubes 2 and
3 and in a homogenous region of gelatin on the left side of the phantom.
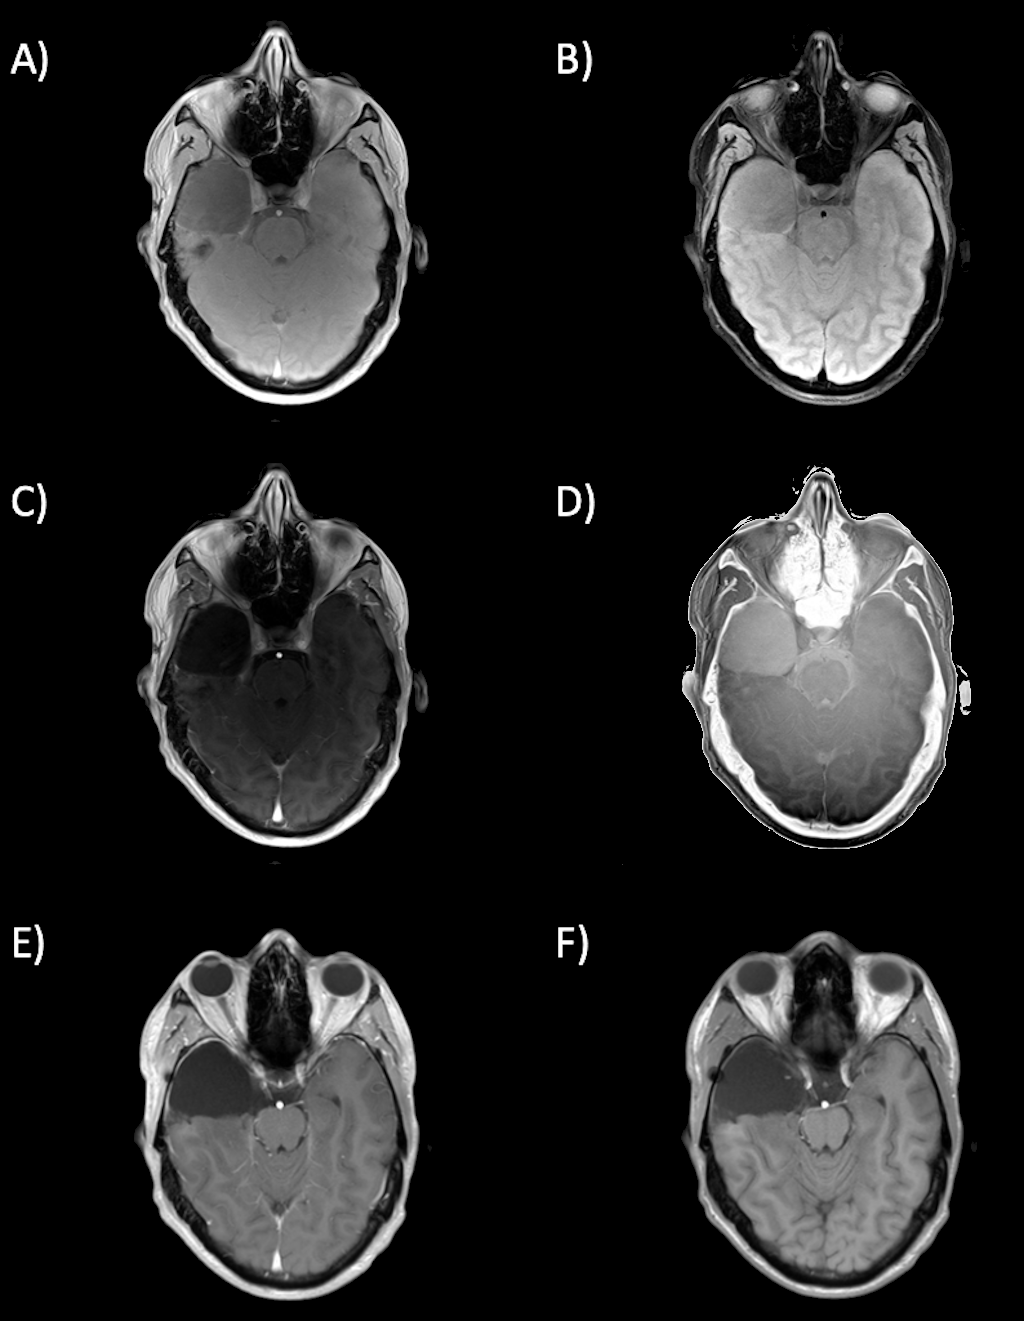
Figure
4: In-vivo scans of patient one. Image acquired with a low flip angle of 5° (A)
and the corresponding VNC image (B). Image acquired with a high flip angle of
26° (C) and the corresponding VNC image (D). T1weighted image acquired after CA
injection (E), true non-contrast enhanced image (F).
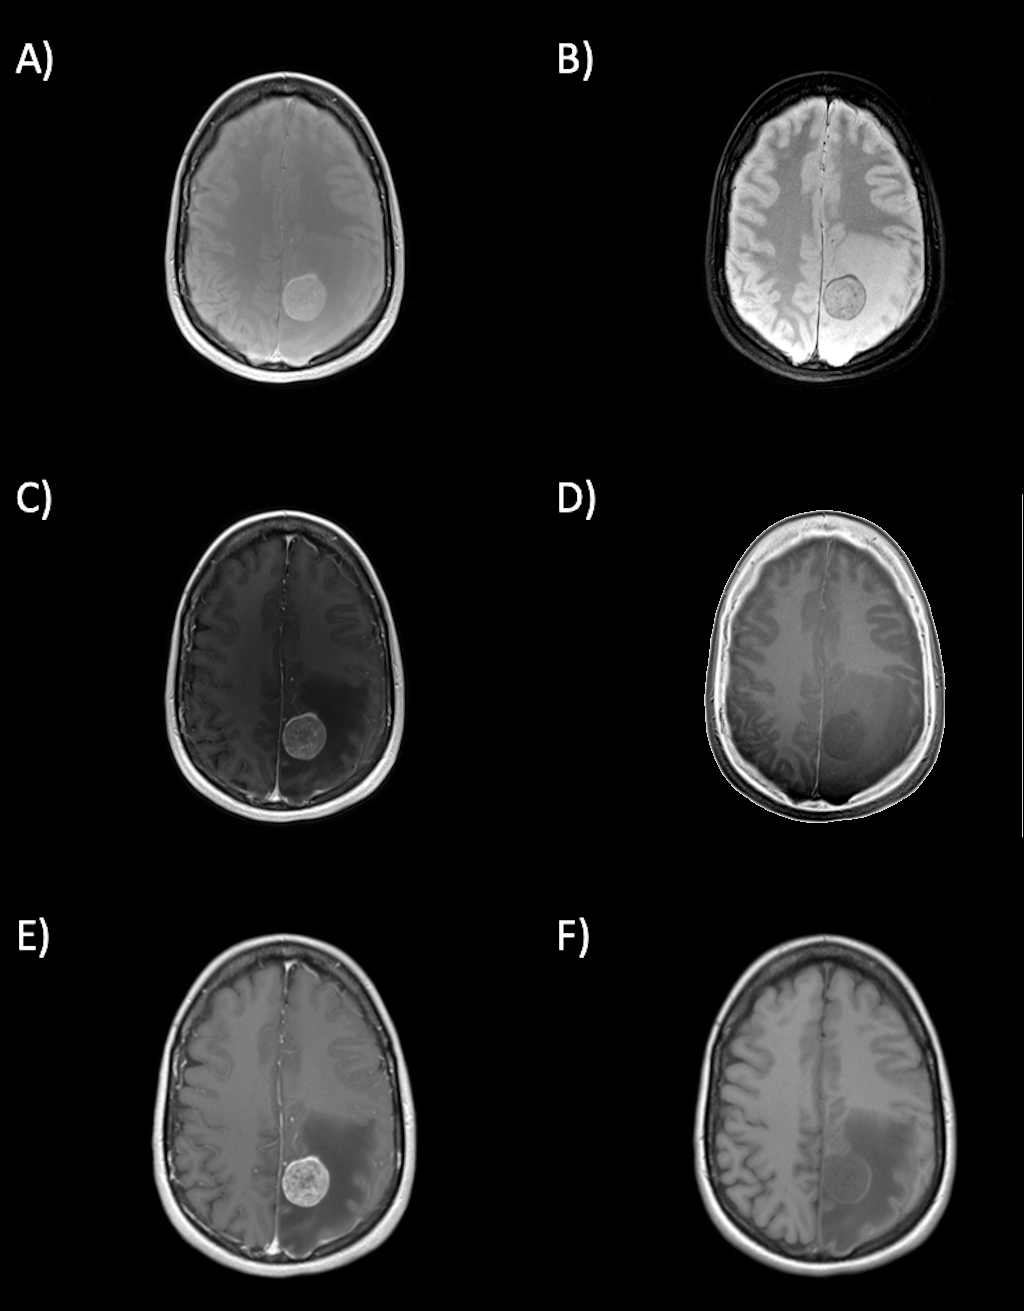
Figure
5: In-vivo scans of patient two. Image acquired with a low flip angle of 5° (A)
and the corresponding VNC image (B). Image acquired with a high flip angle of
26° (C) and the corresponding VNC image (D). T1weighted image acquired after CA
injection (E), true non-contrast enhanced image (F).