1260
Towards high precision thermal based RF safety assessment with cardiac triggered MR thermometry1Center for Image Sciences - Computational Imaging Group, University Medical Center Utrecht, Utrecht, Netherlands, 2Biomedical Engineering - Medical Imaging Analysis, Eindhoven University of Technology, Eindhoven, Netherlands
Synopsis
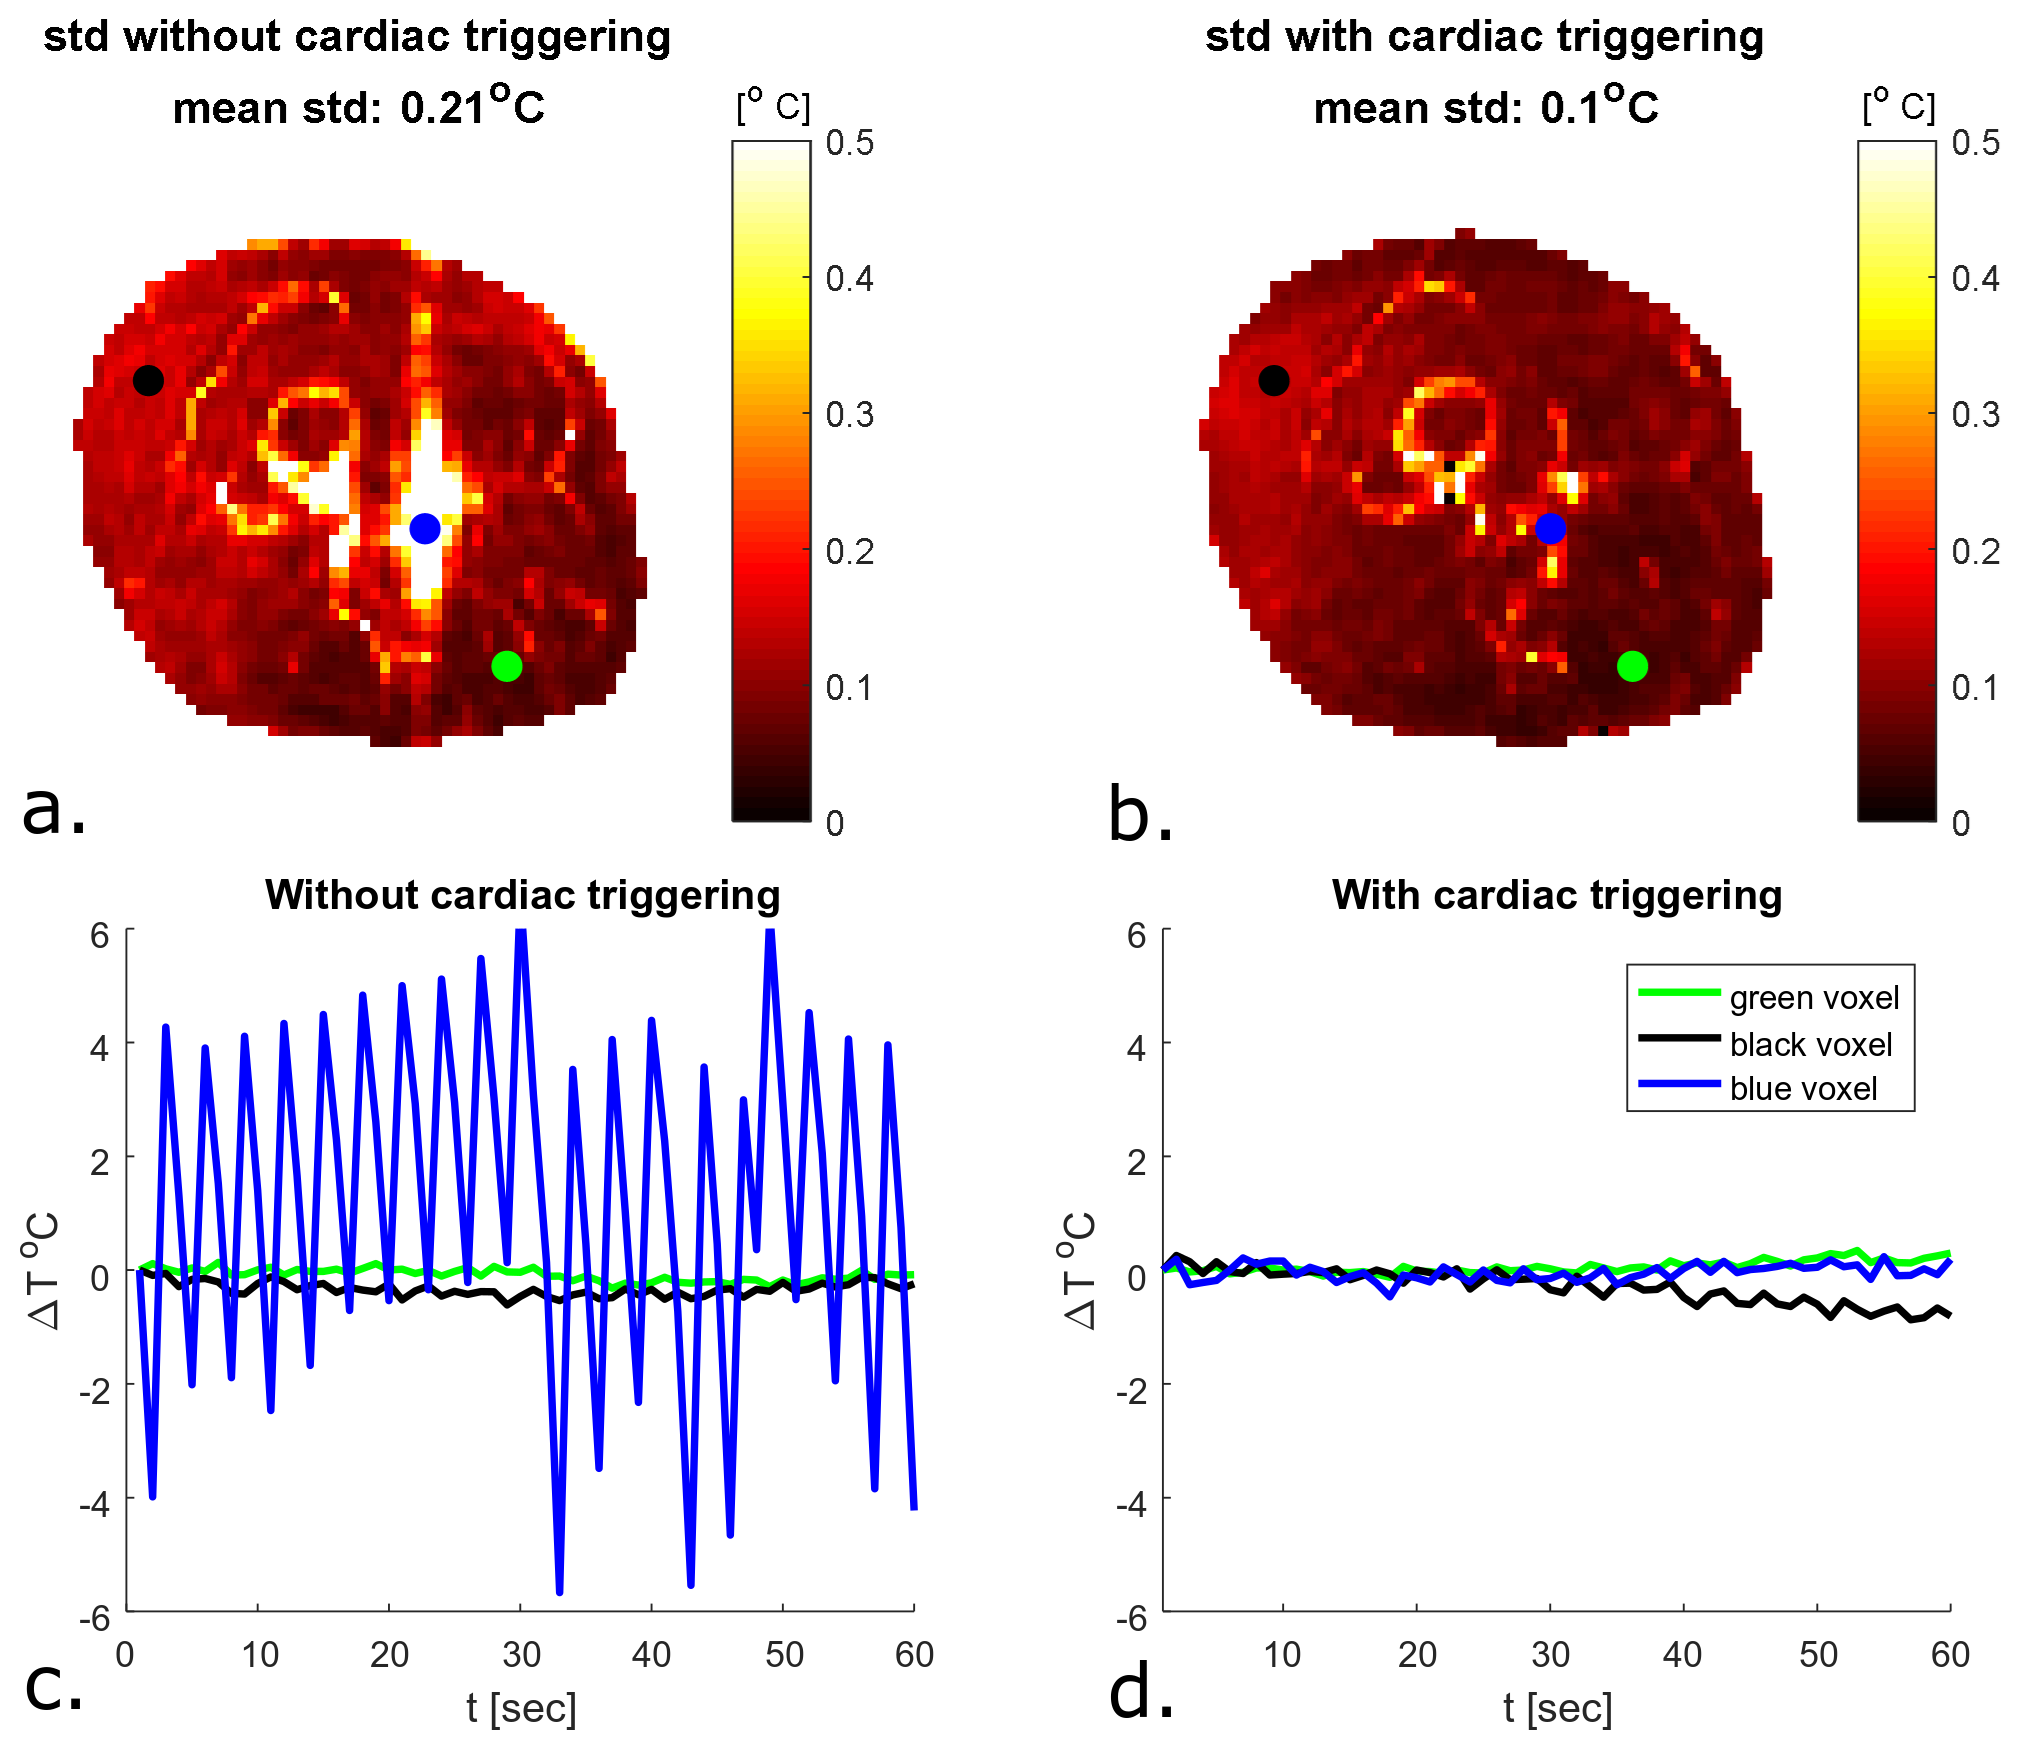
To validate thermal simulations, high precision in vivo MR thermometry measurements are required. We demonstrate in vivo MR thermometry in the upper leg at 7T, where we improved the precision of our temperature measurements by using cardiac triggering with a PPU. The standard deviation in baseline measurements without RF heating decreased more than two-fold (0.1 ° C with PPU compared to 0.21 ° C without PPU). We were able to perform reproducible MR thermometry measurements in vivo, with local temperature increases of less than 1 °C.
Introduction
RF safety assessment uses SAR limits to arrive at power thresholds1. However, temperature rise poses the actual safety risk. Thermal dose2 is considered the quantity that correlates best with potential tissue damage, however thermal simulations are challenging to validate3. More precise MR Thermometry (MRT) measurements could enable validation of thermal simulations. MRT using the proton resonance frequency shift (PRFS) method is often used in vivo to measure temperature distributions in hyperthermia or high intensity focused ultrasound5,6. However, MRT sequences are not precise enough to measure the smaller local temperature rise in subjects undergoing an MRI exam. The purpose of this study is to explore the possibility to measure temperature rise in vivo with such precision that it can reliably determine temperature rise not exceeding 1 °C. It was recently suggested that especially breathing and cardiac induced B0 changes affect the precision of PRFS MRT7. Here we demonstrate that with cardiac triggering the precision of MRT in the upper leg is improved by a factor 2, making the precision sufficient for validation purposes with low local temperature rise.Methods
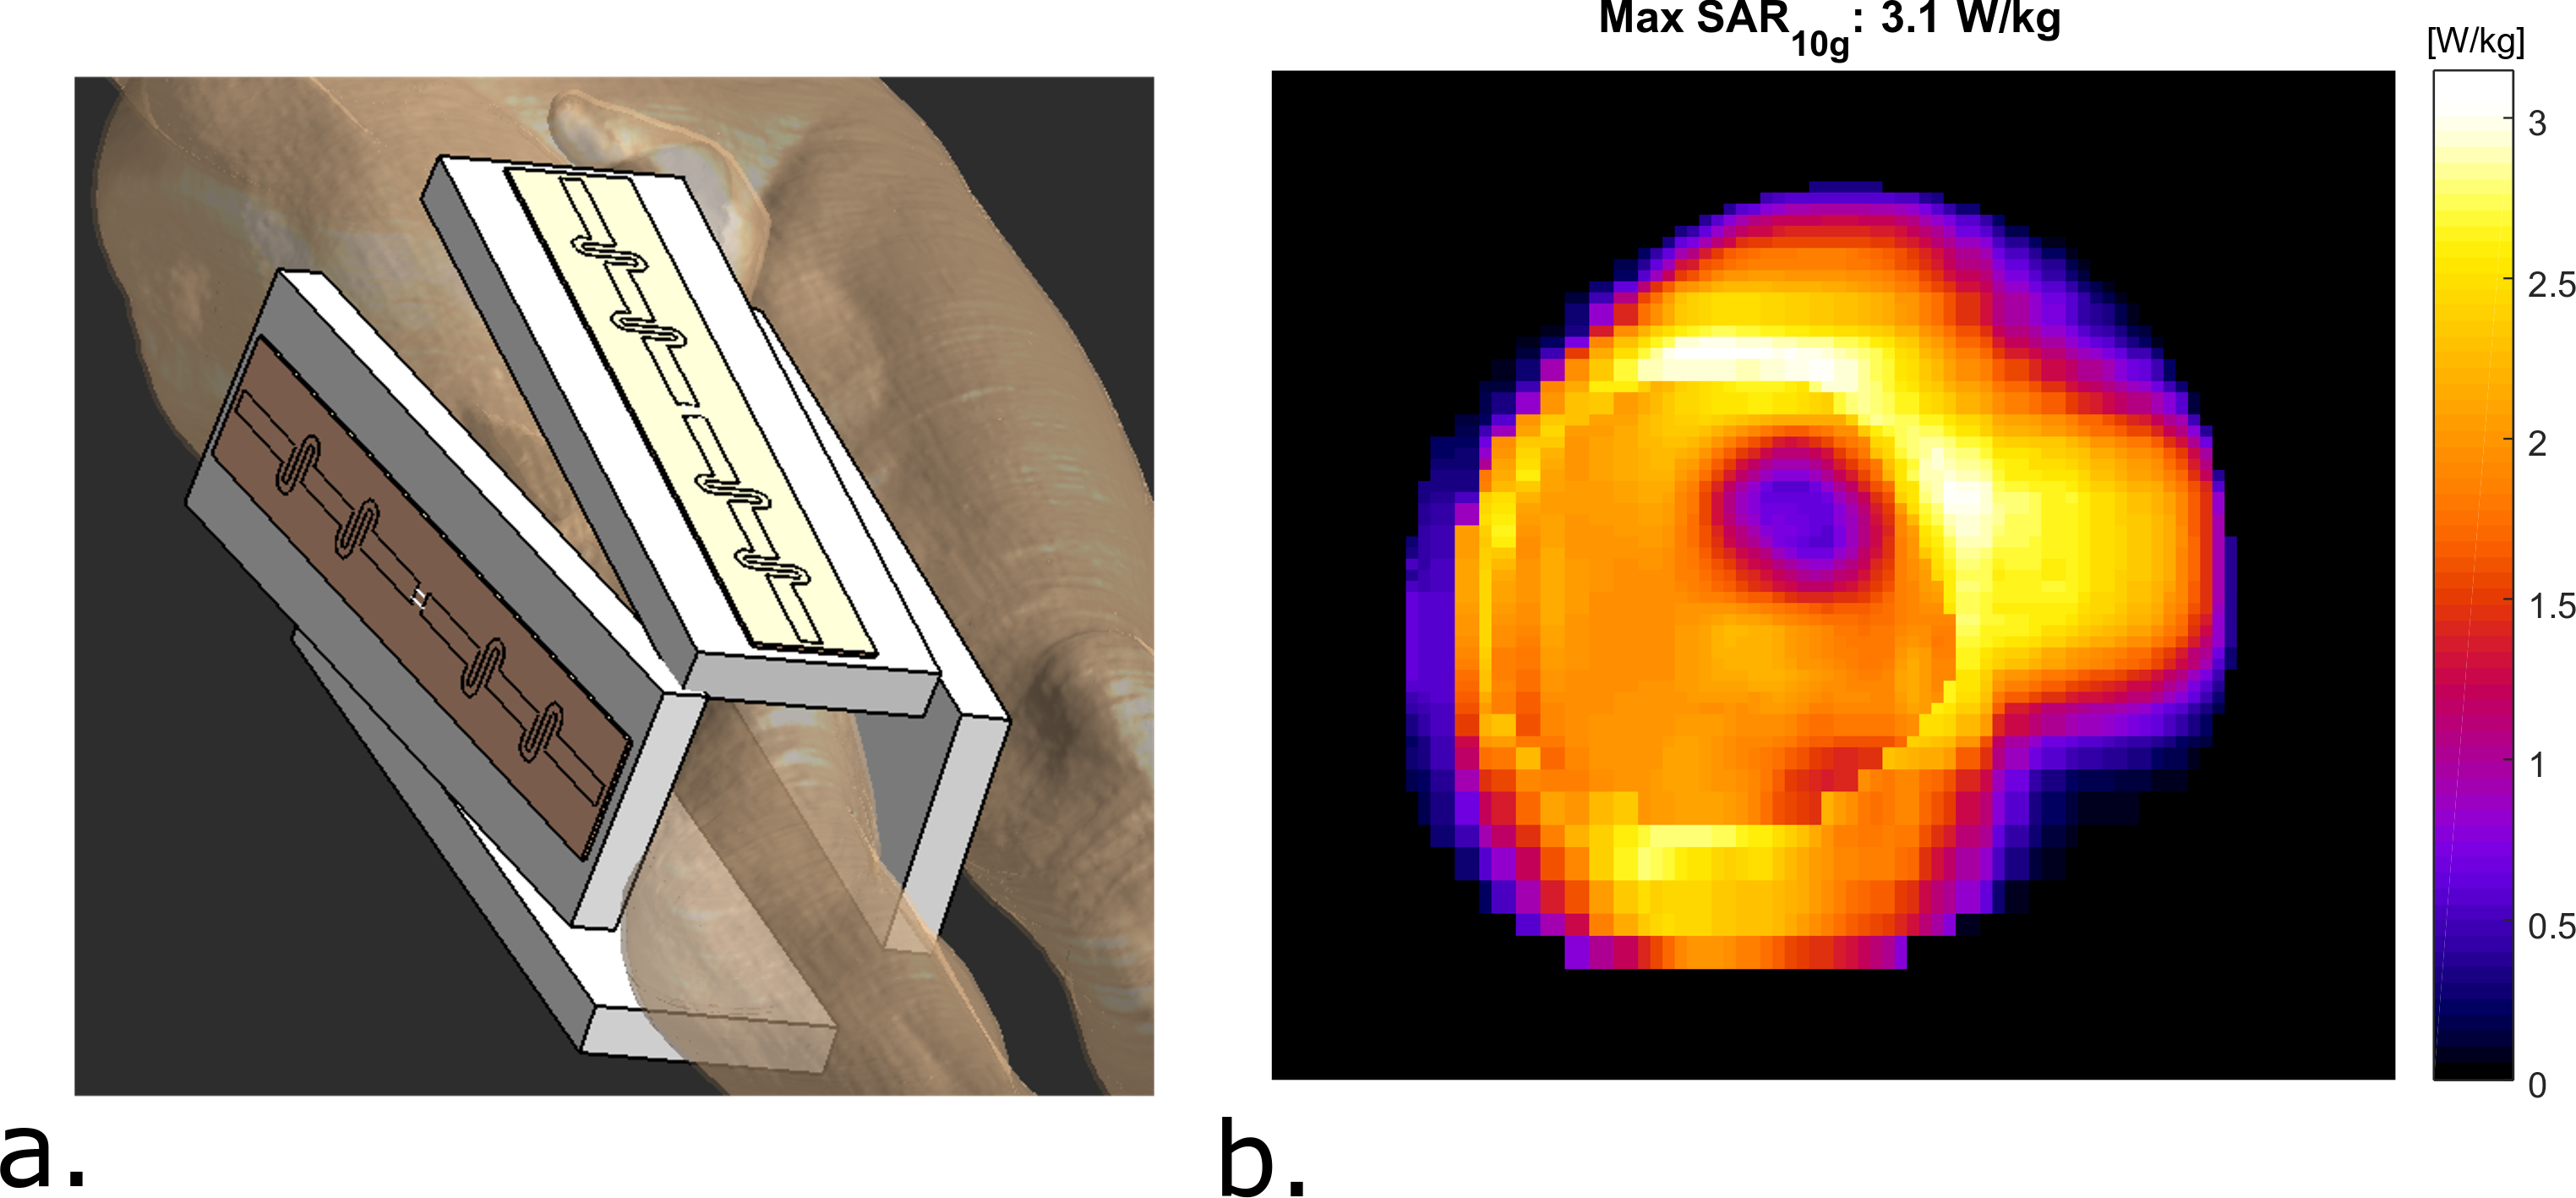
Setup and simulationsOur imaging setup consists of 4 fractionated dipole antennas with receive loops7, which are positioned around the right upper leg (figure 1a). Before doing MRT, electromagnetic simulations were performed on a human model (Duke, virtual family8) in Sim4Life (Zurich Medtech, Zurich, Switzerland). To arrive at safe limits of operation for the MRT scans, we calculated the worst-case peak SAR for phase only shimming9.
Imaging experiments
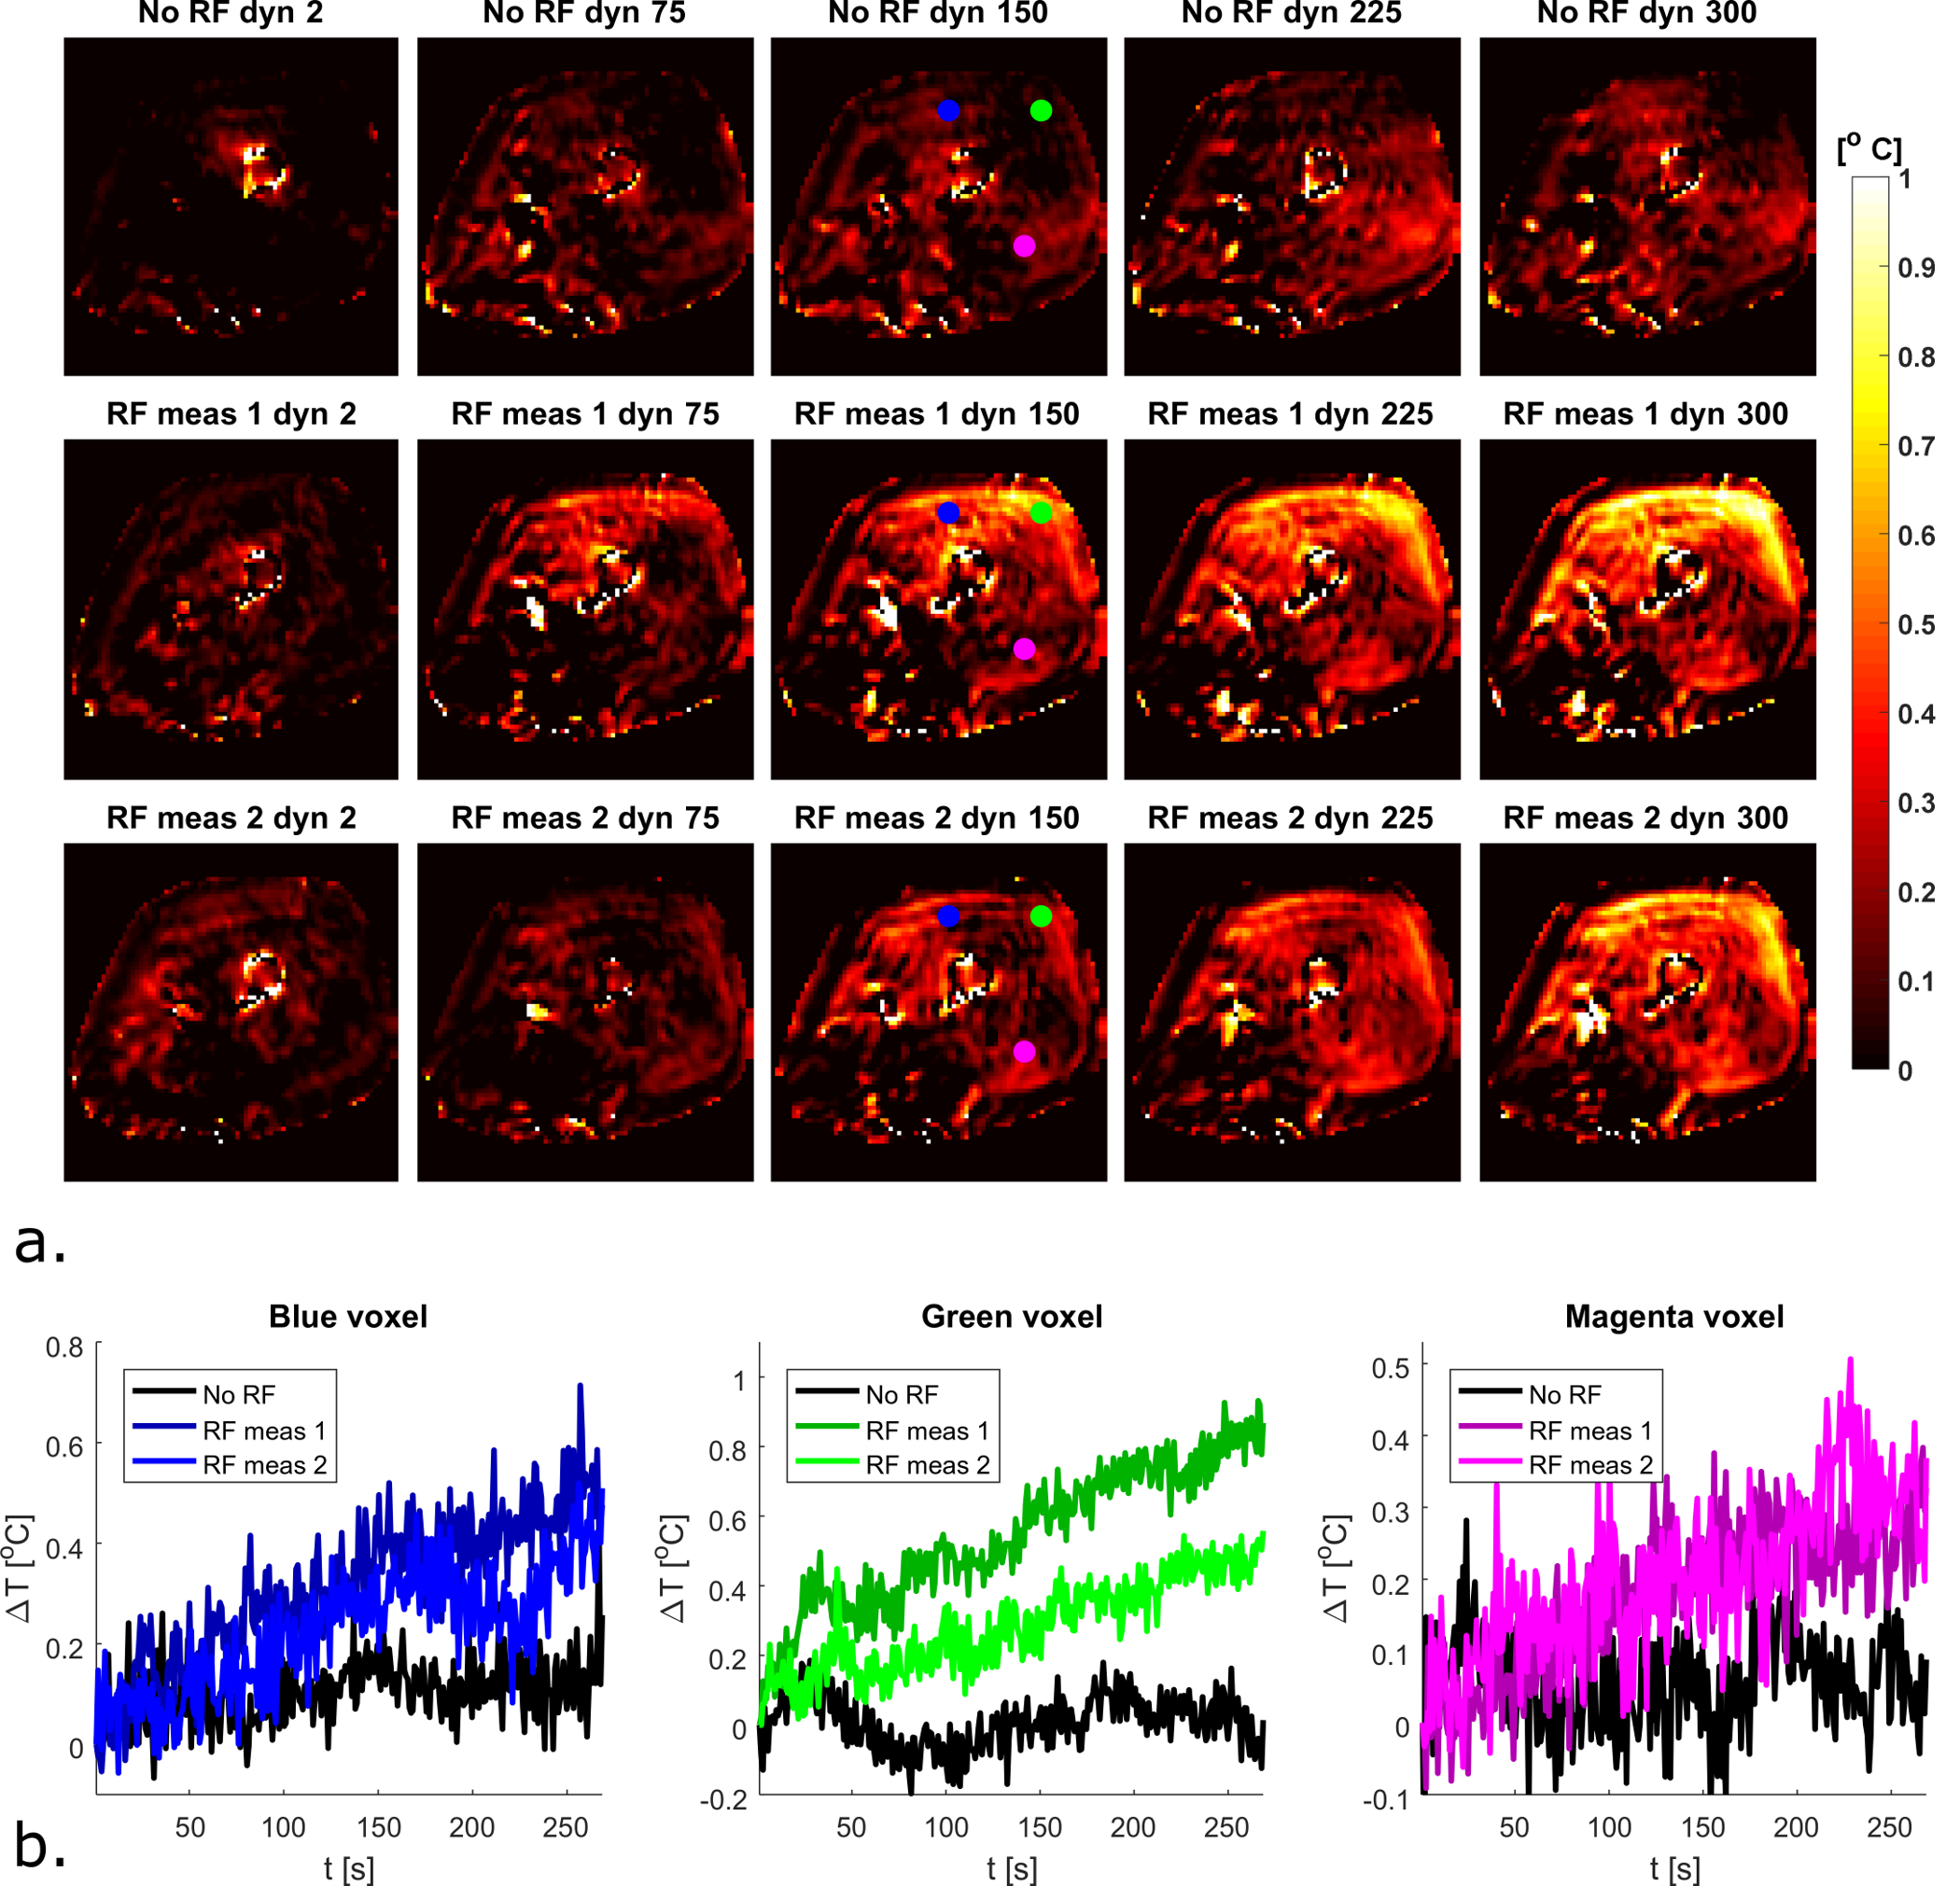
After obtaining IRB approval, we performed imaging in a single volunteer (male, age 41, BMI 24.9). To visualize cardiac induced motion in the upper leg, we acquired a single slice 2D Cine acquisition consisting of 33 heart phases (acquisition parameters in table 1). MRT was acquired using the PRFS method (acquisition parameters table 1). For heating, a block pulse of 7.5 ms was used at 10 kHz off-resonance with an average forward power of 5.2 W per channel, for a total time of 257s. 300 dynamics were acquired in a single shot acquisition (shot duration 720 ms). One dynamic was acquired per heartbeat using PPU retrospective gating. To demonstrate the effect of cardiac triggering, we first acquired MRT images without heating, with and without a PPU present. MRT images where then acquired with RF heating, using the same RF shim twice to demonstrate repeatability. Background field drift correction was done by estimated drift from near-harmonic 2D reconstruction in the surrounding subcutaneous fat layer3,10.
Results
Figure 1 shows the imaging setup and the simulated SAR10g distribution. For a total input power of 4W (1W per channel), peak SAR is 3.1 W/kg. To adhere to the local SAR limit of 40W/kg in the leg in first level controlled mode1, abiding a safety factor of 2.4, a total average power of 21.5W (5.3 W per channel) is allowed. Cine imaging of the upper leg during the cardiac cycle clearly identifies pulsatile motion of the arteries during the cardiac cycle (figure 2). As can be observed in the MRT images acquired without RF heating (figure 3), cardiac induced pulsatile blood flow results in large apparent temperature fluctuations along the phase encode direction in the baseline image, even in voxels that are not situated near an artery. This effect due to pulsatile blood flow is seen as ghosting in the magnitude images. Average temporal standard deviation over the slice improves more than two-fold when acquiring MRT with cardiac triggering. The resulting MRT measurements with and without RF heat applied are shown in figure 4. For the sequence with RF, a moderate temperature increase is measured over all dynamics. For the sequence with RF heat, much stronger temperature inrceases are observed and the heating pattern is reproducable over two consecutive measurements.Discussion
By acquiring PRFS images with cardiac triggering, it was possible to improve the precision of MRT for in vivo RF safety measurements. Small residual cardiac pulsations are still present, however their periodic nature offers opportunities in the future to filter them out. Our MRT acquisition method can be used to validate prediction of thermal dose without having to apply significant RF heating because of low standard deviation in the temperature measurement (0.1°C). Previous studies on in vivo MRT for RF coil safety assessment either were acquired with larger temperature increases3,11 or in anesthetized animals6. A remaining issue for our method is the drift and motion correction and the resulting measurement accuracy. As becomes visible from figure 4, there is still apparent heating in some parts of the fat layer, which is either the result of motion or erroneous drift correction. Future studies will focus on improving drift and motion correction, measuring or estimating baseline temperature, comparison to subject specific simulations and extension to other imaging targets.Conclusion
We demonstrated that cardiac induced motion has a strong effect on the precision of MRT measurements. By applying cardiac triggering with a PPU we were able to decrease the standard deviation of a baseline measurement more than two-fold. With these minor modifications to the PRFS sequence were able to image spatial temperature increase distributions within the IEC guidelines during a 5 minute RF heating interval.Acknowledgements
No acknowledgement found.References
1. IEC. Medical electrical equipment. Part 2-33: particular requirements for the safety of magnetic resonance equipment for medical diagnosis. IEC 60601-2-33. 2015.
2. Van Rhoon GC, Samaras T, Yarmolenko PS, Dewhirst MW, Neufeld E, Kuster N. CEM43°C thermal dose thresholds: A potential guide for magnetic resonance radiofrequency exposure levels? Eur Radiol. 2013. doi:10.1007/s00330-013-2825-y
3. Simonis FFJ, Raaijmakers AJE, Lagendijk JJW, van den Berg CAT. Validating subject-specific RF and thermal simulations in the calf muscle using MR-based temperature measurements. Magn Reson Med. 2017;77(4):1691-1700. doi:10.1002/mrm.26244
4. Rieke V, Pauly KB. MR thermometry. J Magn Reson Imaging. 2008. doi:10.1002/jmri.21265
5. Winter L, Oberacker E, Paul K, et al. Magnetic resonance thermometry: Methodology, pitfalls and practical solutions. Int J Hyperth. 2016. doi:10.3109/02656736.2015.1108462
6. Le Ster C, Mauconduit F, Mirkes C, et al. RF heating measurement using MR thermometry and field monitoring: Methodological considerations and first in vivo results. Magn Reson Med. 2020;(July 2020):1282-1293. doi:10.1002/mrm.28501
7. Steensma BR, Voogt IJ, Leiner T, et al. An 8 ‑ channel Tx / Rx dipole array combined with 16 Rx loops for high ‑ resolution functional cardiac imaging at 7 T. Magn Reson Mater Physics, Biol Med. 2017;(0123456789). doi:10.1007/s10334-017-0665-5
8. Christ A, Kainz W, Hahn EG, et al. The Virtual Family - Development of surface-based anatomical models of two adults and two children for dosimetric simulations. Phys Med Biol. 2010. doi:10.1088/0031-9155/55/2/N01 9. Meliado, E. F, Raaijmakers AJE, Luijten PR, van den Berg CAT. Fast method to get an upper bound of the maximum SAR10g for body coil arrays. Proc 9th Sci Meet Int Soc Magn Reson Med Benelux Chapter, Tilbg. 2017:p-070.
10. Salomir R, Viallon M, Kickhefel A, et al. Reference-free PRFS MR-thermometry using near-harmonic 2-D reconstruction of the background phase. IEEE Trans Med Imaging. 2012. doi:10.1109/TMI.2011.2168421
11. Simonis FFJ, Petersen ET, Lagendijk JJW, Van Den Berg CAT. Feasibility of measuring thermoregulation during RF heating of the human calf muscle using MR based methods. Magn Reson Med. 2016;75(4):1743-1751. doi:10.1002/mrm.25710
Figures