1259
Relaxation Anisotropy in Biological Tissues1Research Unit of Medical Imaging, Physics and Technology, University of Oulu, Oulu, Finland, 2Department of Applied Physics, University of Eastern Finland, Kuopio, Finland, 3Medical Research Center, University of Oulu and Oulu University Hospital, Oulu, Finland, 4Department of Diagnostic Radiology, Oulu University Hospital, Oulu, Finland, 5A.I. Virtanen Institute for Molecular Sciences, University of Eastern Finland, Kuopio, Finland
Synopsis
Relaxation times of tissues can depend on tissue orientation with respect to main magnetic field. However, these effects are still unknown in many biological tissues. Relaxation anisotropy provides a base to develop novel quantitative MRI contrasts and unwrap the theory behind different relaxation mechanisms. We investigated relaxation anisotropy of conventional and rotating frame relaxation parameters in brain, spinal cord, tendon, cartilage, kidney and cardiac muscle tissue. The findings show that relaxation anisotropy varies between relaxation parameters and between different tissue types.
Introduction
Highly organized tissues, such as skeletal muscle1, tendon2,3, white matter4,5 and cartilage6, are reported to exhibit varying relaxation times when MRI measurements are conducted at different physical orientations with respect to the main magnetic field7–9. Previously, orientation dependence of multiple relaxation parameters, including T1, T2, continuous wave (CW-)T1ρ dispersion, adiabatic T1ρ and Relaxation Along Fictitious Field with rank n (RAFFn)10 have been investigated in cartilage11. In this study, we expand the investigation of relaxation anisotropy to several tissue types, known to contain different amounts of oriented tissue structures, including tendon, myocardium, kidney and brain tissue. Simultaneously, information on the more recently developed relaxation parameters and their variations between different tissue types are obtained.Methods
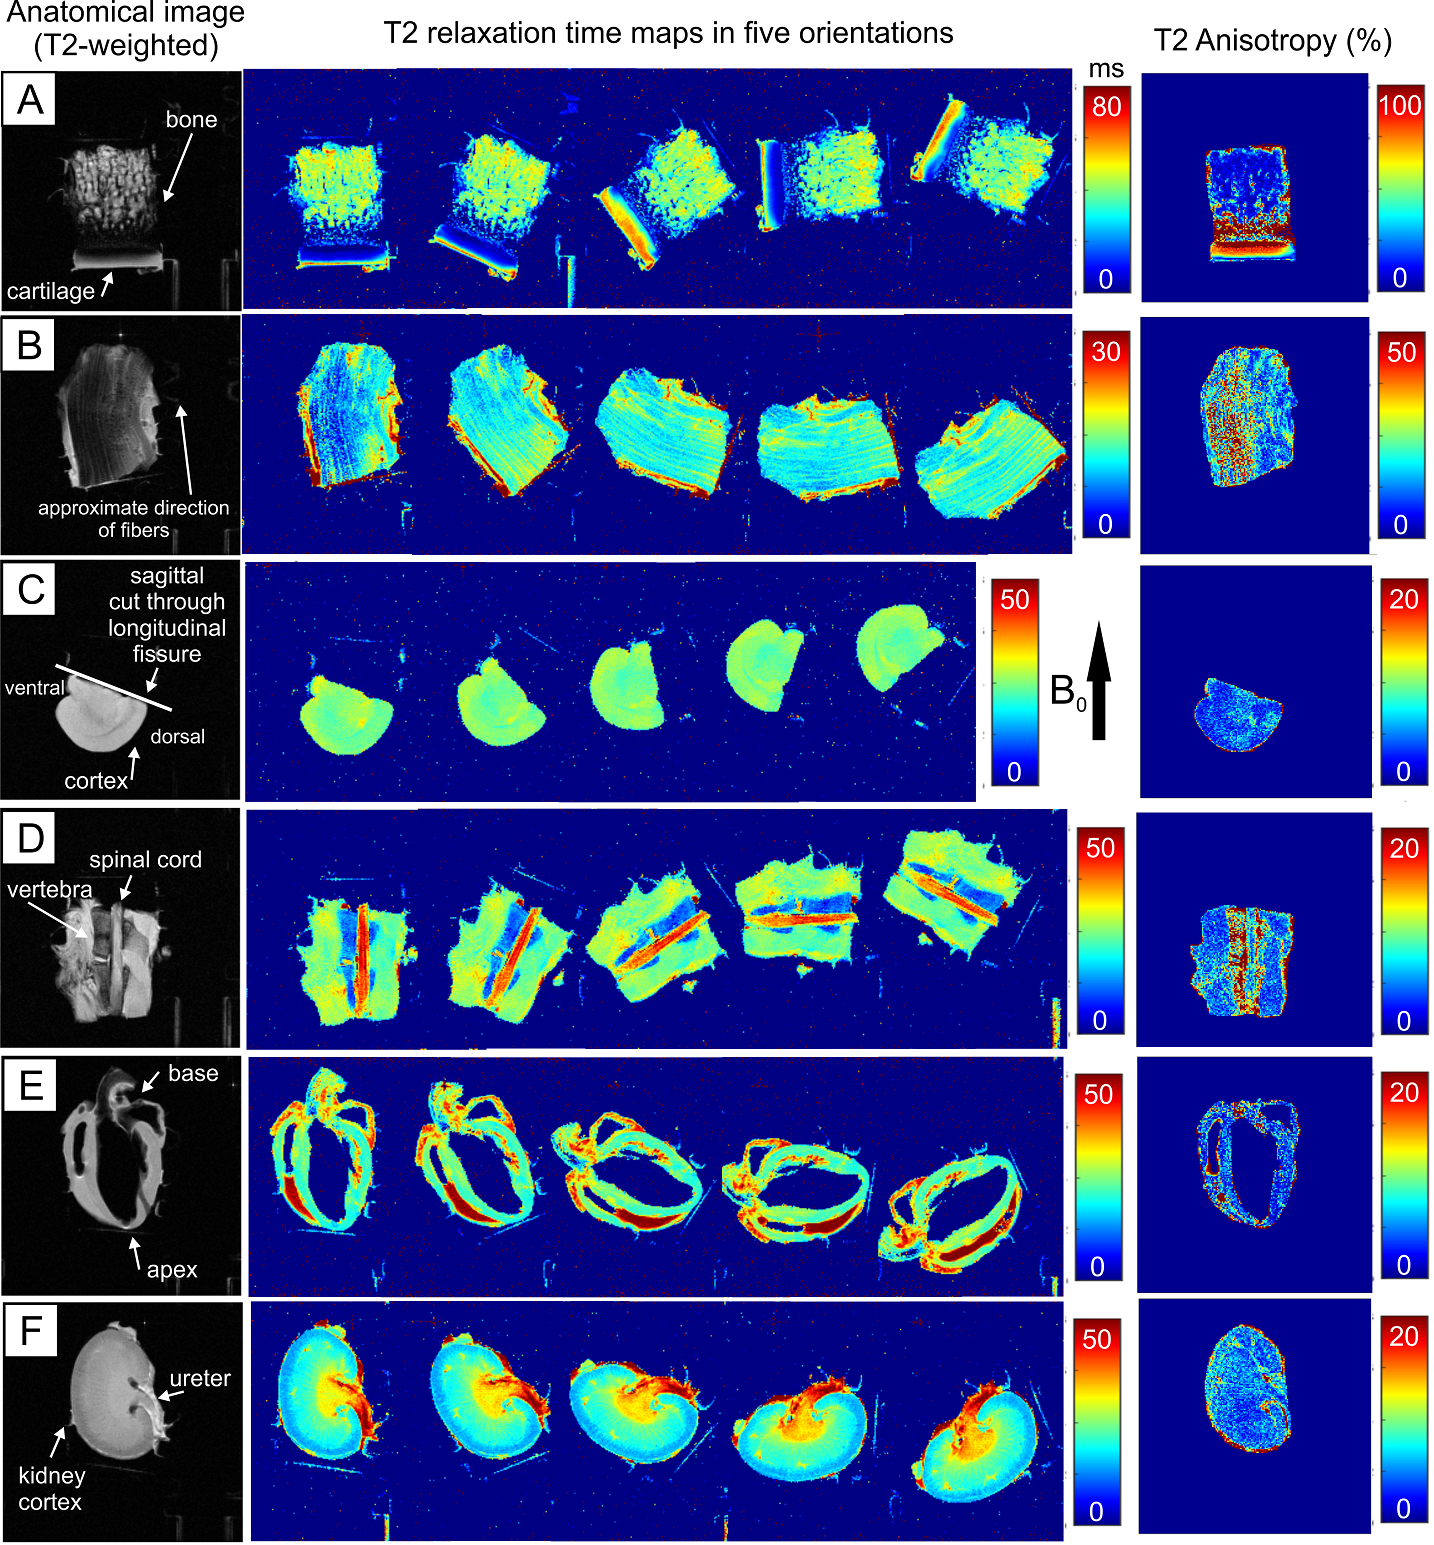
In this study, four mice were sacrificed in compliance with ethical permits (ESAVI-2020-006283), and were transcardially perfused and fixed with 4 % PFA. Heart, brain, kidney and a piece of spinal cord with the surrounding tissues were collected and stored in 4 % PFA before MRI measurements. Cartilage and tendon samples were collected from four bovine knees obtained from a local grocery store. For MRI measurements, the samples were immersed in perflouropolyether (Galden HS 240, Solvay Solexis, Italy) in a custom-built holder, which allowed rotation of the specimens with respect to the main magnetic field (B0) from outside the scanner.MRI was performed at 9.4 T using a 19 mm quadrature RF volume transceiver (RAPID Biomedical GmbH, Rimpar, Germany) and VnmrJ3.1 Varian/Agilent DirectDrive console. Relaxation time measurements were acquired using a global preparation block coupled to a single slice fast spin echo readout (ESP = 5.5ms, ETL = 8 with centric echo ordering). All measurements were obtained at five different sample orientations with respect to the main magnetic field B0, and they included: IR-T1 (TR = 7s, inversion time TI = 0.2, 0.5, 0.8, 1.1, 1.4 and 3s), MESE T2 (TR = 3s, ETL = 1, ESP = 20ms, TE = 7.4, 14.7, 22.1, 29.4, 36.8, 44.1, 51.5, 58.8, 66.2 and 73.6 ms), T1ρ measured during adiabatic pulses (TR = 5s, HS1, τp=4.5ms, and γB1,max/2π =2.5kHz, pulse trains of 0, 4, 8, 12, 24 and 36 pulses using MLEV4 phase cycling), continuous wave (CW-)T1ρ (TR = 5s, γB1/2π= 500 Hz, spin-lock durations of 0, 8, 16, 32, 64 and 128 ms) and RAFF2 (TR = 5s, trains of 0, 2, 4, 6 and 8 pulses acquired with and without an inversion preparation10,12).
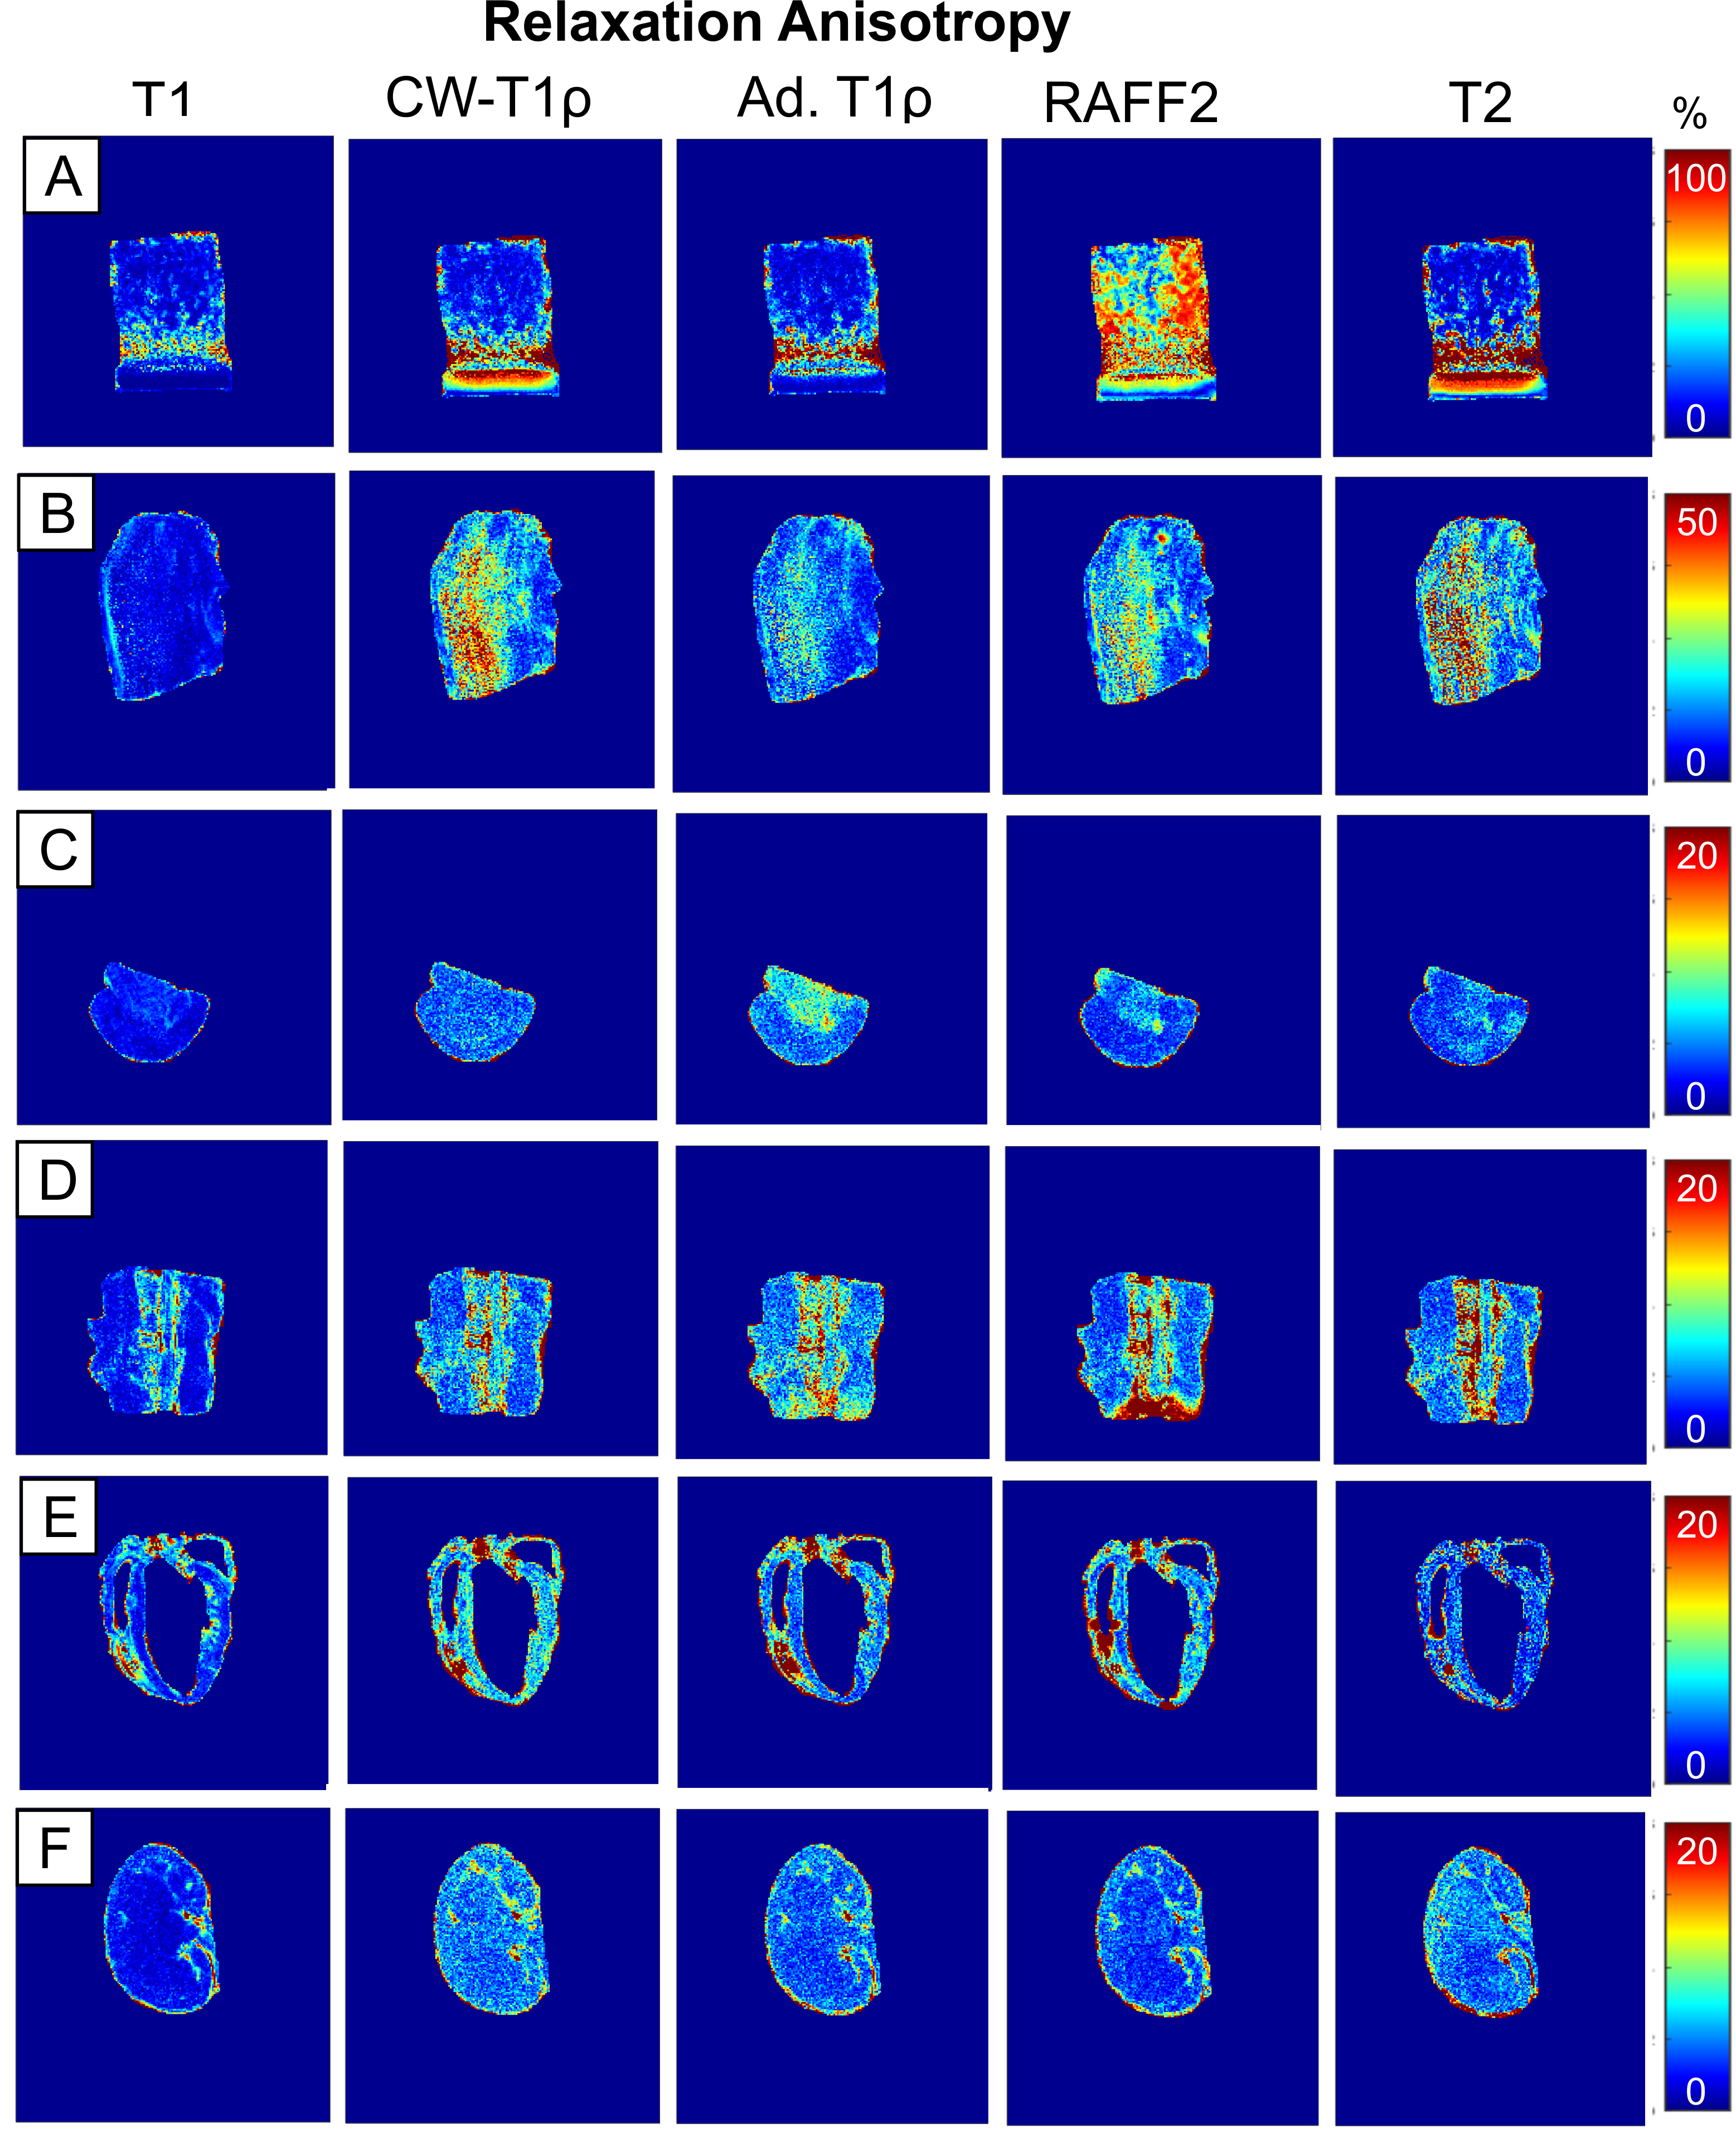
All the images were co-registered to the first orientation using Elastix software13 and the first echoes of the T2 data. Pixel-wise relaxation time maps were calculated using 2-parameter monoexponential fitting (and additionally steady state for RAFF12) with noise floor subtraction before fitting in Matlab (Matlab R2017b, Mathworks, Natick, MA, USA). Relaxation anisotropy was then computed pixel-wise as Michelson contrast as in the previous study11: (Rimax - Rimin)/(Rimax + Rimin), where Ri is the relaxation rate (1/Ti). Results were presented as anisotropy maps for each sample.
Results
The clearest anisotropic patterns were observed for T2 in cartilage and tendon samples (Figure 1). T2 relaxation anisotropy in cartilage was close to 80-90 % at maximum, depending on location. In tendon, maximum anisotropy ranged between 40 and 50 %, though low signal at the 0° orientation caused challenges in calculating T2 relaxation values. In cartilage and tendon, relaxation anisotropy was observed also for CW-T1ρ, adiabatic T1ρ and RAFF2 though the anisotropy was lower for them than for T2 (Figure 2). Other tissues i.e. brain, spinal cord, myocardium and kidney showed only mild variation in T2 relaxation values between different orientations, and this was true also for CW-T1ρ, adiabatic T1ρ and RAFF2. T1 did not exhibit relaxation anisotropy in any of the tissues.Discussion and conclusion
Relaxation anisotropy for T2, CW-T1ρ, adiabatic T1ρ and RAFF2 is most profound in cartilage and tendon, which are collagenous, highly ordered tissues11. Other investigated tissue types, brain, spinal cord, myocardium and kidney, demonstrated some relaxation anisotropy for these parameters. T1 showed practically no anisotropic behavior which was expected6,11.Typically, orientation dependent relaxation times in ordered tissue structures exhibit their largest values at magic angle (i.e. approximately 55° with respect to the main field)7, pointing towards dipolar interaction as a prevailing mechanism. Tissue orientations could, by chance, align symmetrically over the magic angle masking the anisotropy, hence multi-angle studies are needed to reveal orientation dependence. Results showed the expected orientation independence of T1 and orientation dependence of T2 in highly ordered tissues like cartilage. Interestingly, CW-T1ρ exhibited larger anisotropy values in tendon and myocardium than T2. Areas of anisotropy varied between CW-T1ρ, RAFF and adiabatic T1ρ in brain deep structures, which require further investigations. Sample fixation with PFA and sample storage may affect molecular structure of tissue and therefore the observed anisotropy.
In conclusion, relaxation anisotropy clearly varies between relaxation parameters and between tissue types.
Acknowledgements
Financial support from the Academy of Finland (grants #285909, #293970, #297033, and #319440), the Orion Research Foundation and Finnish Cultural Foundation are gratefully acknowledged. M. Pulkkinen is acknowledged for help with sample collection.References
1. Cleveland GG, Chang DC, Hazlewood CF, et al. Nuclear magnetic resonance measurement of skeletal muscle: anisotropy of the diffusion coefficient of the intracellular water. Biophys J. 1976;16(9):1043-53.
2. Fullerton G, Cameron I, Ord V. Orientation of tendons in the magnetic field and its effect on T2 relaxation times. Radiology. 1985;155(2):433-435.
3. Navon G, Eliav U, Demco DE, et al. Study of order and dynamic processes in tendon by NMR and MRI. J Magn Reson Imaging. 2007;25(2):362-380.
4. Bender B, Klose U. The in vivo influence of white matter fiber orientation towards B0 on T2* in the human brain. NMR Biomed. 2010;23(9):1071-1076.
5. Rudko DA, Klassen LM, de Chickera SN, et al. Origins of R2* orientation dependence in gray and white matter. Proc Natl Acad Sci U S A. 2014;111(1):E159-67.
6. Xia Y. Relaxation anisotropy in cartilage by NMR microscopy (µMRI) at 14-µm resolution. Magn Reson Med. 1998;39(6):941-949.
7. Erickson SJ, Prost RW, Timins ME. The “Magic Angle” Effect: Background Physics and Clinical Relevance. Radiology. 1993;188(1):23-25.
8. Lee J, van Gelderen P, Kuo LW, et al. T2*-based fiber orientation mapping. Neuroimage. 2011;57(1):225-234.
9. Nieminen MT, Nissi MJ, Hanni M, et al. Physical properties of cartilage by relaxation anisotropy. In: Xia Y, Momot KI, eds. Biophysics and Biochemistry of Cartilage by NMR and MRI. Cambridge: Royal Society of Chemistry; 2017:147-175.
10. Liimatainen T, Hakkarainen H, Mangia S, et al. MRI contrasts in high rank rotating frames. Magn Reson Med. 2015;73(1):254-262.
11. Hänninen N, Rautiainen J, Rieppo L, et al. Orientation anisotropy of quantitative MRI relaxation parameters in ordered tissue. Sci Rep. 2017;7(1):9606.
12. Liimatainen T, Sorce DJ, O’Connell R, et al. MRI contrast from relaxation along a fictitious field (RAFF). Magn Reson Med. 2010;64(4):983-994.
13. Klein S, Staring M, Murphy K, et al. Elastix: A toolbox for intensity-based medical image registration. IEEE Trans Med Imaging. 2010.
Figures