1258
Theoretical evaluation of the feasibility to detect label-exchange by proton MRS at 7T in human brain after administration of deuterated glucose.1Department of Radiology and Biomedical Research, University of Bern, Bern, Switzerland, 2Department of Diabetes, Endocrinology, Nutritional Medicine and Metabolism, Inselspital, Bern University Hospital and University of Bern, Bern, CH, Bern, Switzerland, 3Institute of Diagnostic and Interventional Neuroradiology, Inselspital, Bern University Hospital and University of Bern, Bern, CH, Bern, Switzerland
Synopsis
This study aims to analyze the feasibility of indirect detection by 1H MRS of cerebral metabolism following intake of deuterated glucose in humans on a clinical 7T system. Brain spectra before and after [6,6’-2H2]-glucose administration were simulated with realistic SNR and linewidth to evaluate the best achievable precision in quantifying specific deuterated and non-deuterated metabolites. We expect labeling of glutamate, lactate and glutamine to be observable from single spectra of large VOIs, but also in MRSI at resolutions of 2-5 cm3. The simulations were corroborated with phantom data but eventual feasibility will remain to be confirmed in vivo.
Introduction
The recent documentation of the feasibility and potential of using deuterated compounds to study metabolism non-invasively by MR spectroscopic imaging (MRSI) in animals1 and humans2 has spurred a lot of interest. In particular, the prospect to readily map tumor-specific metabolism has great potential. However, the use of 2H has drawbacks. Deuterons‘ low sensitivity (though partially compensated by short T1s) is one, while the need for x-nuclear scanner capability may be even more hindering, particularly because use of 2H is not established on clinical scanners. Rich et al.3 have proposed to resort to combining administration of deuterated agents with the observation of its indirect effects on the pools of protonated metabolites by 1H-MRS to document the replacement of protons by deuterons. So far, this has only been shown in anesthetized rats at 9.4 T. The aim of our study is to evaluate the feasibility of this technique for human application on a clinical 7T MR system. Our theoretical evaluation is based on a best-case scenario using a series of simulated brain spectra with realistic SNR4 and linewidth5 to investigate the best achievable precision in quantifying specific brain metabolites of interest in protonated and deuterated forms as expected after an oral load with doubly deuterated glucose as administered in the earlier 2H MRSI studies. Cramer Rao Lower Bounds (CRB) are used to reflect the best achievable precision in a series of measurements to evaluate the label exchange for glucose (Glc), glutamate (Glu), glutamine (Gln) and lactate (Lac).Methods
- Spectra simulated in NMRSCOPE-B6 for a semiLaser sequence at 7 T (TE 35 ms, spectral width 4 kHz, 4096 points). Spin system parameters taken from Govindaraju et al.7 with couplings to/between deuterons scaled by the gyromagnetic constant ratios and neglecting any isotope effect on chemical shifts. T1-relaxation effects on couplings found to be negligible for relaxation times >10 ms.
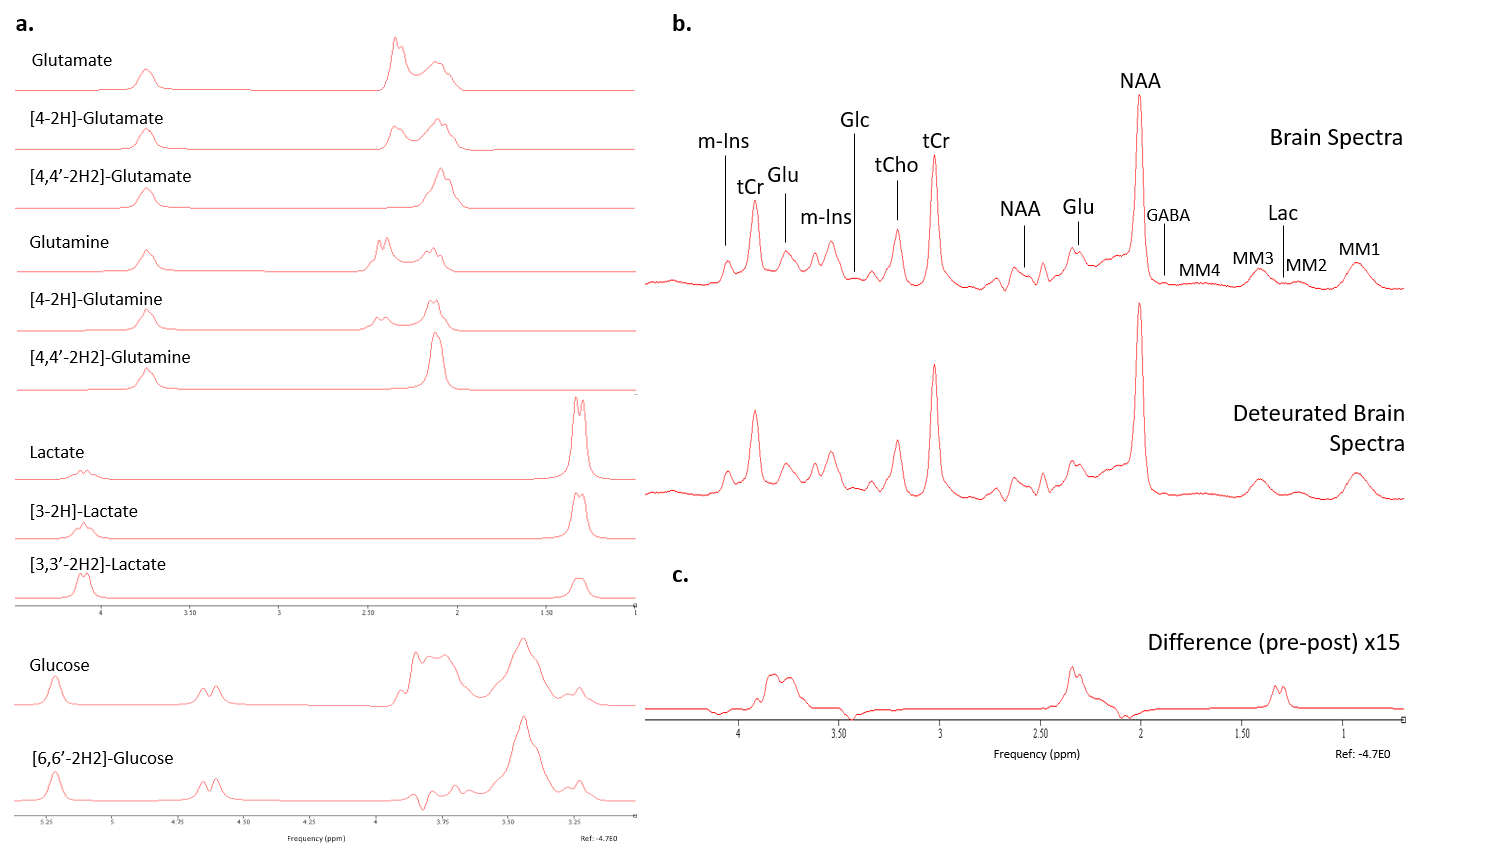
- Brain spectra simulated with Voigt shape to resemble spectra acquired in 5 min from 20 cm3 occipital gray matter: Gaussian (3.2 Hz) and Lorentzian (10.2 Hz) width, frequency domain SNR of 300 for creatine4. 19 normal metabolites and a macromolecular background8 plus deuterated counterparts simulated as listed in Fig-1 and Table-1, where spectra and expected differences upon deuteration are presented. 8 Spectra as expected before and 45 min after 2H glucose load (concentrations as expected from Rich et al.3) simulated and fitted.
- Spectral fitting and calculation of CRB using FitAID9 with prior knowledge constraints to stabilize the fit (common shift, widths, phase).
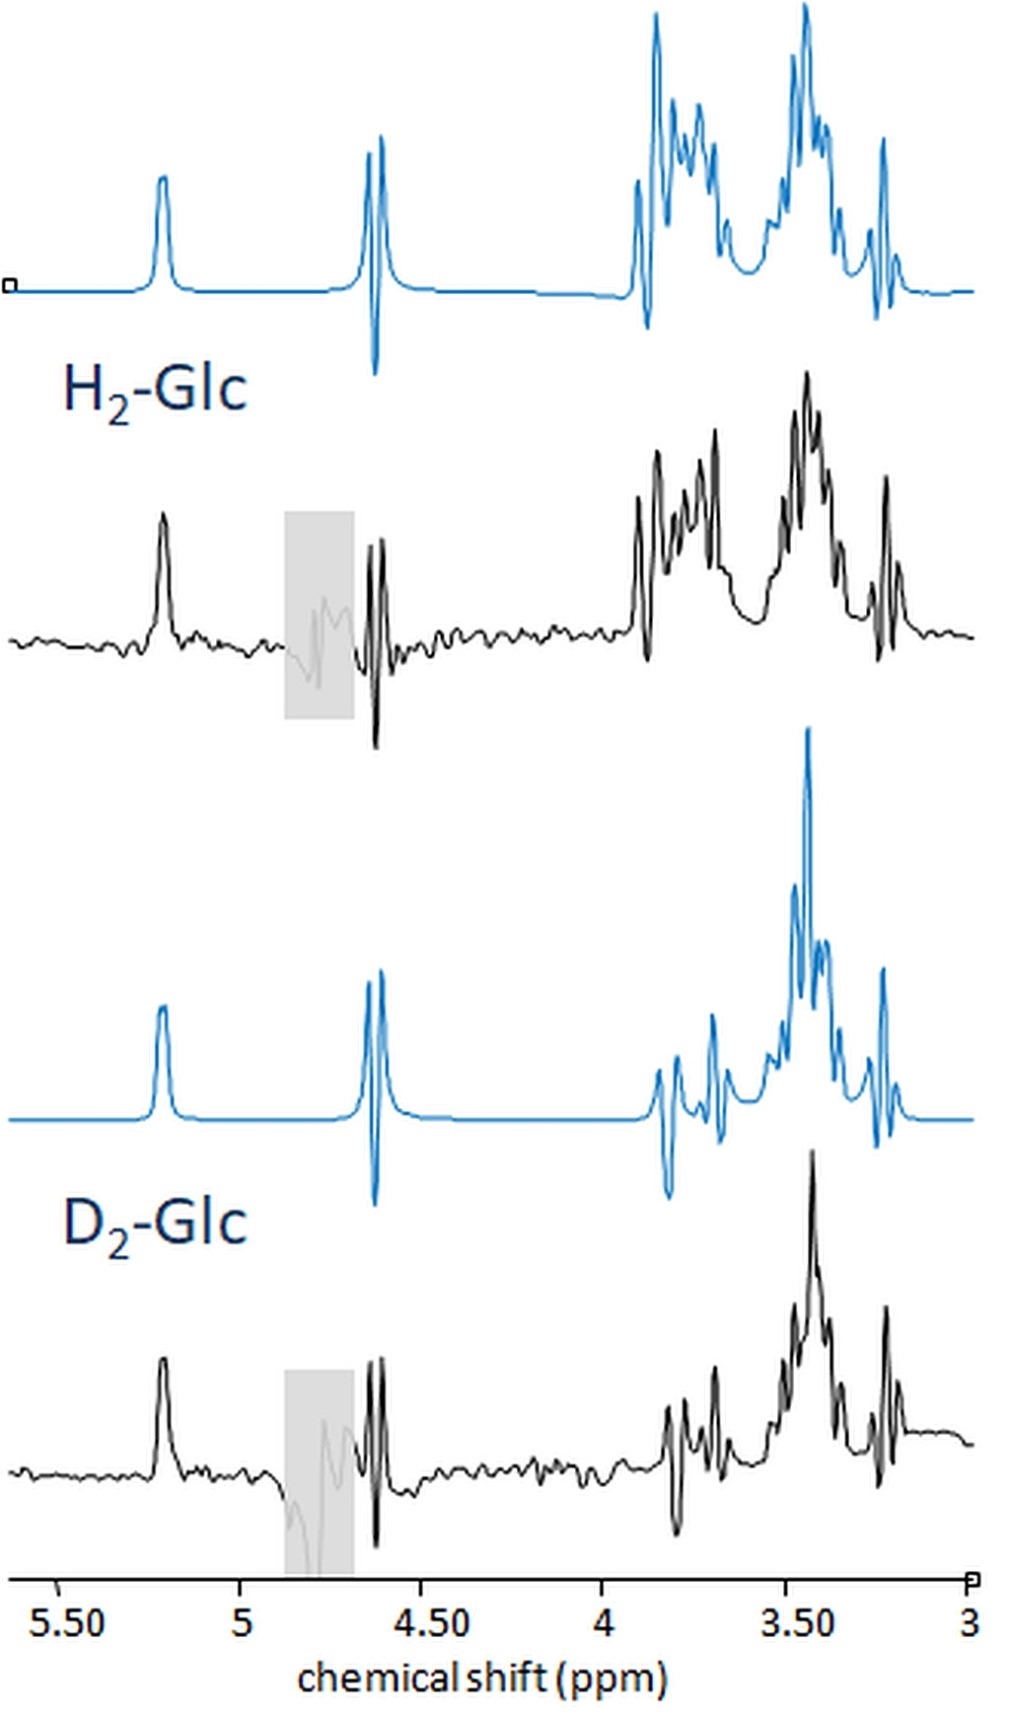
- Spectra of phantom solutions of non- and bi-deuterated glucose (25 mM, pH 7.05) measured with semiLaser (TR 8s, TE 35ms, VAPOR WS, optimized excitation and WS flip angle) at 7T (Terra, Siemens) to verify simulations.
Results and discussion
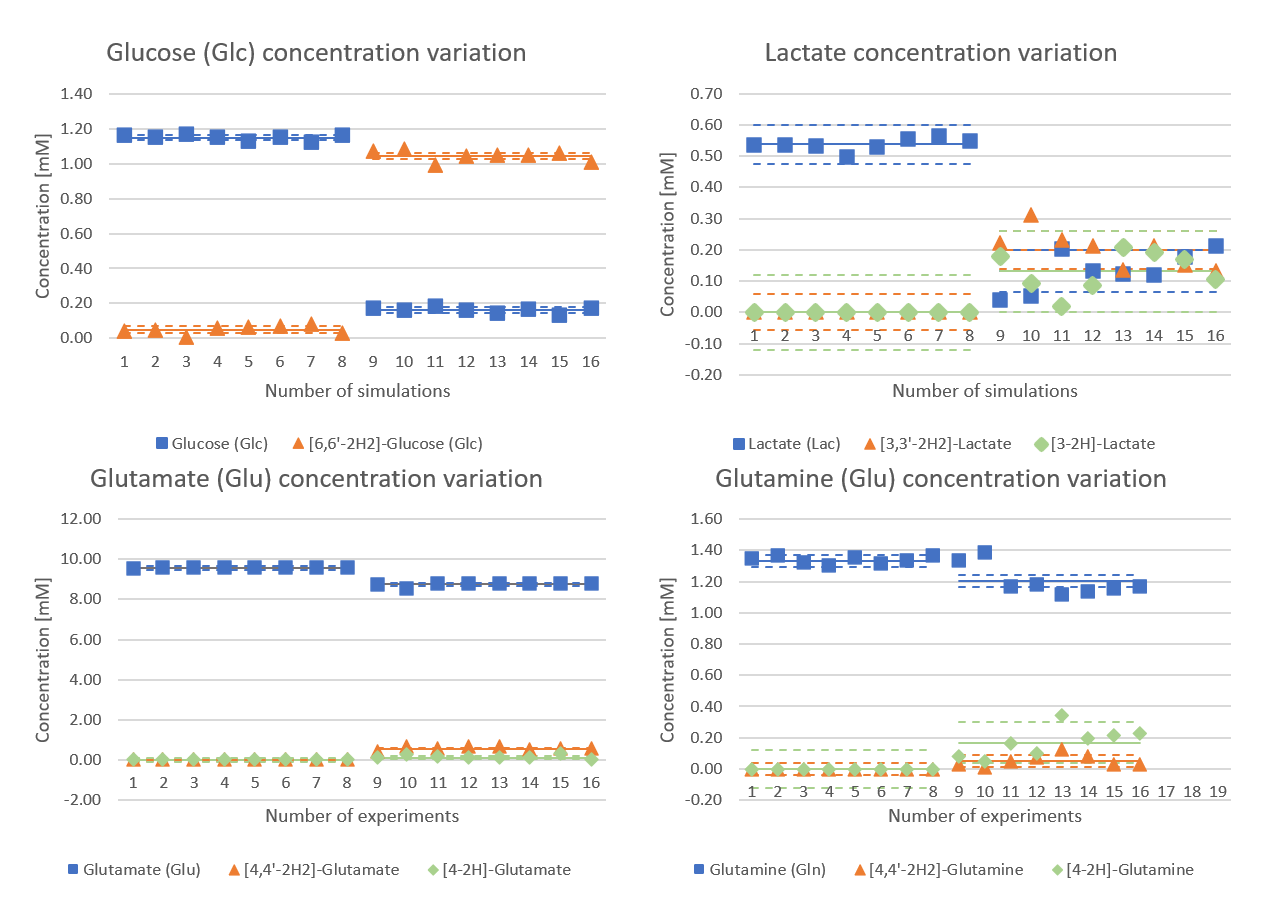
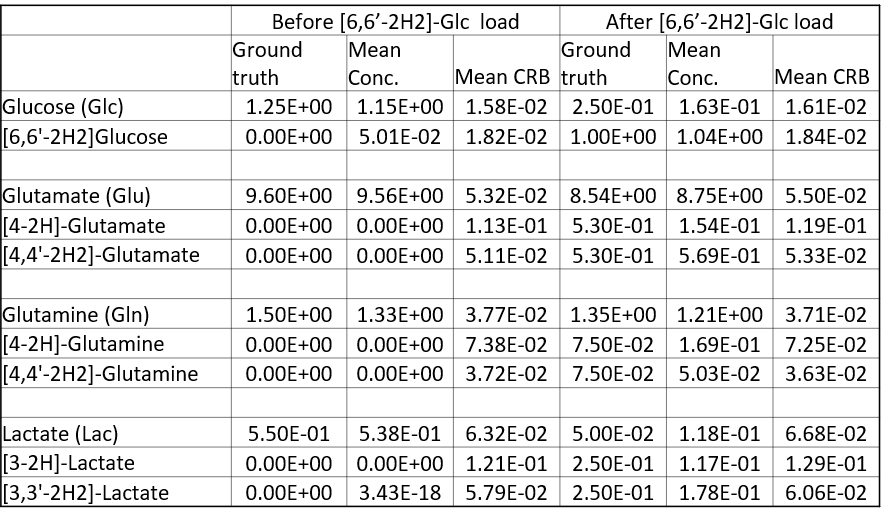
Fig-1a showcases simulated spectra for the implicated metabolites and their mono- and doubly-deuterated versions. From these basis spectra, the expected brain spectra and their changes with effect size estimated from literature were synthesized at expected in vivo SNR and shim (Fig-1b). To validate the simulations including couplings to spin-1 nuclei, phantom spectra of Glc were measured. Fig-2 compares simulated and measured spectra of [6,6’-2H2]-Glc and [6,6’-1H2]-Glc at high resolution, showing that the simulated spectra do not perfectly match the measurements (details of pulse sequence not identical, spin-system parameters possibly slightly inaccurate, D2O-solution spectra in Ref. 7), but that the main features are caught by the simulations (especially when apodized to in-vivo conditions) providing confidence in the validity of the CRB-related precision estimates. Fig-3 presents results from a potential measurement series of 8 spectra (total 38 min) before and after [6,6’-2H2]-Glc load if repeatability were not compromised by other factors than CRB, probably a valid approximation for time series on a single steady subject without repositioning and recalibrations, but overoptimistic for patients and with repositioning. Table-1 includes the mean fitting results and the CRB values for both measurements and all implicated metabolites. In the optimal case, CRBs (smaller than effect size for most metabolites) promise that the small changes in deuteration expected for Glu (and possibly even Gln and Lac with small total concentration at steady state) should be detectable in single spectra, a time course of spectra, or a subject cohort. Since CRB essentially scale with the inverse of the VOI-size (for identical linewidth) it can be speculated that changes in Glu can be detected with MRSI at a resolution down to 2-5cm3 in about 10min scan time at 7T.Conclusions
Indirect detection of cerebral metabolic changes as a consequence of label exchange between protons and deuterons after ingestion of deuterated glucose appears to be feasible for humans investigated at 7T. In a best-case scenario where repeatability is limited by fitting inaccuracy labeling of glutamate, lactate and glutamine should be observable from single spectra of a large VOI, but also in MRSI at nominal resolutions of 2-5 cm3. Even with more realistic additional variance expected for a series of in vivo spectra this approach remains promising. Interpretation of indirect observation of label-exchange is however of course limited by assumptions on stability or changes in total pool size, while direct observation of 2H signals is not. Ideally, the two measurements should be combined.Acknowledgements
This is project is supported by the Swiss National Science Foundation (PCEGP3_186978) and Diabetes Center Bern.References
1. Lu M, Zhu XH, Zhang Y, Mateescu G, et al. Quantitative assessment of brain glucose metabolic rates using in vivo deuterium magnetic resonance spectroscopy. J Cereb Blood Flow Metab. 2017 Nov;37(11):3518-3530. doi: 10.1177/0271678X17706444.
2. De Feyter HM, Behar KL, Corbin ZA, et al. Deuterium metabolic imaging (DMI) for MRI-based 3D mapping of metabolism in vivo. Sci Adv. 2018;4(8):eaat7314. Published 2018 Aug 22. doi:10.1126/sciadv.aat7314.
3. Rich LJ, Bagga P, Wilson NE, et al. 1H magnetic resonance spectroscopy of 2H-to-1H exchange quantifies the dynamics of cellular metabolism in vivo. Nat Biomed Eng. 2020 Mar;4(3):335-342. doi: 10.1038/s41551-019-0499-8.
4. Marjańska M, Auerbach EJ, Valabrègue R, et al. Localized 1H NMR spectroscopy in different regions of human brain in vivo at 7 T: T2 relaxation times and concentrations of cerebral metabolites. NMR Biomed. 2012;25(2):332-339. doi:10.1002/nbm.1754
5. Juchem C, Cudalbu C, de Graaf RA, et al. B0 shimming for in vivo magnetic resonance spectroscopy: Experts' consensus recommendations. NMR Biomed. 2020 Jun 28:e4350. doi: 10.1002/nbm.4350.
6. Starčuk Z Jr, Starčuková J. Quantum-mechanical simulations for in vivo MR spectroscopy: Principles and possibilities demonstrated with the program NMRScopeB. Anal Biochem. 2017 Jul 15;529:79-97. doi: 10.1016/j.ab.2016.10.007.
7. Govindaraju V, Young K, Maudsley AA. Proton NMR chemical shifts and coupling constants for brain metabolites. NMR Biomed. 2000 May;13(3):129-53. doi: 10.1002/1099-1492(200005)13:3<129::aid-nbm619>3.0.co;2-v. Erratum in: NMR Biomed. 2015 Jul;28(7):923-4. PMID: 10861994.
8. Pfeuffer J, Juchem C, Merkle H, et al. High-field localized 1H NMR spectroscopy in the anesthetized and in the awake monkey. Magnetic Resonance Imaging, Volume 22, Issue 10, 2004, Pages 1361-1372, ISSN 0730-725X. https://doi.org/10.1016/j.mri.2004.10.002.
9. Chong DG, Kreis R, Bolliger CS, et al. Two-dimensional linear-combination model fitting of magnetic resonance spectra to define the macromolecule baseline using FiTAID, a Fitting Tool for Arrays of Interrelated Datasets. MAGMA. 2011 Jun;24(3):147-64. doi: 10.1007/s10334-011-0246-y.
Figures