1254
EPR measurements on human brain tissue at variable temperature1Physics Department, University of São Paulo, Ribeirão Preto, Brazil, 2Physics Institute, University of São Paulo, São Carlos, Brazil, 3Medical School, University of São Paulo, São Paulo, Brazil
Synopsis
On this work it was evaluated the EPR measurements at variable temperature on tissue samples from different brain regions. For all samples, four different peaks were observed and their relationship with temperature were analyzed. High-spin rhombic iron(g = 4.3), copper(g = 2.06, g = 2.28) and organic radical (g = 1.989) peaks showed a Curie behavior with antiferromagnetic contributions. By other hand, a broad peak centered at g = 2.0 showed an antiferromagnetic behavior with Curie contribution. Additionally, a fifth peak was observed only for the Locus Coeruleus sample with a temperature dependent g-value (3.62 - 2.55).
Introduction
Study of iron content in human brain tissue has gained a lot of attention over the years, supported by the observed relationship between iron accumulation and neurodegenerative diseases. A full understanding of paramagnetic species present in the human brain tissue is still needed. On this work, an Electron Paramagnetic Resonance (EPR) analysis of brain tissue with variable temperature is presented for three samples from one post-mortem subject.Methods:
This study was approved by the ethical committee in research of the Medical School of the University of São Paulo (FMUSP). Fixed brain tissue samples from a post-mortem subject (959 days after death) without neurological or neurodegenerative diseases were acquired at the FMUSP. Samples from Substantia Nigra (SN), Globus Pallidus (GP) and Locus Coeruleus (LC) were frozen-dried and turned into pellets.EPR data were acquired in a temperature range from 5K to 293K using a X-Band spectrometer (9.11 GHz). Following acquisition parameters were used: sweep range 25 - 675mT, microwave power 0.5mW, sweep time of 120s, modulation frequency of 100kHz, modulation amplitude of 0.8mT, and 4 reads per sample (8 reads for LC sample). Recorded spectra were normalized by dry mass and processed/simulated using OriginLab 8.5/EasySpin toolbox (Matlab).
All spectra were baseline corrected with a 5th order polynomial function considering points at the beggining and ending of each spectra. Each observed peak were fitted individualized in order to obtain a better fit. Then, the 2nd integral and peak-to-peak linewidth were estimated and plotted as a function of temperature.
Results/Discussion:
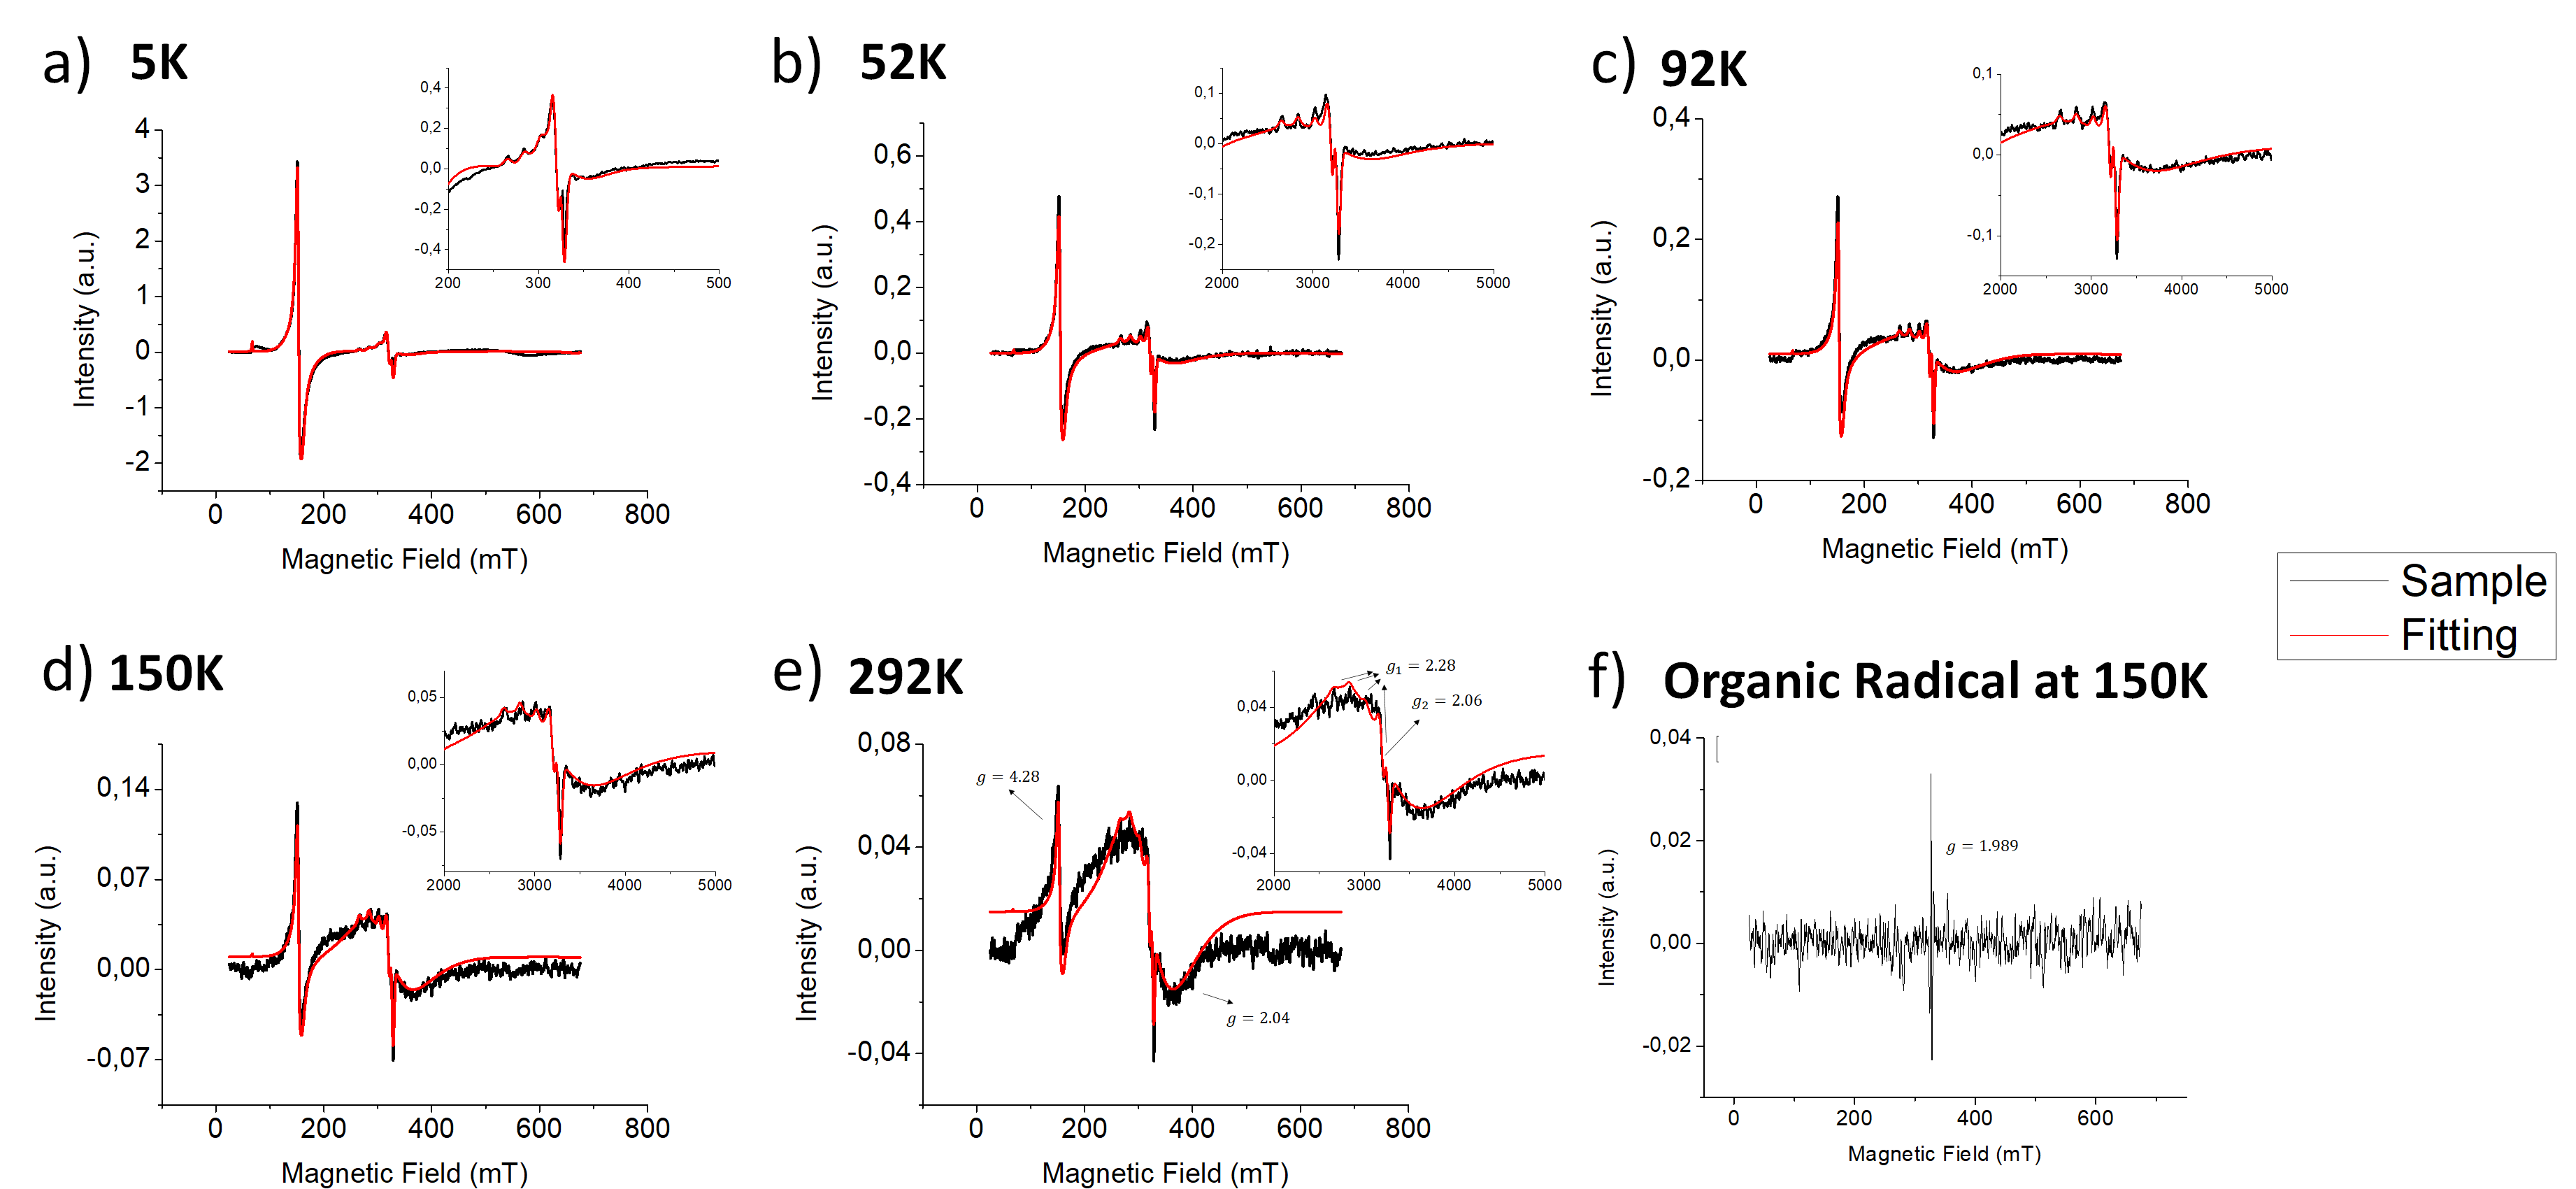
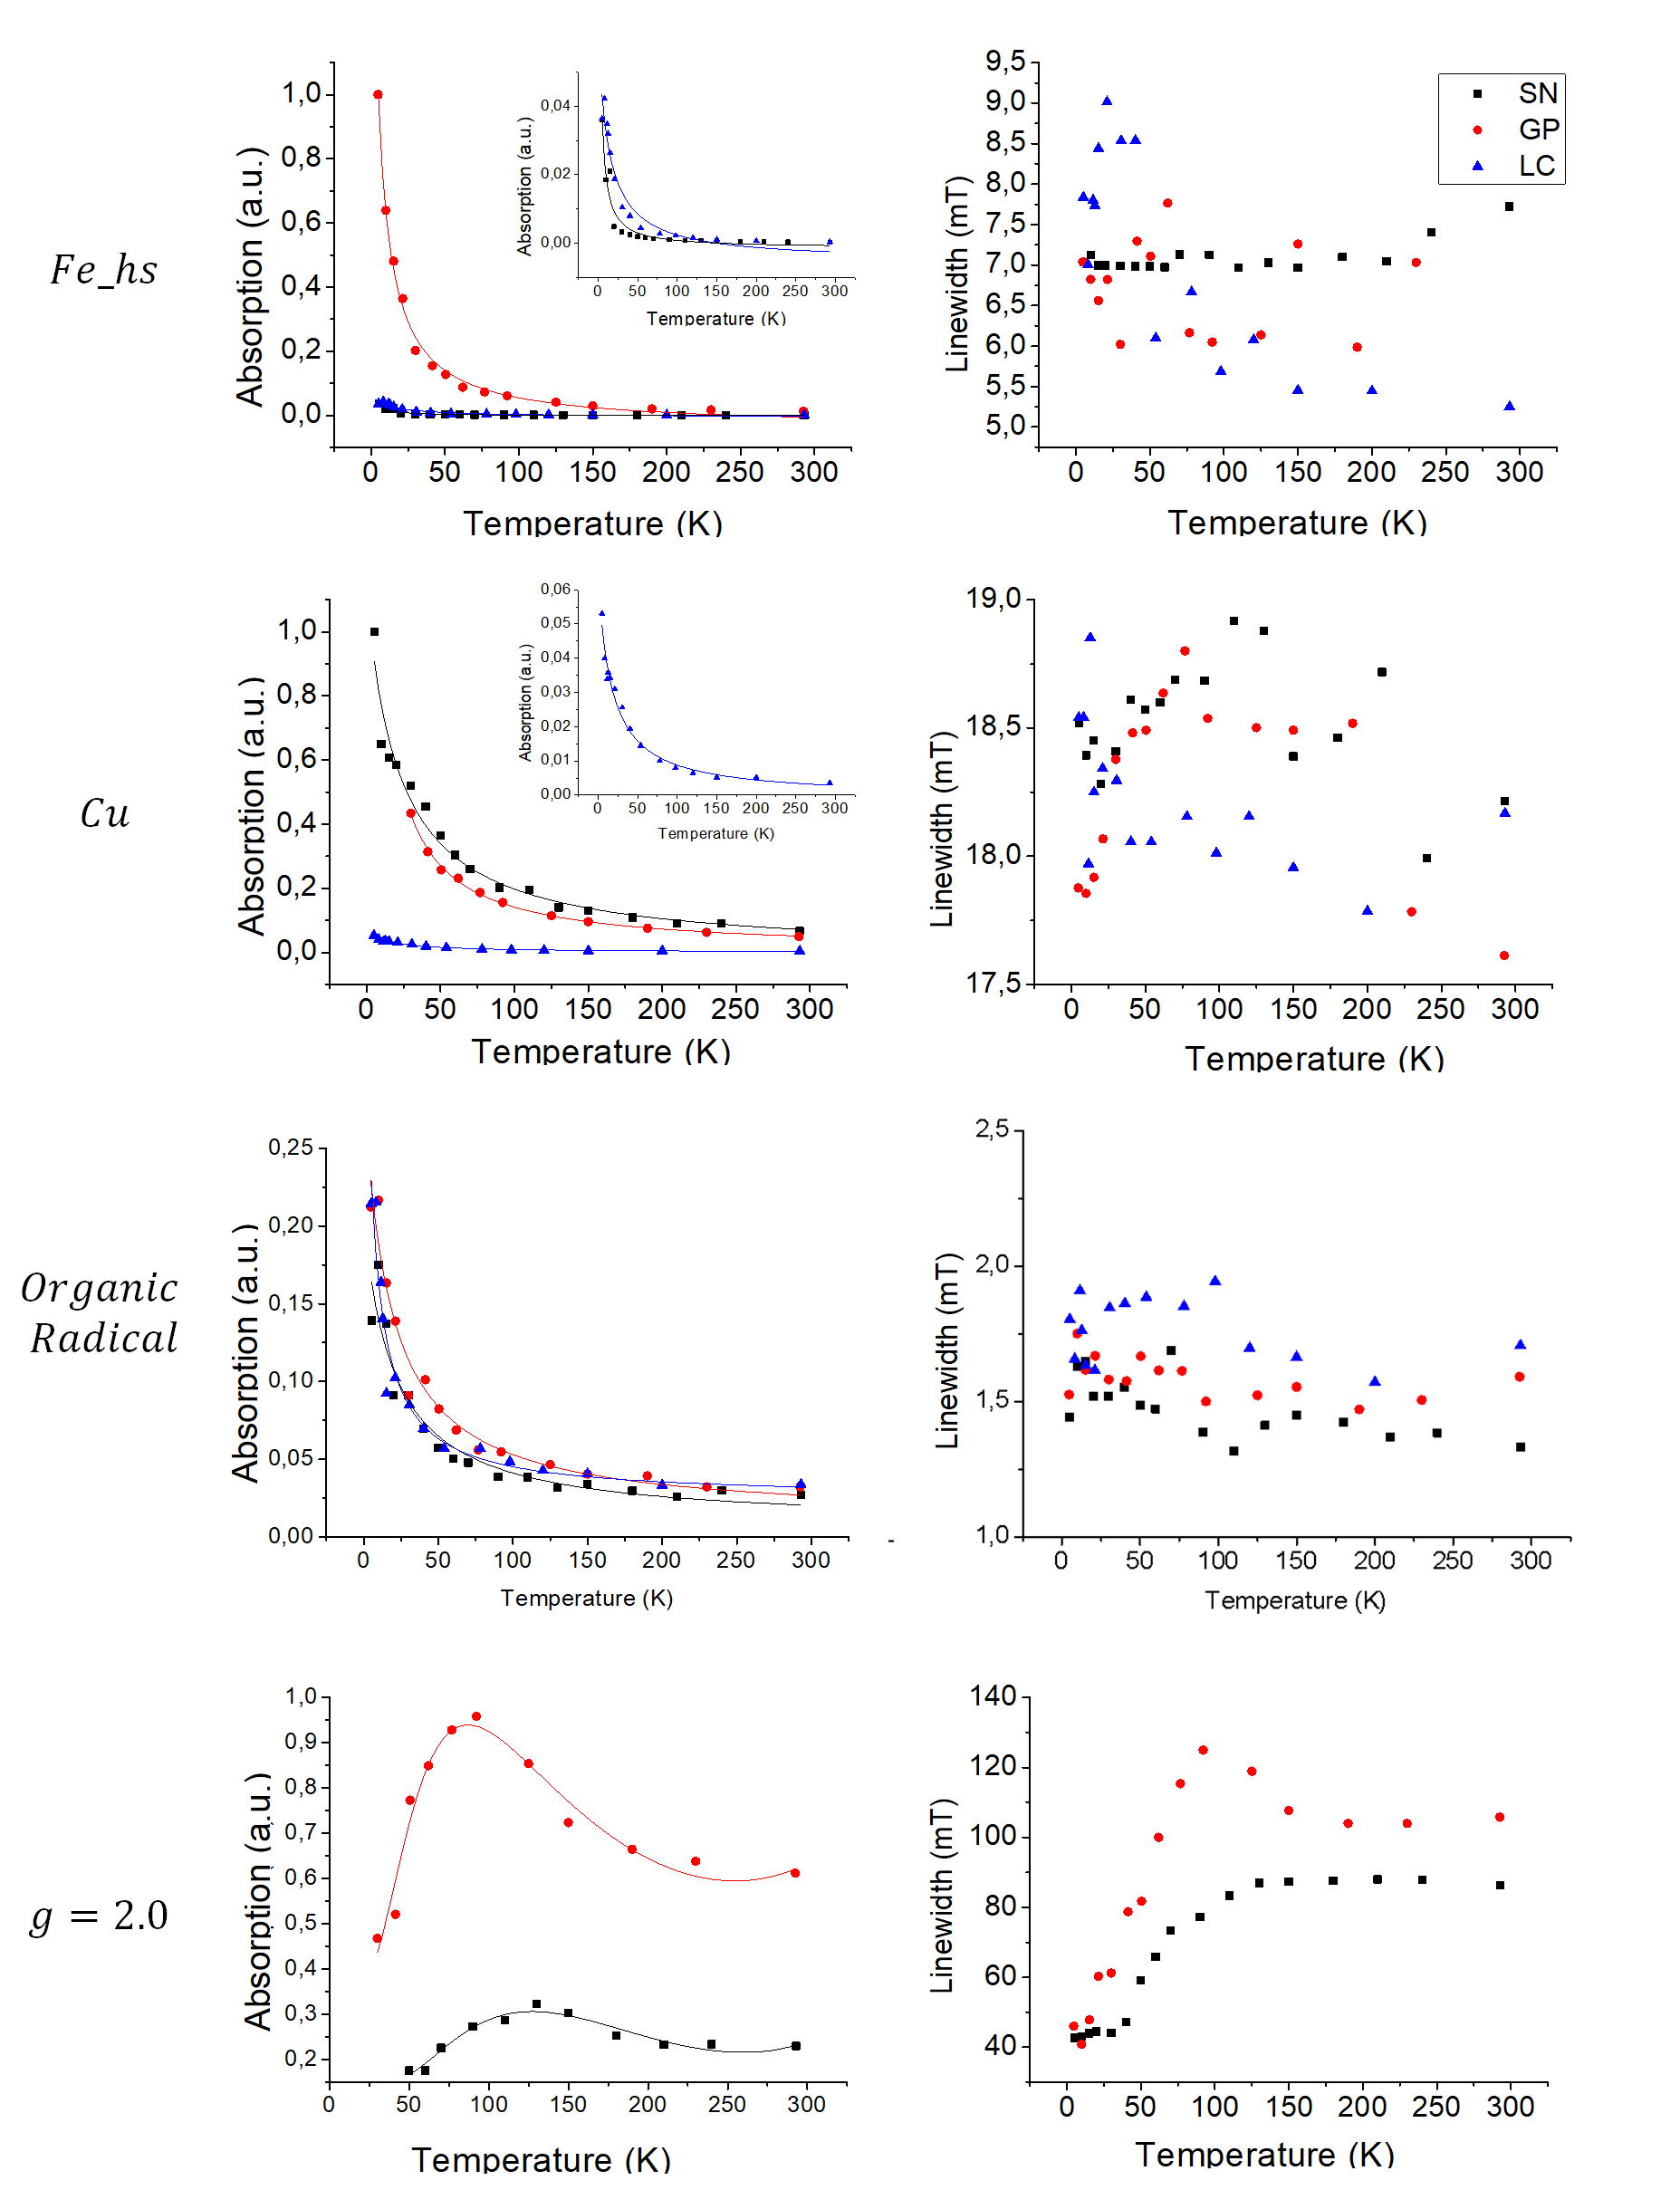
Four main peaks were observed for all the samples: high-spin iron (Fe_hs) at g = 4.28, copper (Cu) at g1 = 2.06 and g2 = 2.28, a broader peak at g = 2.0 [2] and a straight peak at g = 1.989. Figure 1.a-e shows the fitted spectra at different temperatures for the GP sample where it can be seen the Fe_hs, Cu and broad peak at g = 2.0. The organic radical peak (Figure 1.f) was obtained after subtraction of other peaks from spectra, no fitting was made for this peak since both the 2nd integral and peak-to-peak linewidth could be easily estimated from the raw spectra.Fe_hs and Cu peaks showed a Curie-Weiss behavior with an antiferromagnetic contribution (Figure 2.a-d), which could indicate that these paramagnetic ions are placed near some antiferromagnetic structure.
The broad g = 2.0 peak seems to have contributions from different magnetic species, exhibiting a superparamagnetic and antiferromagnetic behavior, as shown by the Van-Vleck paramagnetism fitting (Figure 2.g-h). This peak is commonly attributed to ferrihydrite nucleated inside ferritin [2], this is supported by the fact that ferrihydrite is antiferromagnetic [4] and that the ferritin cores contains different iron minerals [3].
The organic radical at g = 1.989 presented a g-value lower than that expected for free radicals (g = 2.03), which indicates that this organic radical is rather bound to some metal. Also, it also presented a Curie behavior with antiferromagnetic contribution (Figure2.e-f), which also indicates that this radical is rather bound to another ion. This could be related to neuromelanin, but it is important noting that during the lyophilization many other radicals are formed within the sample, therefore other studies must be done in order to evaluate it properly.
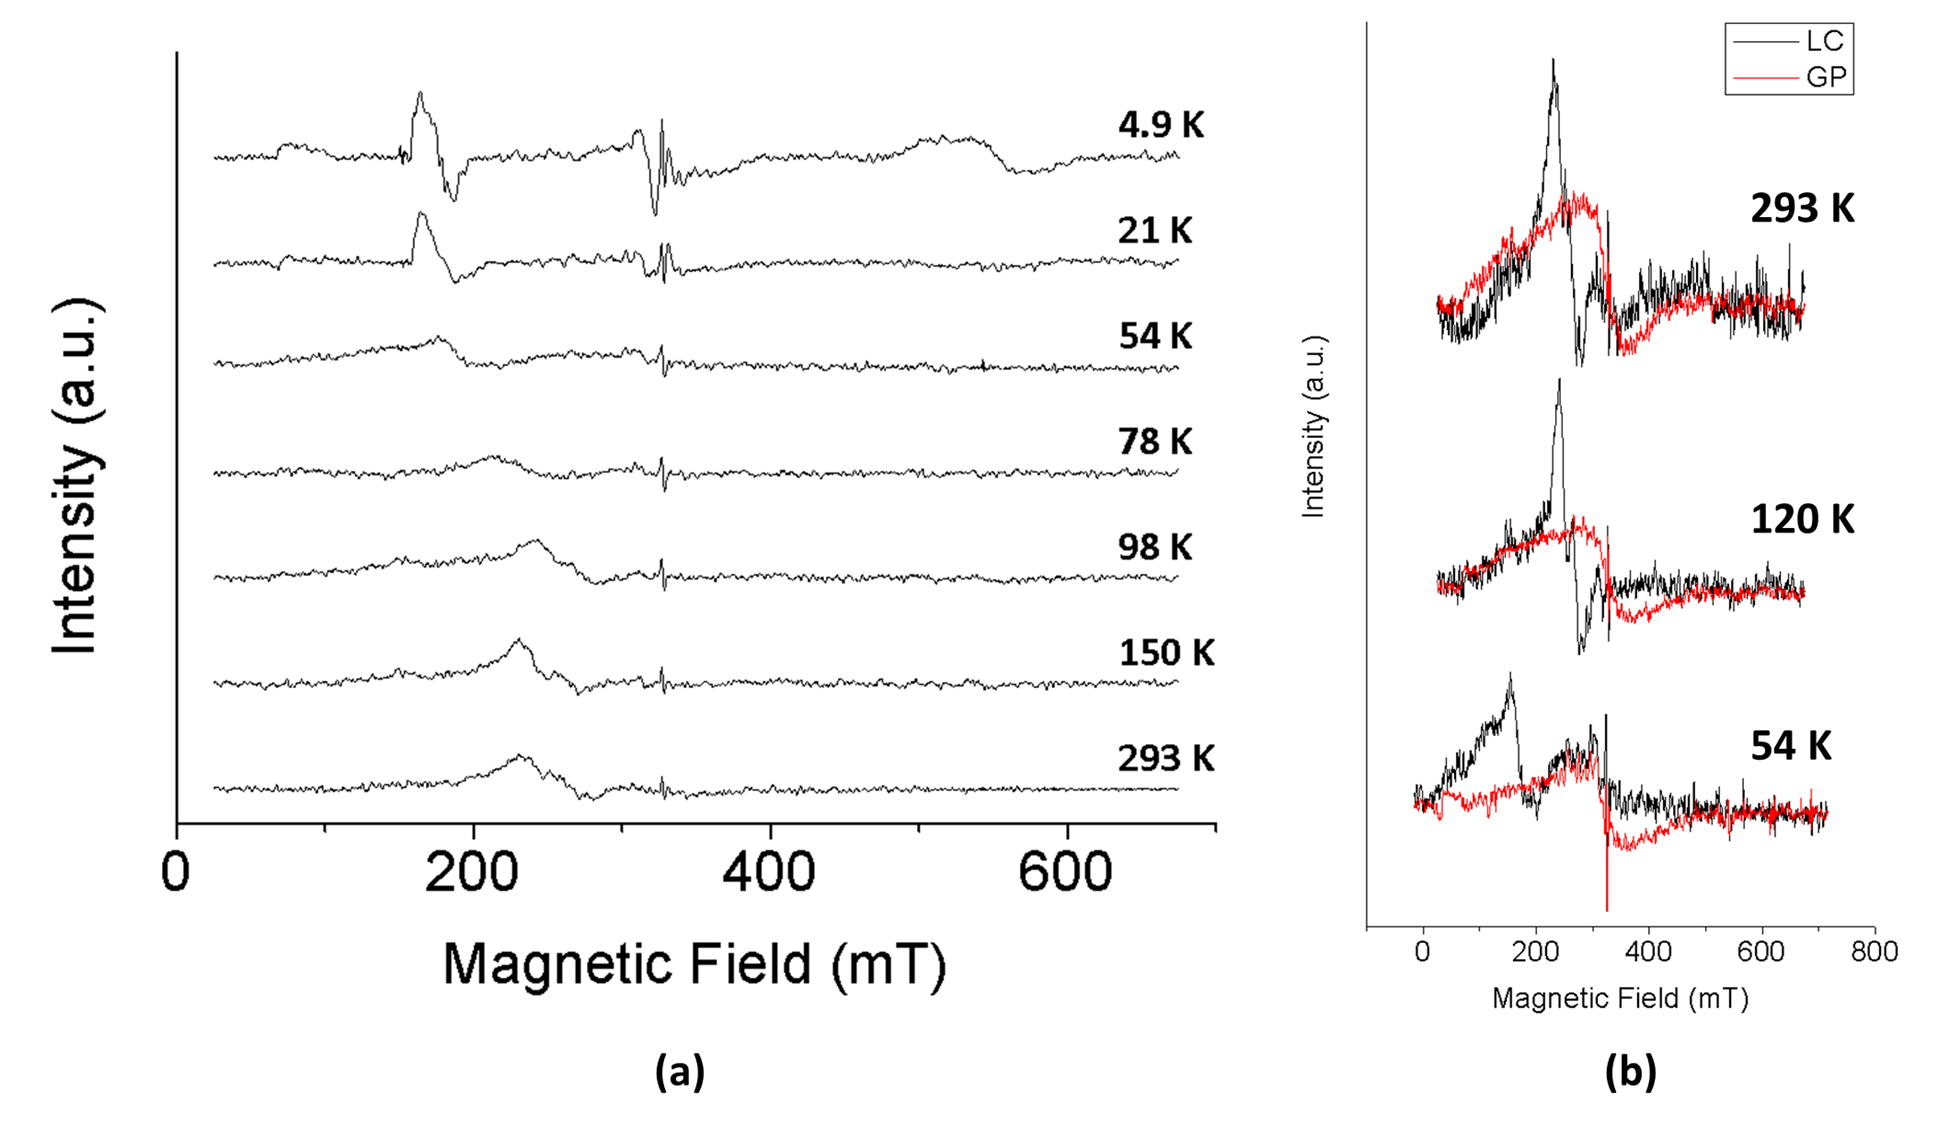
Also, in LC sample, additional peaks around 190mT at T<70K and 260mT at T>70K made it difficult to obtain a good fitting of the broad g = 2.0 peak (Figure 3-a). As observed, these peaks are not the same as the one found in GP and SN for the broad g = 2.0 peak (Figure 3-b), suggesting that it could be related to another paramagnetic ion.
Finally, further EPR studies involving other brain regions and subjects must be done in order to confirm our findings. Also, more recent studies at variable temperature using isolated ferritin should help to clarify the temperature dependence of the broad peak at g = 2.0.
Acknowledgements
For their finatial support, National Council for Scientific and Technological Development (CNPq) and National Council for the Improvement of Higher Education (CAPES).References
[1] Aime S, et al. Bioc et Biop Acta (1361), 1997.
[2] Weir M, et al. Bioc et Biop Acta (828), 1985.
[3] Galvez N, et al. JACS (130), 2008.
[4] Kumar P., et al. Sci Rep, 2016.
Figures