1253
High neuromelanin contrast achieved using sandwiched flow saturation RF pulses: sandwich-fsNM imaging1Department of Electrical and Computer Engineering, Seoul National University, Seoul, Korea, Republic of, 2Department of Radiology, Gachon University Gil Medical Center, Incheon, Korea, Republic of, 3Department of Neurology, Gachon University Gil Medical Center, Incheon, Korea, Republic of
Synopsis
A neuromelanin-sensitive imaging protocol based on a GRE sequence, sandwich-fsNM, is developed using multiple flow saturation pulses instead of MT pulses. The flow saturation pulses are located both superior and inferior to the imaging volume, like a sandwich, to avoid asymmetric MT across slices. The proposed protocol yields higher contrast between crus cerebri and substantia nigra and better visualizes locus coeruleus, compared to MT prepared GRE or TSE sequences.
Introduction
Neuromelanin (NM)-sensitive MRI is a promising method for Parkinson’s disease1–3. Recently, MT-prepared GRE was shown to provide good NM contrast4–6. While an MT pulse is available in all vendors, the parameters that govern MT efficiency (e.g. FA, offset-frequency) are different and are not flexible. In this study, we propose a new NM-sensitive imaging protocol, sandwich-fsNM, that utilizes multiple flow saturation (FS) RF pulses for MT weighting. The FS pulses, which are flexible (number of pulses and offset-frequency), are located both superior and inferior to imaging volume, avoiding asymmetric MT effects. We demonstrate the effectiveness of our method by simulation and experiments.Methods
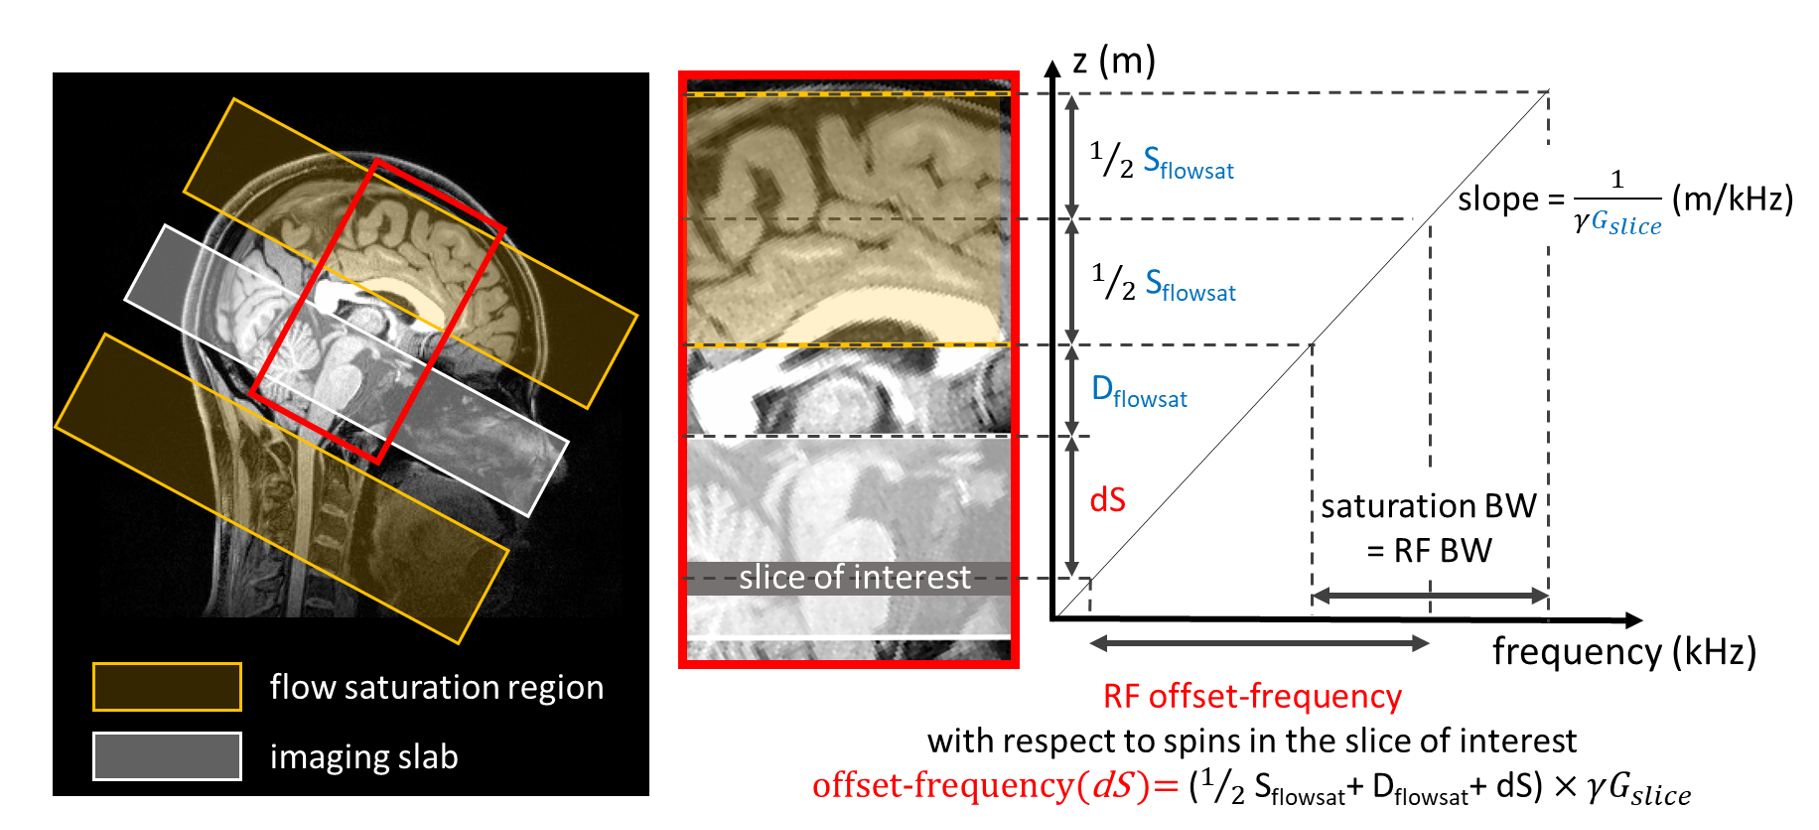
[MT effects of FS pulse] MT effects of an FS pulse are depicted in Figure 1. The FS pulse is applied with a slice selection gradient; therefore, the offset-frequency is a function of the position of a slice of interest (dS) from the top of the imaging volume:$$Offset-frequency(dS)\,=\,(0.5S_{flowsat}\,+D_{flowsat}\,+dS)\times\gamma G_{slice}$$
where Sflowsat is FS thickness and Dflowsat is FS gap. This means users can determine the offset-frequency which is an advantage over most product MT pulses.
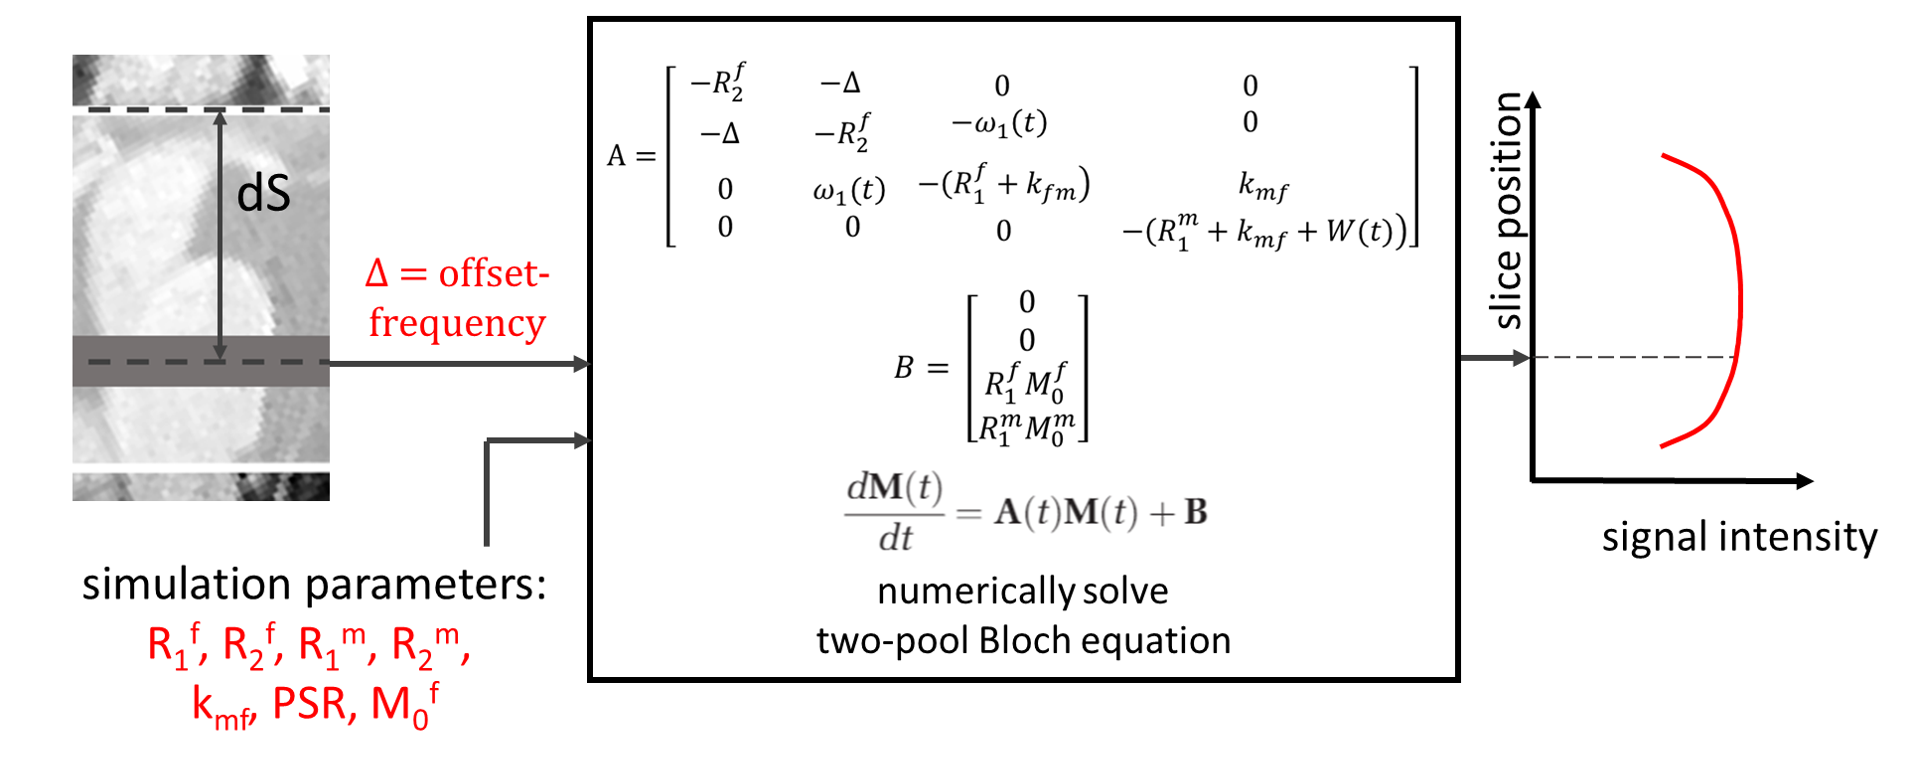
[Two-pool Bloch simulation] The signal intensity of a spin at the position dS can be simulated by two-pool Bloch simulation7 (Figure 2). A super-Lorentzian absorption lineshape was chosen, and the simulation parameters for crus cerebri (CC) and substantia nigra (SN) were adapted from a previous research5. M0f of CC and SN were set to be 0.86 and 1, respectively.
[Sequence parameters] Images were acquired in three healthy subjects (IRB approved; 3T, Trio, Siemens). The sequence parameters for fsNM were fixed as follows unless mentioned otherwise: FOV=230×230×40mm3, voxel size=0.5×0.5×2.5mm3, TR/TE=60/4.77ms, FA=20°, and readout bandwidth=170Hz/pixel, Sflowsat=50mm, Dflowsat=0mm, number of FS (Nflowsat)=6. The FS pulse had duration=3.840ms and RF bandwidth=2176Hz.
[MRI experiments] Four experiments were conducted to determine the sequence parameters that provide the best NM contrast. For Experiment 1 to 3, the two-pool Bloch simulation was conducted using the specified sequence parameters.
Experiment 1: single-sided FS vs. sandwiched FS
To evaluate the symmetricity of the double-sided (sandwiched) FS (e.g., when Nflowsat=2k, k FS regions located inferior to and others superior to the imaging volume), fsNM was acquired with six single-sided (inferior to imaging volume) FS and six sandwiched FS. For the case of the sandwiched-FS, the superior and inferior saturation pulses (three each) were alternately applied.
Experiment 2: FS gap
To assess the effects of the gap between the FS region and imaging volume, the sandwich-fsNM acquisition was repeated with Dflowsat=0, 20, and 40mm. Nflowsat was fixed to 2.
Experiment 3: number of FS
To assess the effects of Nflowsat in the images, the sandwich-fsNM acquisition was repeated with Nflowsat=2, 4, and 6.
Experiment 4: comparison with conventional NM
For comparison, two conventional NM-sensitive images were acquired in a single subject: 3D GRE and 2D TSE images both with MT pulse preparation (offset-frequency=1200Hz, FA=500°, RF bandwidth=230Hz) and T1 weighting (MT-GRE and MT-TSE). The MT-GRE sequence parameters were matched to the fsNM parameters, and MT-TSE images were acquired with FOV=230×230mm2, slice thickness 2.5mm, voxel size=0.5×0.5mm2, TR/TE=910/14ms, and readout bandwidth=120Hz/pixel.
[Contrast ratio] Contrast ratio (CR) between SN and CC was calculated for both simulation and experimental data as described in a previous study8:
$$CR(\%)=\frac{(I_{SN}-I_{CC})}{I_{CC}}\times100$$
where ISN and ICC are the simulated signals in case of simulated data, or the ROI-averaged signal intensities in the case of experiment.
Results
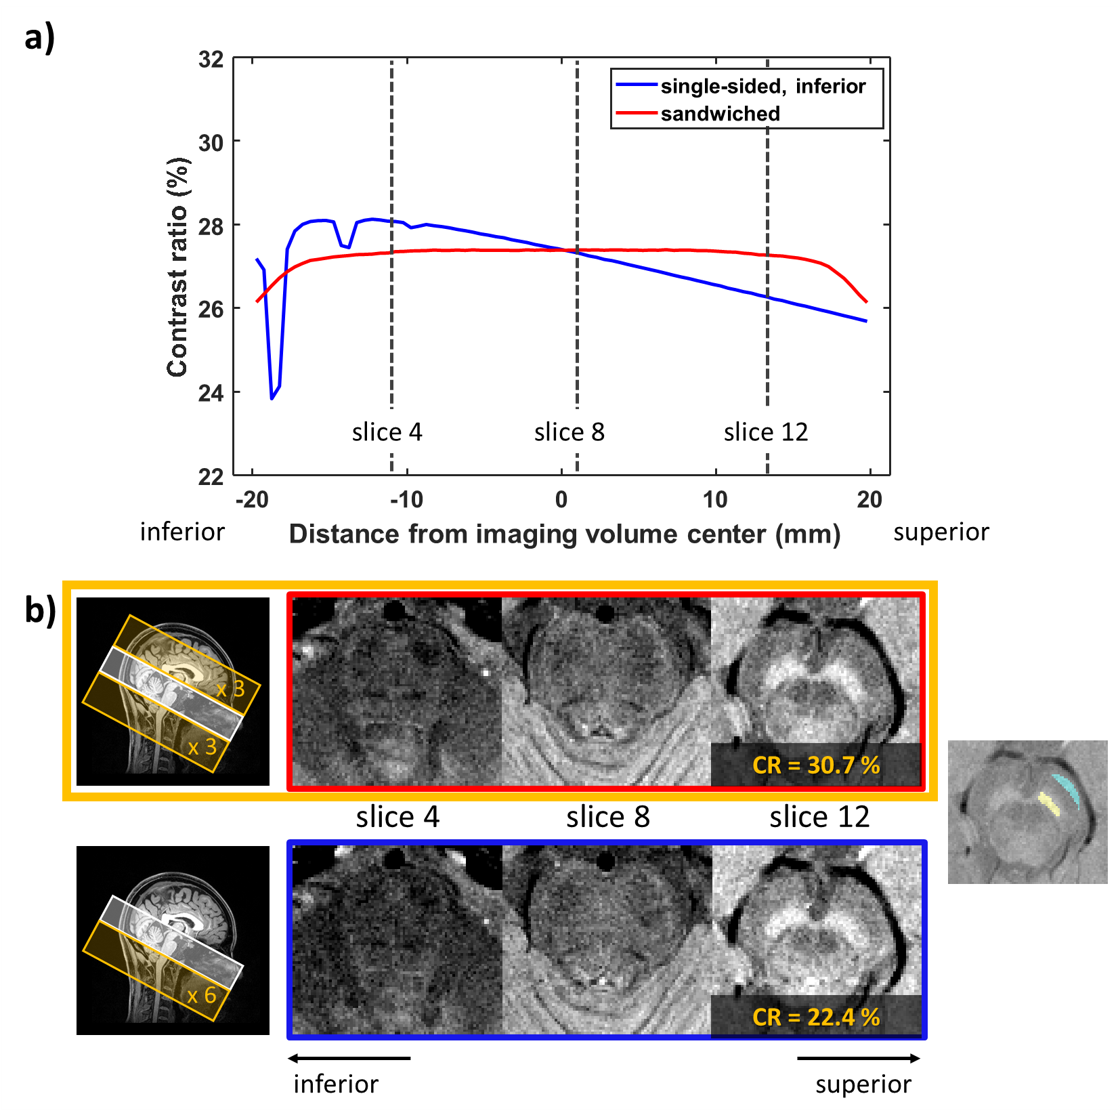
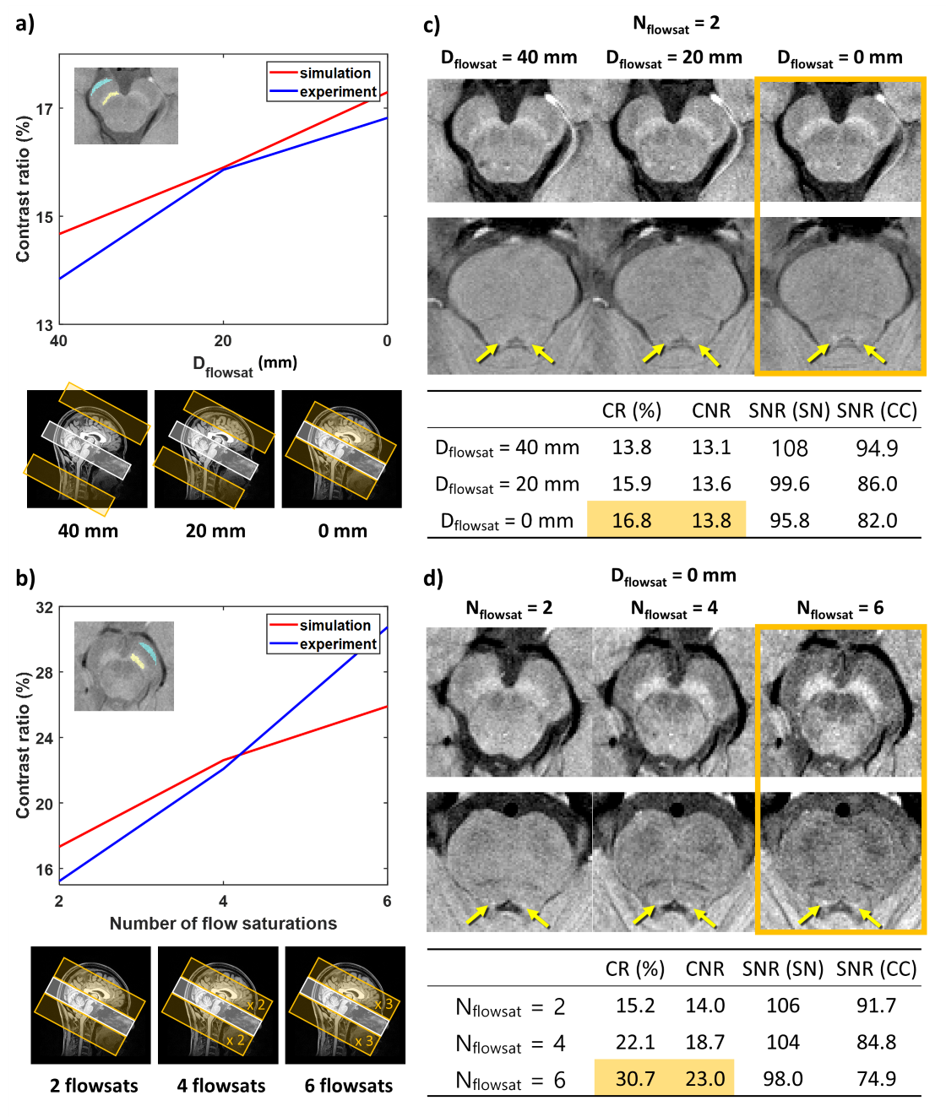
The simulation results demonstrate more symmetric MT effects in the sandwiched FS than in the single-sided FS (Figure 3a,b). The experimental results confirm this finding (Figure 3b): In the superior slice, the single-sided fsNM image shows smaller CR between SN and CC (22.4%) than that of the sandwich-fsNM image (30.7%) whereas the intermediate slice shows similar contrast in both acquisitions.The effects of Dflowsat and Nflowsat are summarized in Figure 4. The simulation and experimental results reveal increased CR as Dflowsat decreases (Figure 4a) and as Nflowsat increases (Figure 4b). When experimental data are further analyzed, the CNR increases and the SNR decreases, as Dflowsat decreases and as Nflowsat increases (Tables in Figure 4c, d). Both SN and LC are most clearly visualized when Dflowsat=0mm and Nflowsat=6. The effect size of changing Dflowsat (3% difference from Dflowsat=40 to 0mm) is smaller than changing Nflowsat (15.5% difference from 2 FS pulses to 6).
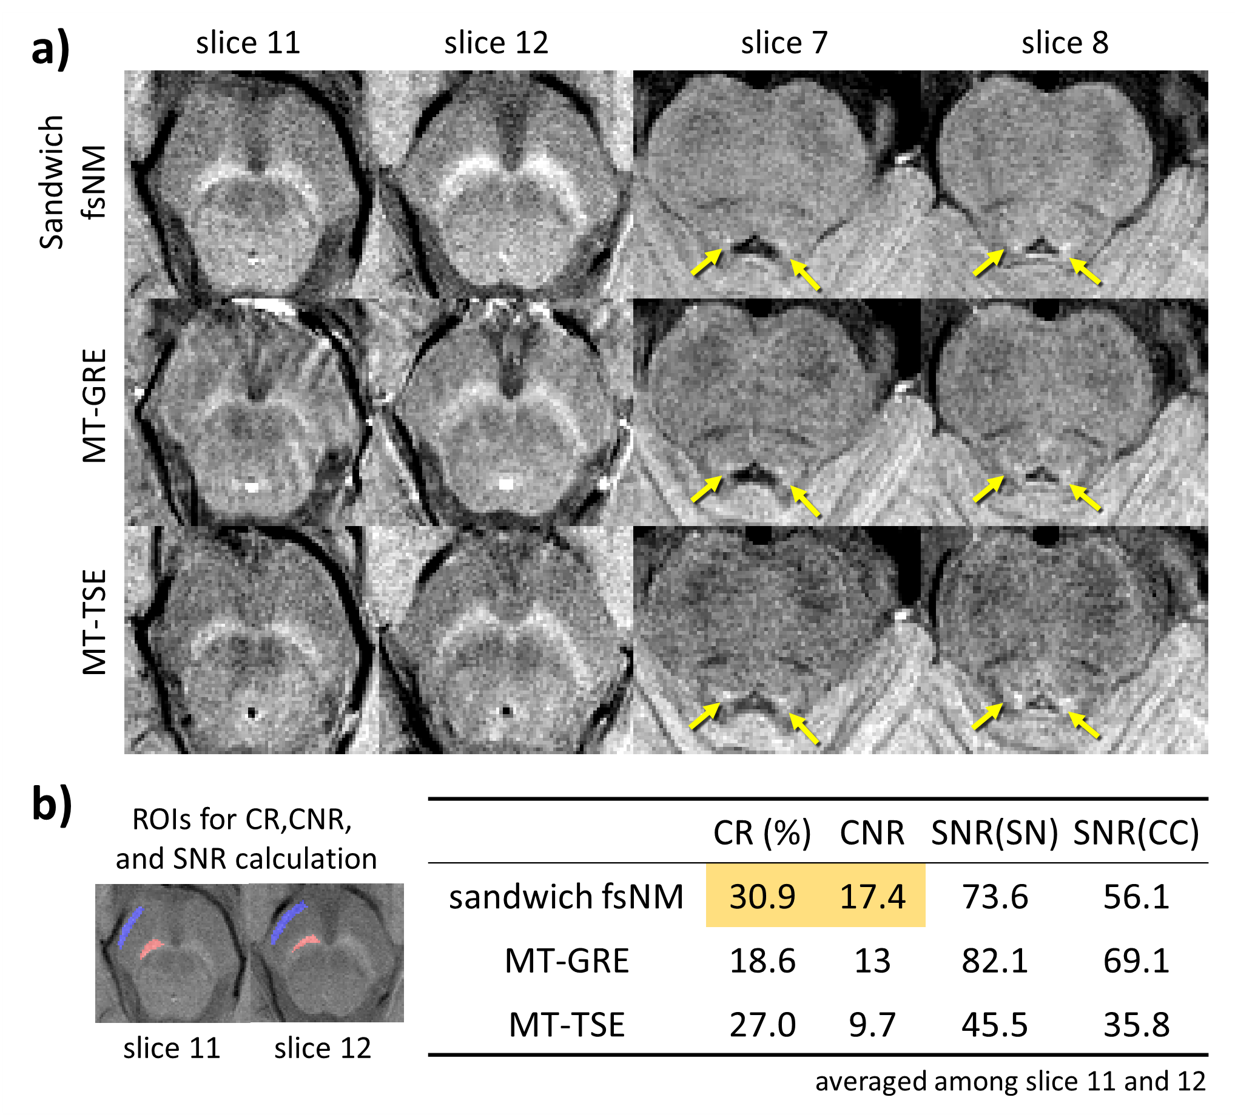
When compared with the MT-GRE and MT-TSE images, our sandwich-fsNM images display better contrast both visually and by metrics (Figure 5). When averaged across slices, CR (or CNR) between SN and CC of sandwich-fsNM is 1.66 (or 1.34) times higher than that of MT-GRE, and 1.14 (or 1.79) times higher than that of MT-TSE (Figure 5b). The SNR of sandwich-fsNM is slightly lower than that of MT-GRE, but larger than that of MT-TSE (Figure 5b).
Discussion and Conclusion
Sandwich-fsNM provides higher contrast than the conventional methods, allowing clear delineation of SN and LC. Conventional MT pulses (e.g., offset-frequency=1200Hz, FA=500°, saturation-BW=230Hz) benefit from high FAs whereas FS pulses (e.g., offset-frequency=2629Hz (flexible), FA=90°$$$\times$$$6 or $$$\times$$$4, saturation-BW=2176Hz) have flexible offset-frequency and number of pulses, and wider saturation bandwidth, providing higher MT effects than the conventional MT pulse. This flexibility can be beneficial in cross-vendor studies.Acknowledgements
This work was supported by Creative-Pioneering Researchers Program through Seoul National University (SNU), the National Research Foundation of Korea (NRF) grant funded by the Korea government (MSIT) (No. NRF-2018R1A2B3008445), and partly by Heuron.References
1. Cassidy, C. M. et al. Neuromelanin-sensitive MRI as a noninvasive proxy measure of dopamine function in the human brain. Proc National Acad Sci 116, 201807983 (2019).
2. Trujillo, P. et al. Pool size ratio of the substantia nigra in Parkinson’s disease derived from two different quantitative magnetization transfer approaches. Neuroradiology 59, 1251–1263 (2017).
3. Sulzer, D. et al. Neuromelanin detection by magnetic resonance imaging (MRI) and its promise as a biomarker for Parkinson’s disease. Npj Park Dis 4, 11 (2018).
4. Liu, Y. et al. Optimizing neuromelanin contrast in the substantia nigra and locus coeruleus using a magnetization transfer contrast prepared 3D gradient recalled echo sequence. Neuroimage 218, 116935 (2020).
5. Trujillo, P. et al. Quantitative magnetization transfer imaging of the human locus coeruleus. Neuroimage 200, 191–198 (2019).
6. Xing, Y., Sapuan, A., Dineen, R. A. & Auer, D. P. Life span pigmentation changes of the substantia nigra detected by neuromelanin‐sensitive MRI. Movement Disord 33, 1792–1799 (2018).
7. Graham, S. J. & Henkelman, R. M. Understanding pulsed magnetization transfer. J Magn Reson Imaging 7, 903–912 (1997).
8. Sasaki, M. et al. Neuromelanin magnetic resonance imaging of locus ceruleus and substantia nigra in Parkinson’s disease. Neuroreport 17, 1215–1218 (2006).
Figures