1252
BOLD-free fMRI?1Neuroimaging, King's College London, London, United Kingdom
Synopsis
We demonstrate a proof-of-concept fMRI experiment using a BOLD-insensitive MT-prepared ZTE pulse sequence, which exploits the recently proposed Arterial Blood Contrast mechanism. We show tightly localised responses to a visual checkerboard task in a small number of subjects.
Introduction
Recently, Schulz et al demonstrated that adding an MT saturation pulse to a BOLD EPI sequence increases sensitivity to blood volume changes, allowing detection of neuronal activation even at a TE of 6.9 ms [1]. They refer to this method as Arterial Blood Contrast (ABC) in comparison to BOLD. Previously, Magnotta et al demonstrated similar effects using a spin-lock pulse and a TE of 12 ms [2]. While these echo times are significantly shorter than what is considered optimal for BOLD contrast, they do retain a small amount of T2* weighting. This raises the intriguing possibility of conducting an fMRI experiment without BOLD, if only TE can be reduced to zero.Zero Echo-Time (ZTE) pulse sequences are well established for structural imaging, with interesting applications demonstrated in imaging substances with ultra-short T2*, such as bone and myelin [3,4]. They have also been previously used for functional imaging using a T2-prep pulse to induce BOLD contrast [5]. In this study we adapted an MT-weighted ZTE sequence to allow scanning at a temporal resolution suitable for fMRI [6]. We present preliminary, proof-of-concept results in a small number of subjects, suggesting that neuronal activation can be detected with this sequence but that sensitivity is low compared to BOLD.
Methods
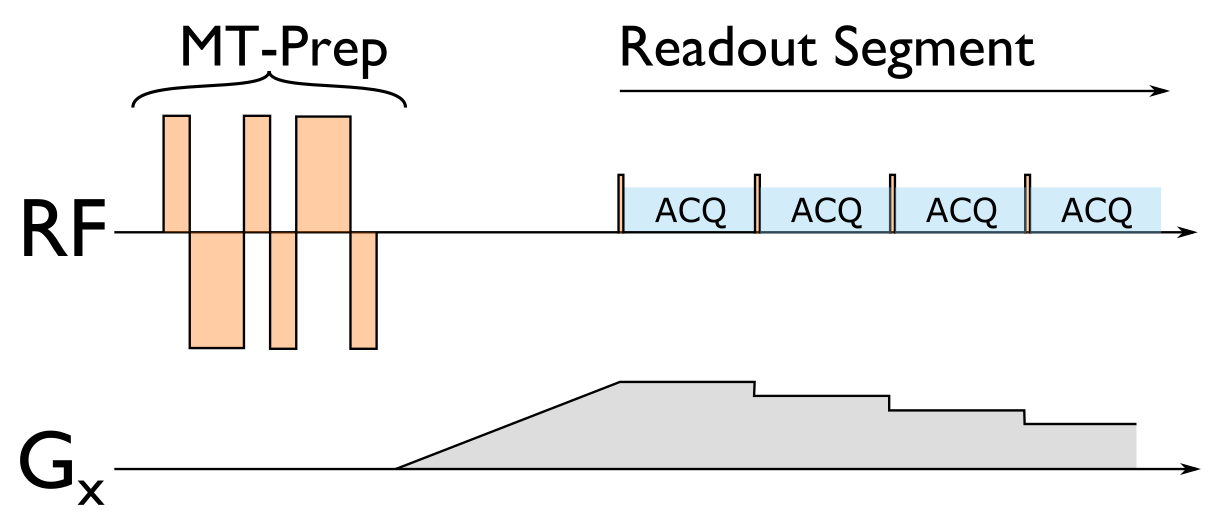
We acquired data with a 3T MR750 (GE Healthcare, Chicago, IL) scanner and 32-channel head coil (Nova Medical, Wilmington, MA). We modified the sequence from [6], shown in Figure 1, to use a 6ms binomial 1/-2/1/-1/2/-1 preparation pulse [1]. Between each MT pulse a segment of 48 ZTE readouts was with a 1° block-pulse and read-out bandwidth +/-31.25kHz (2x oversampled). The FoV was 216x216x126mm, 3mm isotropic voxels, angular acceleration factor R=6, volume TR=2.5s. We also acquired a T1-weighted Inversion Recovery ZTE structural image with TI 450ms, 220mm isotropic FoV, 1mm isotropic voxels, read-out bandwidth +/-15.625kHz [7]. We used an 8Hz visual checkerboard stimulus task consisting of 10 blocks consisting of 10-seconds-off/10-seconds-on/10-seconds-off. Each subject was scanned at with an MT flip-angle of 480° and 500°, and additionally with 0° (PD-weighted) for comparison.Images were reconstructed using a self-calibrating cgSENSE approach with density compensation and Toeplitz embedding [8, 9]. The fMRI analysis was conducted in SPM-12, using a standard pre-processing pipeline consisting of motion-correction, co-registration to the T1-weighted image, normalization to MNI space, 6mm FWHM smoothing and a 1st-level analysis including motion regressors, a 128s high-pass filter and a canonical HRF. Temporal signal-to-noise (tSNR) was calculated as established by Friedman and Glover [10]. In total five subjects were scanned, but two were excluded due to severe artefacts in the pre-frontal cortex.
Results and Discussion
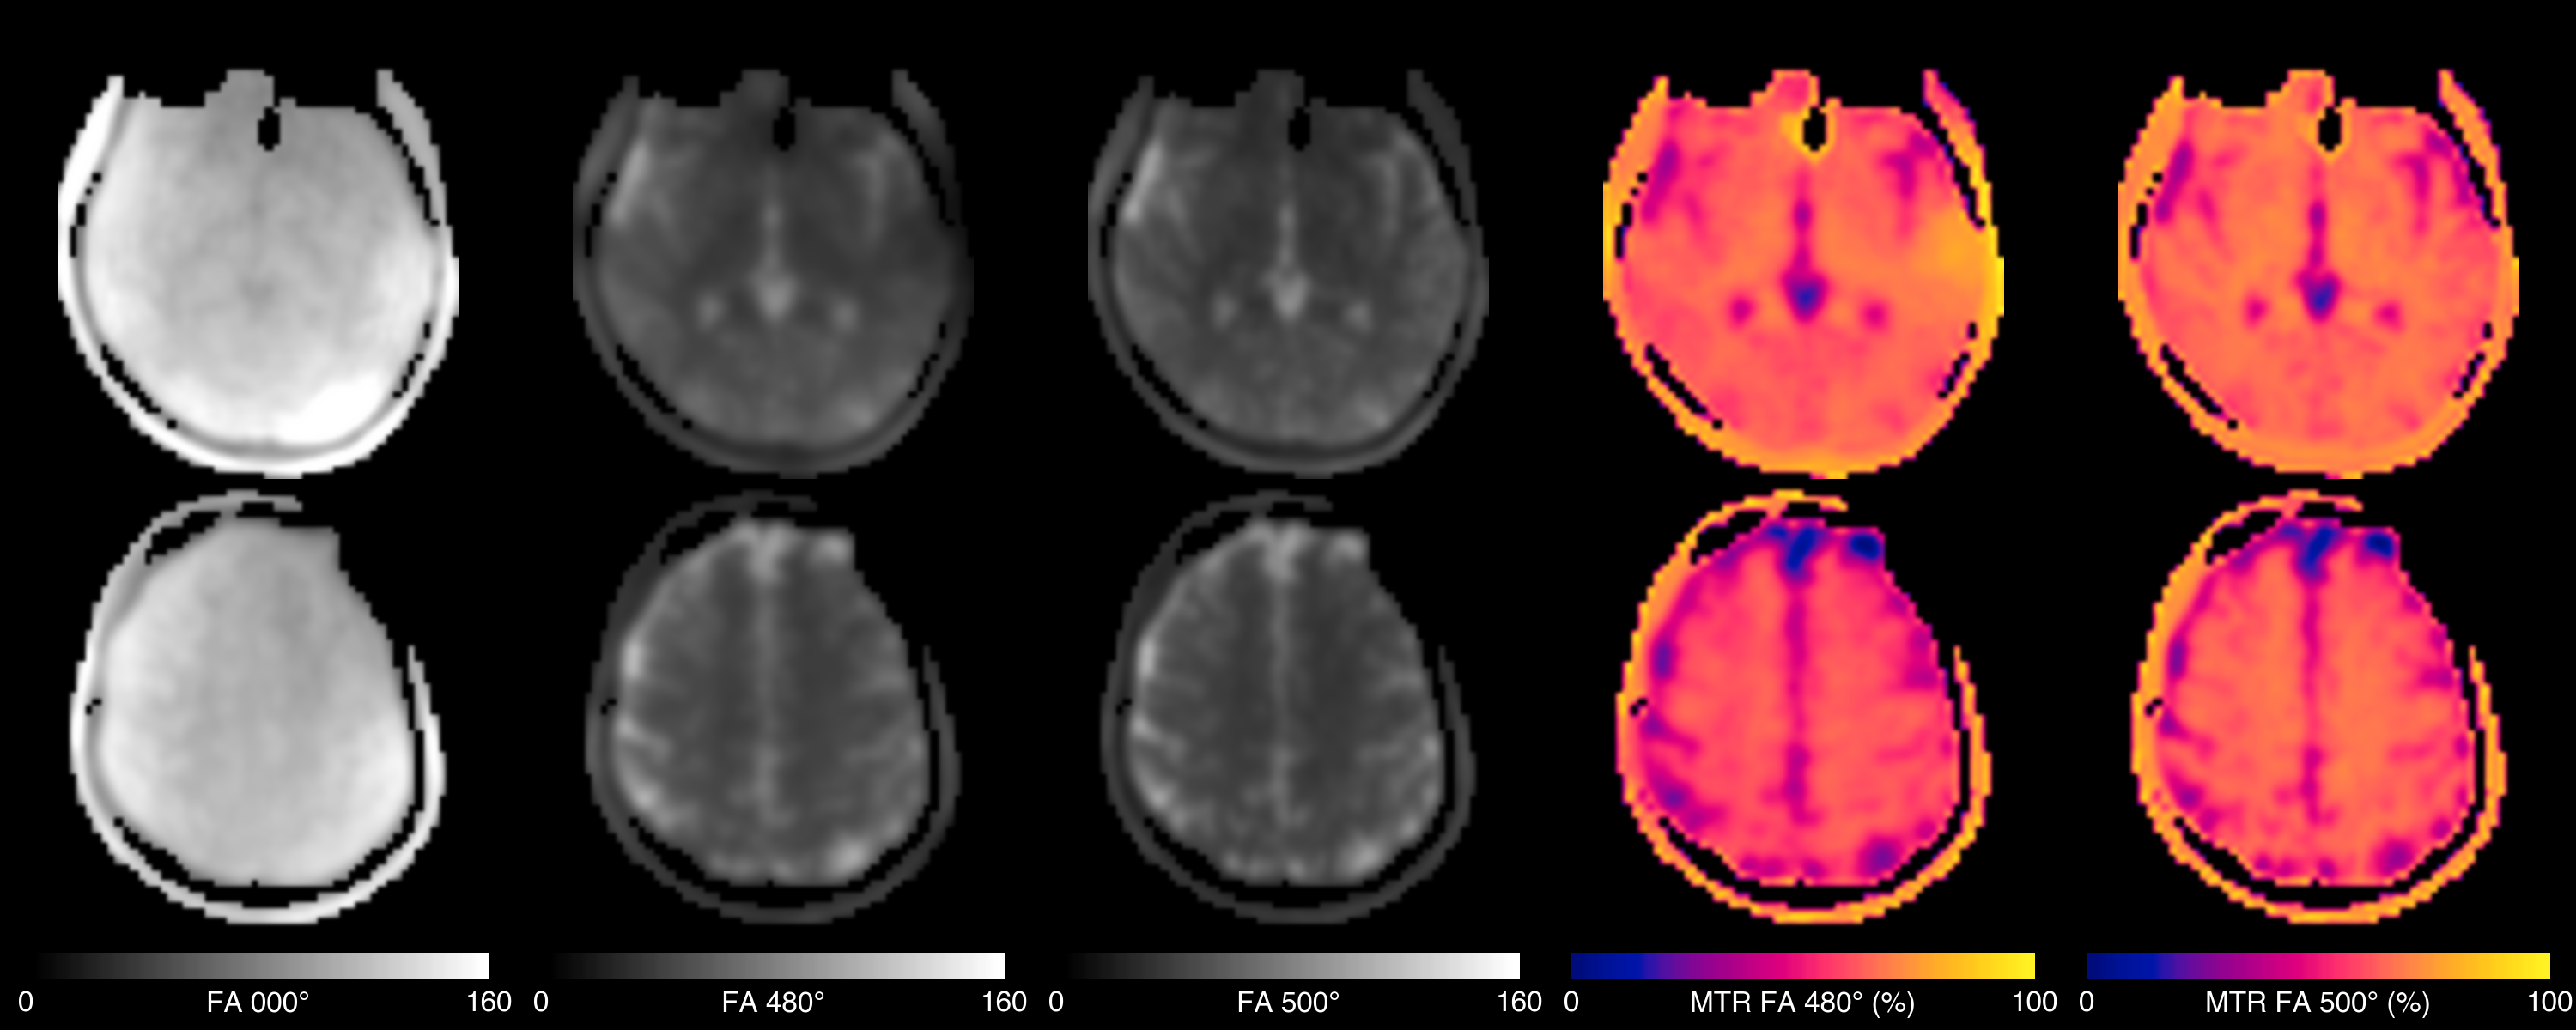
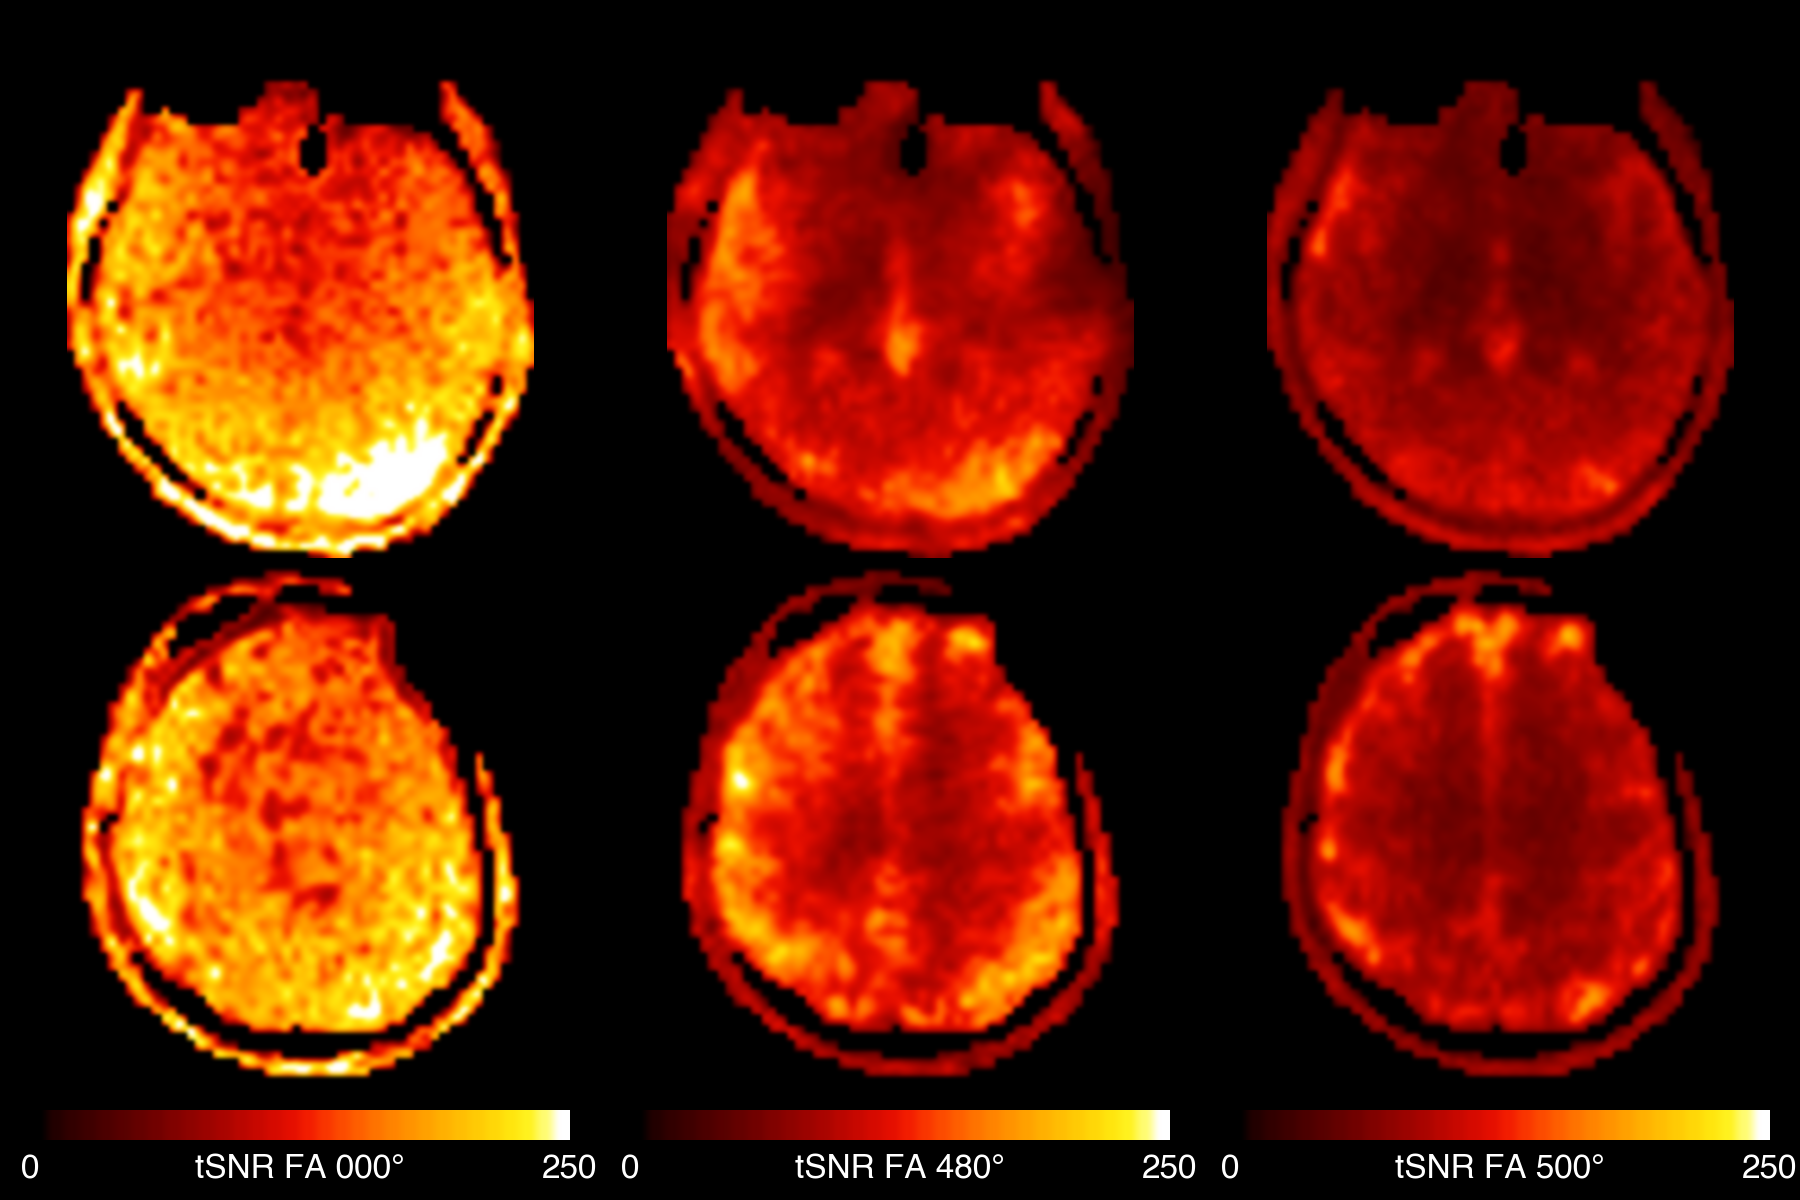
Figure 2 shows example images from one subject at the three power levels, and the MT ratio achieved for the 480° and 500° flip-angles. Reasonable raw image quality was obtained despite the high acceleration factor. An MTR above 60% was achieved in white-matter, with the 500° power level achieving about 5% higher MTR.Figure 3 shows the temporal SNR at the three power levels, which was highest for the PD-weighted image and lower for the MT-weighted runs. This is almost entirely driven by the reduction in signal from the MT-weighting, as the temporal standard deviation was similar between runs (data not shown). Hence there is a balance to be achieved between sufficient MT-weighting to cause the ABC effect and maintaining sufficient tSNR to observe a result.
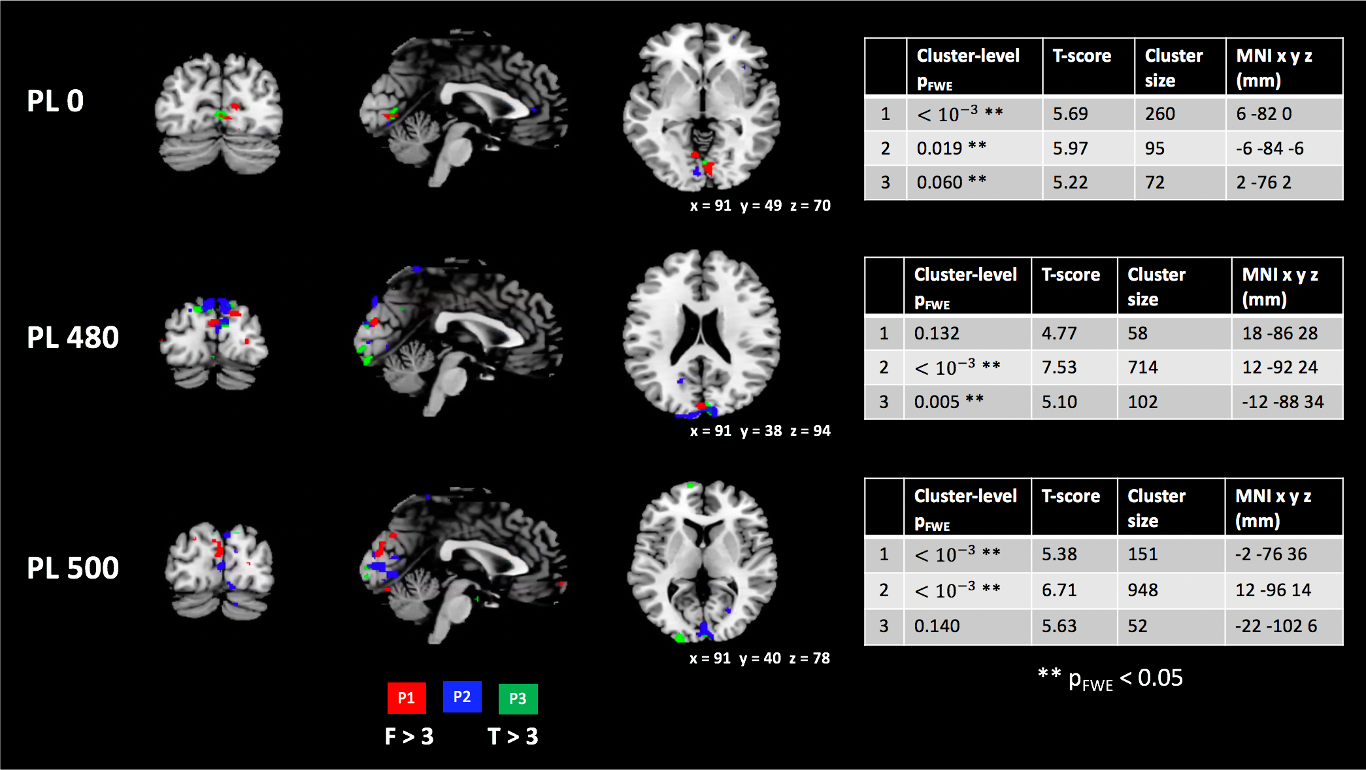
Figure 4 shows the results of the 1st level analyses of all subjects overlaid on the MNI template. Significant but tightly localised activations in the visual cortex were observed in both MT-weighted runs. These did not show the same extent that is typical of BOLD fMRI experiments in the visual cortex, for which there are several potential explanations. The potential ABC effect at TE=0 is expected to be roughly a third of the BOLD effect at the optimal TE [1], which means that the acquisition needs to have very high tSNR to achieve an equivalent sensitivity to BOLD. It is likely that we have not yet achieved this. However, in addition, ABC should be free from draining vein effects which is expected to reduce the extent of the activation area [1].
We observed consistent activation in all subjects near the sagittal sinus in the PD-weighted run, which by definition cannot be due to MT effects. However, the sinus is well vascularised and there is a large contrast difference between CSF and blood even with PD-weighting, so it is probable that this can be explained by a change of blood volume within the sinus [11]. This activation area corresponds to an area with lower tSNR in the MT-weighted runs, which may explain why this activation was not detected in them.
Conclusion
This proof-of-concept experiment shows that it may be possible to detect neuronal activation from a visual task using an MT-weighted ZTE sequence that is sensitive to ABC but not BOLD effects. However the lower size of the ABC effect relative to BOLD makes this method extremely challenging. Further work is required to optimize and improve the robustness of the method and analysisAcknowledgements
We thank David Norris and Jenni Schulz for useful conversations. This work was supported by the Wellcome/EPSRC Centre for Medical Engineering [WT 203148/Z/16/Z] and the NIHR Clinical Research Facility at King's College Hospital. This abstract represents independent research supported by the National Institute for Health Research (NIHR) Biomedical Research Centre at South London and Maudsley NHS Foundation Trust and King’s College London. Nikou is in receipt of a PhD studentship funded by the NIHR Maudsley Biomedical Research Centre. The views expressed are those of the author(s) and not necessarily those of the NHS, the NIHR or the Department of Health and Social Care.
References
- J. Schulz, Z. Fazal, R. Metere, J. P. Marques, and D. G. Norris, ‘Arterial blood contrast (ABC) enabled by magnetization transfer (MT): a novel MRI technique for enhancing the measurement of brain activation changes’, Neuroscience, preprint, May 2020. doi: 10.1101/2020.05.20.106666.
- V. A. Magnotta et al., ‘Detecting activity-evoked pH changes in human brain’, Proceedings of the National Academy of Sciences, vol. 109, no. 21, pp. 8270–8273, May 2012, doi: 10.1073/pnas.1205902109.
- F. Wiesinger et al., ‘Zero TE MR bone imaging in the head: Zero TE Bone Imaging’, Magnetic Resonance in Medicine, vol. 75, no. 1, pp. 107–114, Jan. 2016, doi: 10.1002/mrm.25545.
- M. Weiger, R. Froidevaux, E. L. Baadsvik, D. O. Brunner, M. B. Rösler, and K. P. Pruessmann, ‘Advances in MRI of the myelin bilayer’, NeuroImage, vol. 217, p. 116888, Aug. 2020, doi: 10.1016/j.neuroimage.2020.116888.
- A. B. Solana, A. Menini, L. I. Sacolick, N. Hehn, and F. Wiesinger, ‘Quiet and distortion-free, whole brain BOLD fMRI using T2-prepared RUFIS’, Magnetic Resonance in Medicine, vol. 75, no. 4, pp. 1402–1412, Apr. 2016, doi: 10.1002/mrm.25658.
- T. C. Wood et al., ‘Silent myelin-weighted magnetic resonance imaging’, Wellcome Open Research, vol. 5, p. 74, Aug. 2020, doi: 10.12688/wellcomeopenres.15845.2.
- S. J. Holdsworth, S. J. Macpherson, K. W. Yeom, M. Wintermark, and G. Zaharchuk, ‘Clinical Evaluation of Silent T1-Weighted MRI and Silent MR Angiography of the Brain’, American Journal of Roentgenology, vol. 210, no. 2, pp. 404–411, Feb. 2018, doi: 10.2214/AJR.17.18247.
- J. G. Pipe and P. Menon, ‘Sampling density compensation in MRI: Rationale and an iterative numerical solution’, Magnetic Resonance in Medicine, vol. 41, no. 1, pp. 179–186, Jan. 1999, doi: 10.1002/(SICI)1522-2594(199901)41:1<179::AID-MRM25>3.0.CO;2-V.
- C. A. Baron, N. Dwork, J. M. Pauly, and D. G. Nishimura, ‘Rapid compressed sensing reconstruction of 3D non-Cartesian MRI’, Magnetic Resonance in Medicine, vol. 79, no. 5, pp. 2685–2692, May 2018, doi: 10.1002/mrm.26928.
- L. Friedman and G.H. Glover, 'Report on a multicenter fMRI quality assurance protocol.' Journal of Magnetic Resonance Imaging: An Official Journal of the International Society for Magnetic Resonance in Medicine, 23(6), pp.827-839. 2006
- J. Hulvershorn et al., ‘T1ρ contrast in functional magnetic resonance imaging’, Magnetic Resonance in Medicine, vol. 54, no. 5, pp. 1155–1162, Nov. 2005, doi: 10.1002/mrm.20698.
Figures