1251
In-vivo ferumoxytol imaging and T1/T2 characterization at 64mT1Bioengineering, University of Pennsylvania, Philadelphia, PA, United States, 2Hyperfine Research, Guilford, CT, United States, 3Medicine, Perelman School of Medicine, Philadelphia, PA, United States, 4Radiology, Perelman School of Medicine, Philadelphia, PA, United States, 5Neurology, Perelman School of Medicine, Philadelphia, PA, United States
Synopsis
MRI provides superior imaging for diverse clinical applications, but cost and other factors limit availability in various healthcare and lower resource settings. Low-field strength units promise to expand access but involve trade-offs including reduced signal, longer acquisitions, and uncertain benefit of contrast agents. Here we characterize T1 and T2 properties of ferumoxytol, an iron oxide agent with prolonged blood pool phase and higher R1 and R2 values than gadolinium, on a 64mT portable system. We demonstrate enhancement across a range of concentrations in phantoms and visualization of cerebral vasculature in patients receiving the agent for iron-deficiency anemia.
Introduction
The expense, operational complexity, strong magnetic fields, and large footprint of standard clinical 1.5 and 3T MRI systems limit use across the healthcare enterprise and availability of MRI globally1. Portable low-field strength systems promise to increase access, but the physics of low-field imaging require many indications and approaches to be reassessed or adapted. One example is the use of contrast agents. At lower field, tissue T1 relaxation times decrease2, while T2* relaxation times increase3,4. At standard doses, the T1 shortening properties of gadolinium may yield diminished returns. Ferumoxytol is a super paramagnetic iron oxide nanoparticle originally developed as a contrast agent, but FDA approved to treat iron-deficiency anemia. Ferumoxytol shortens T1, T2 and particularly T2* relaxation rates more than gadolinium and has been used off label in a variety of applications including angiography and brain tumor imaging5. Notably, ferumoxytol has a prolonged blood pool phase, which could facilitate vascular imaging with longer acquisitions at low field strength6. In the present study, we characterize the T1 and T2 relaxation properties of ferumoxytol at 64mT in vitro and demonstrate cerebrovascular enhancement in vivo in patients receiving this agent as part of routine clinical care for iron deficiency anemia.Methods
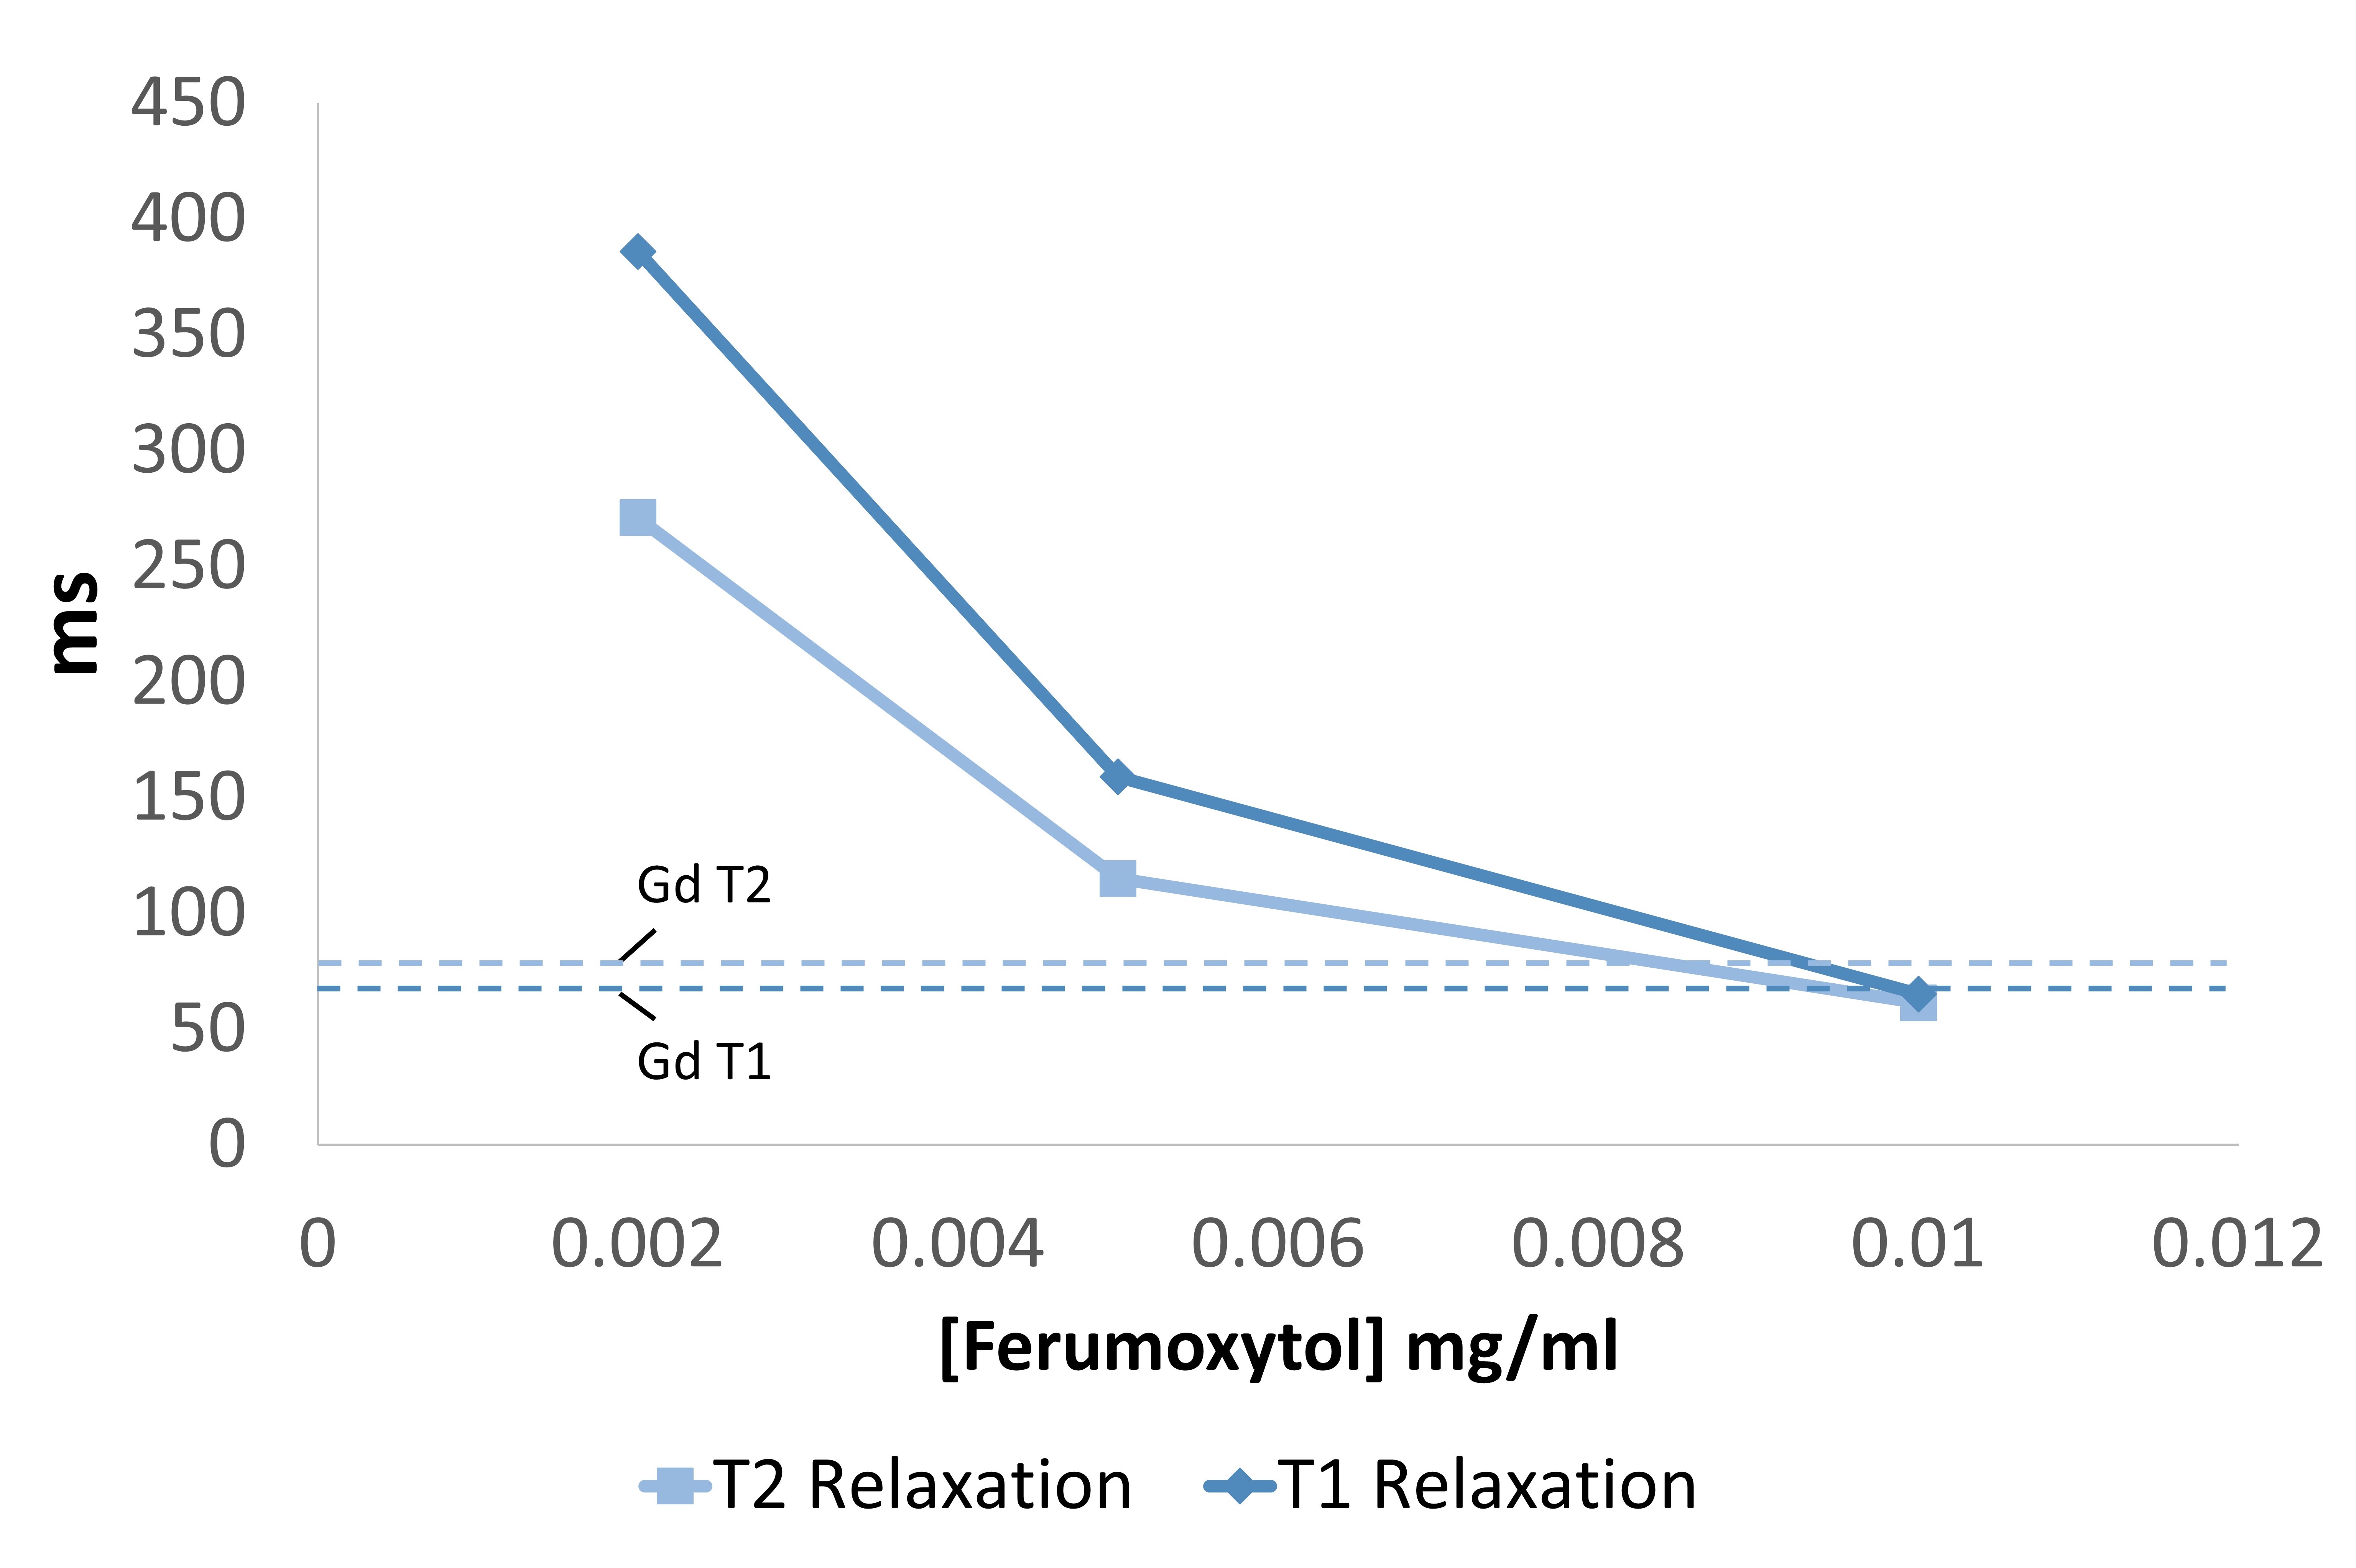
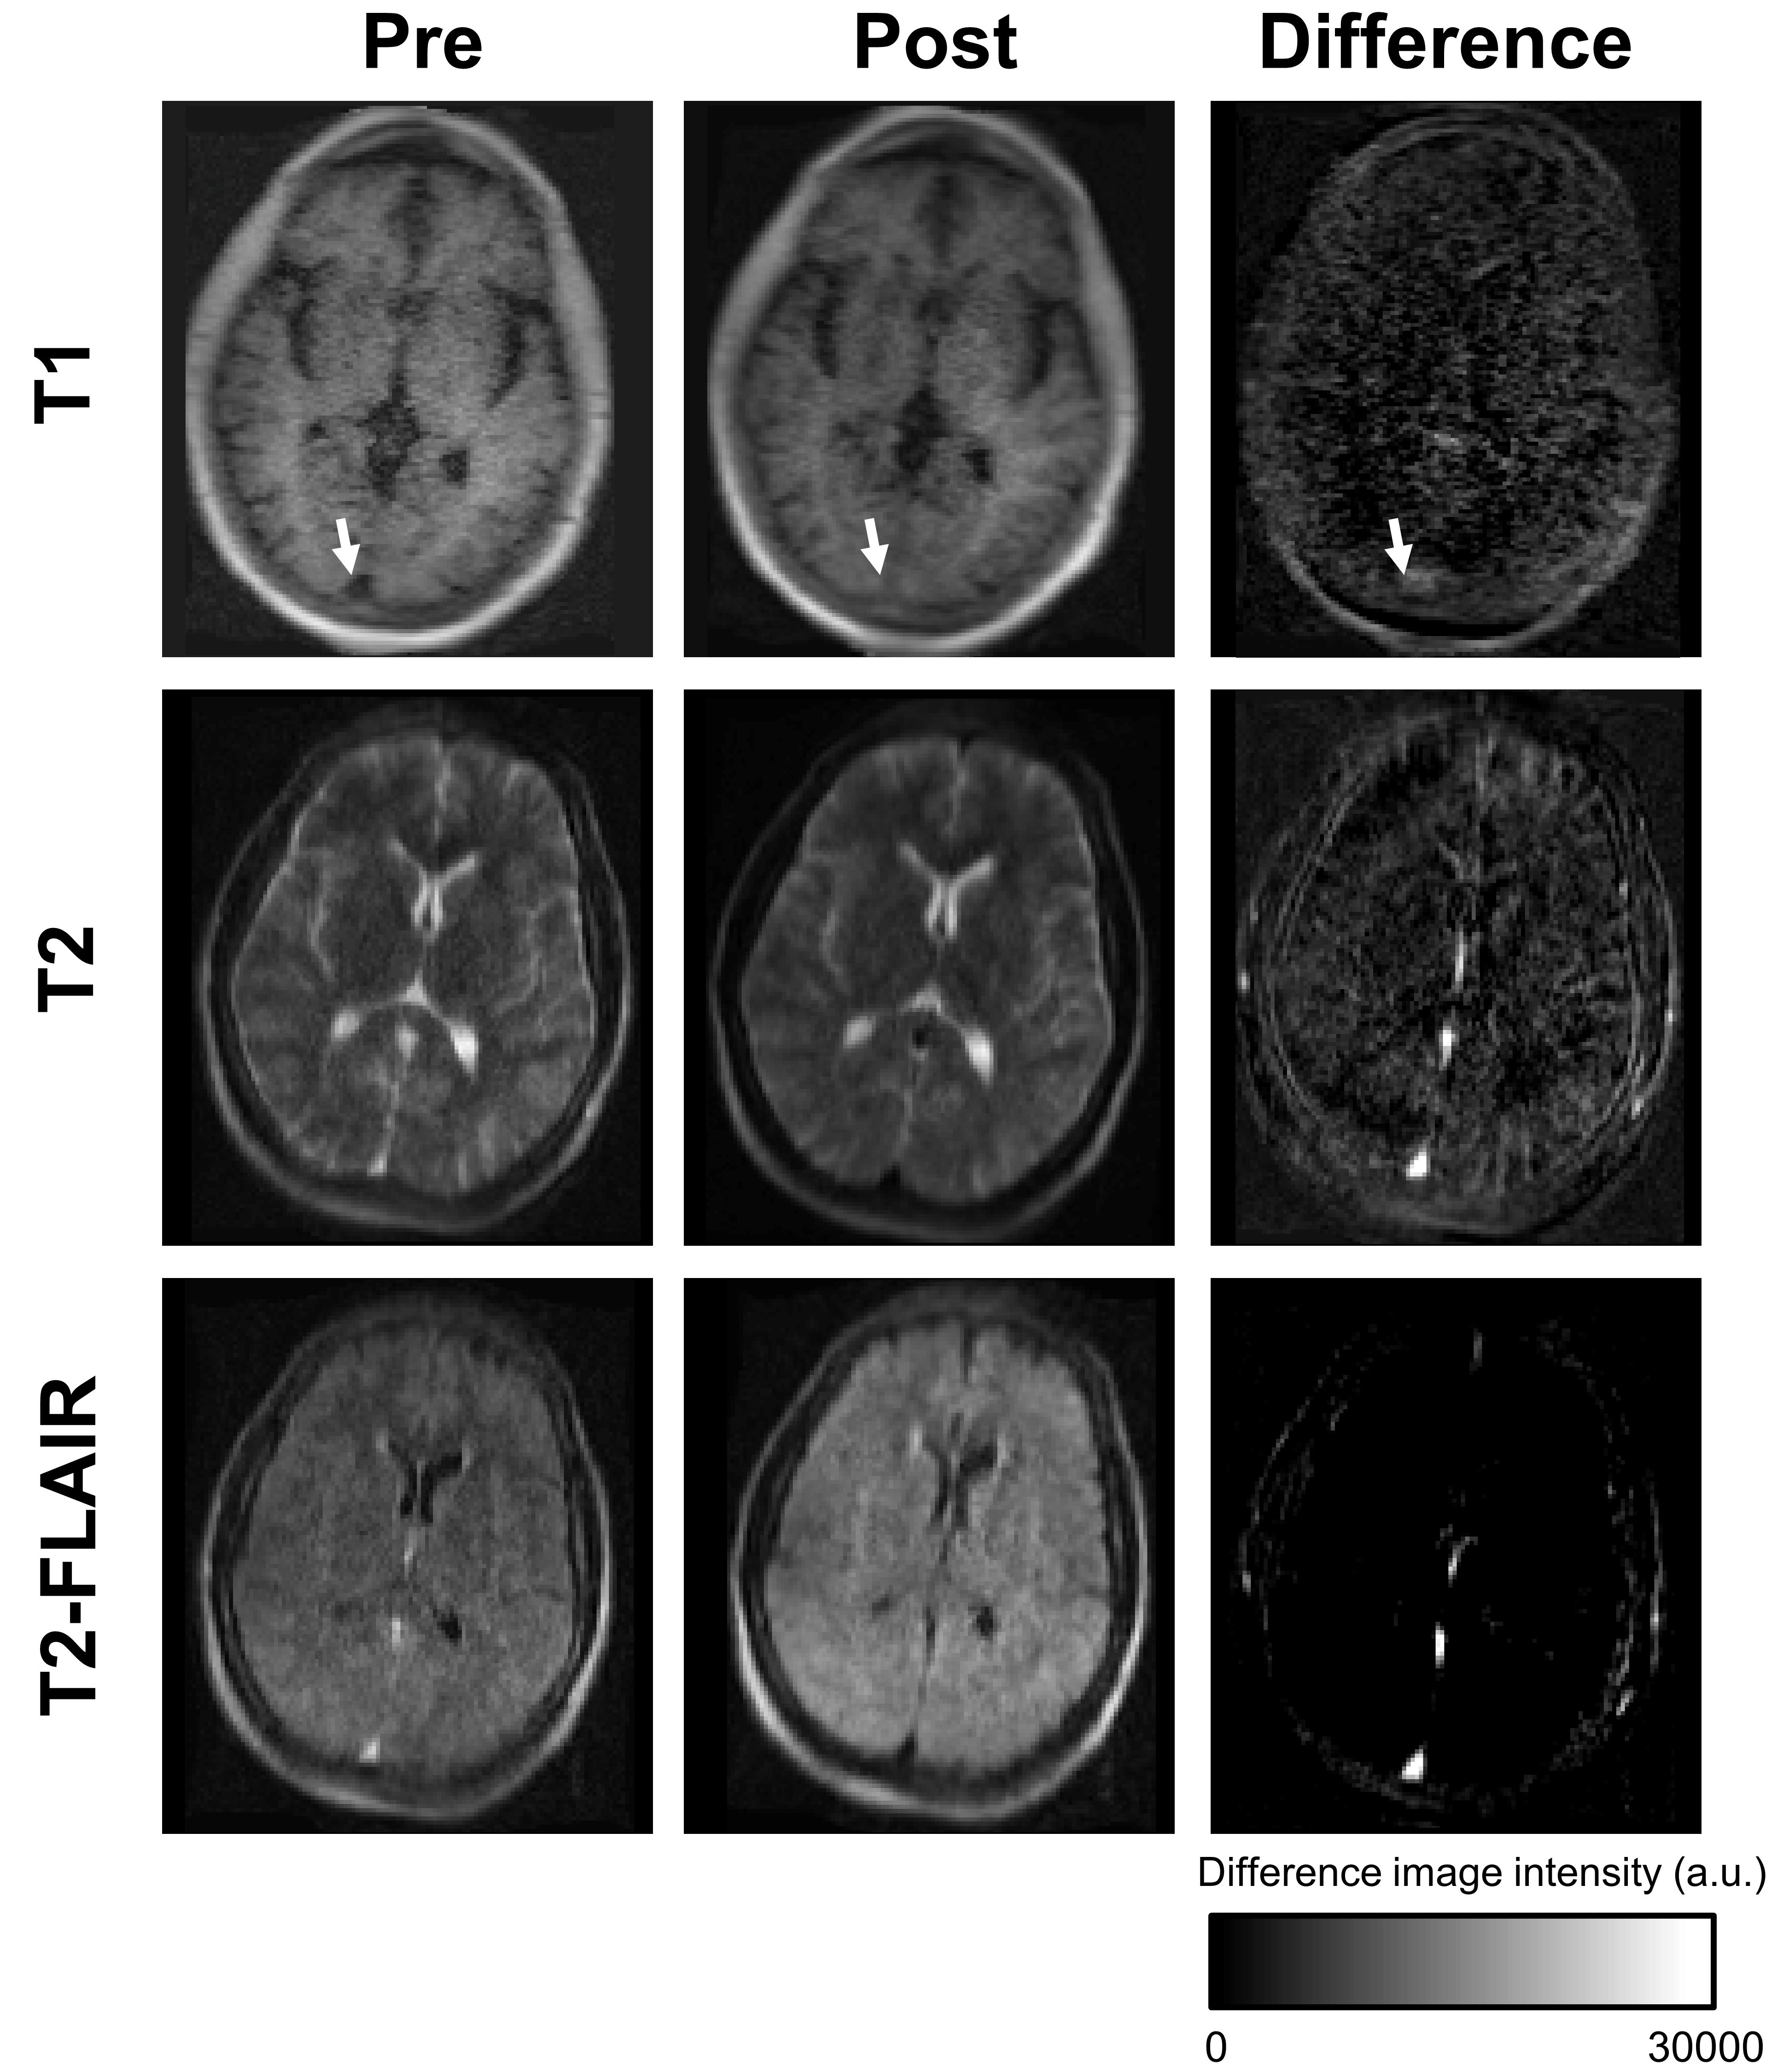
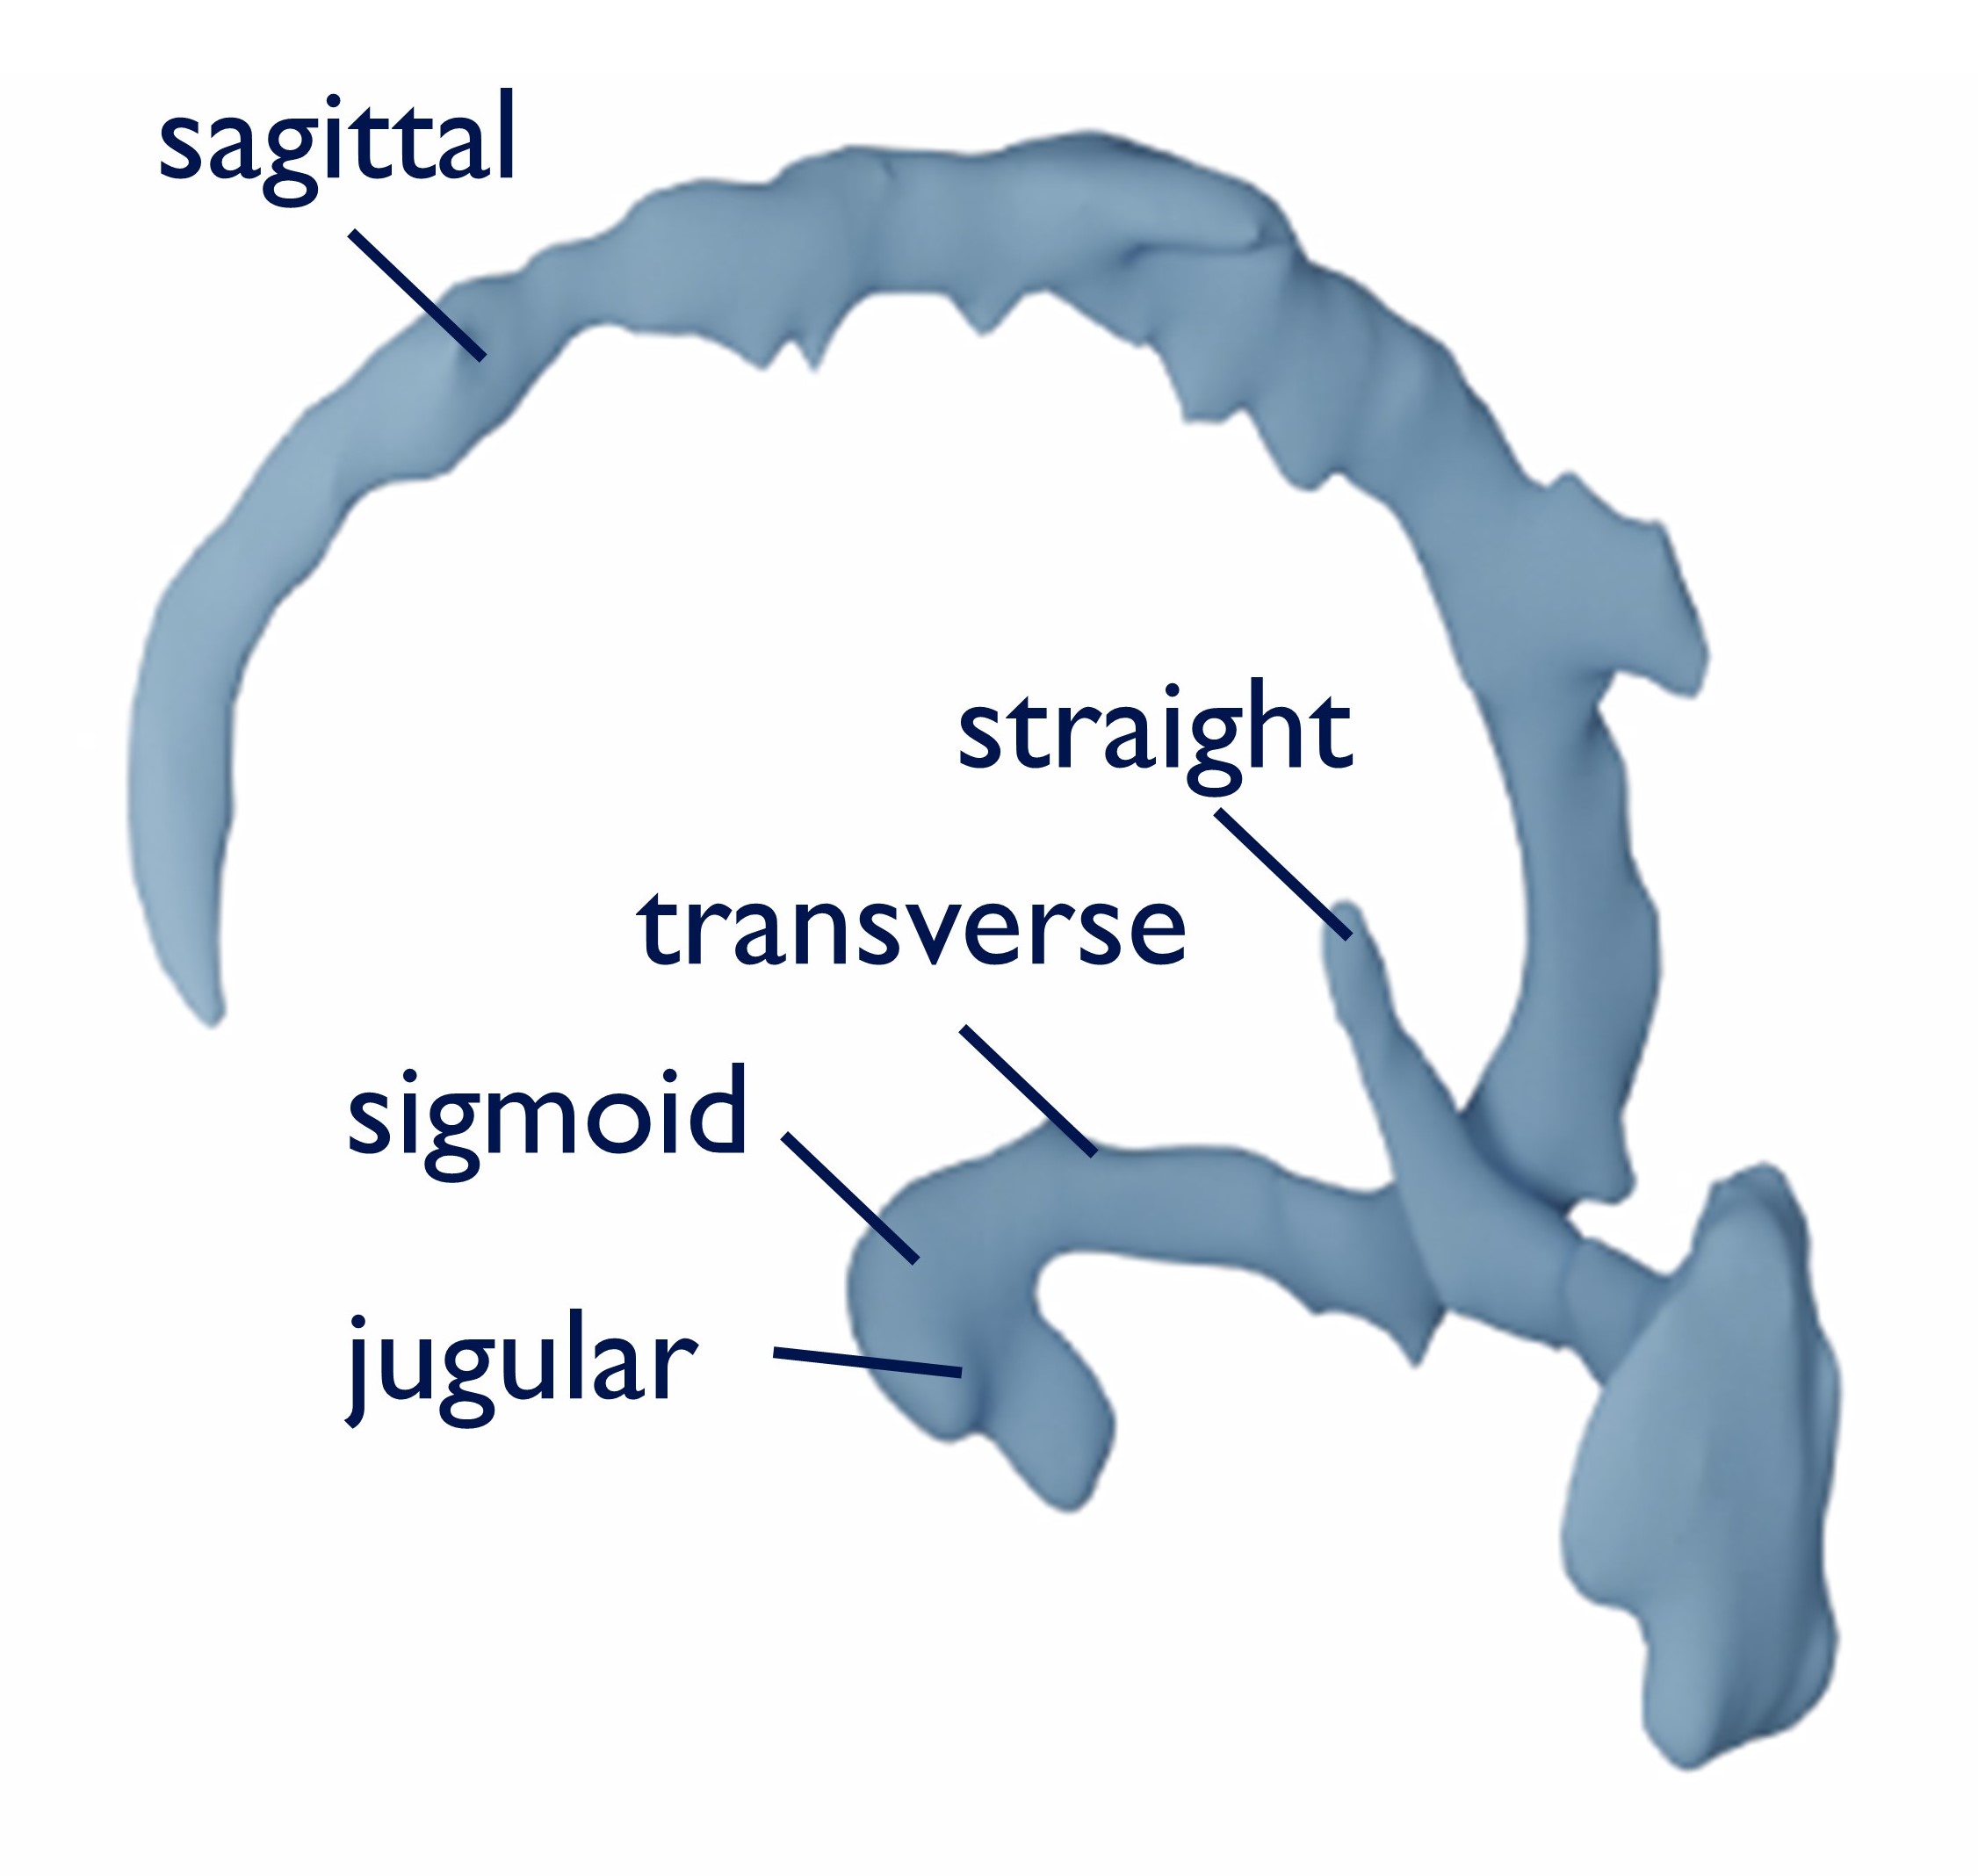
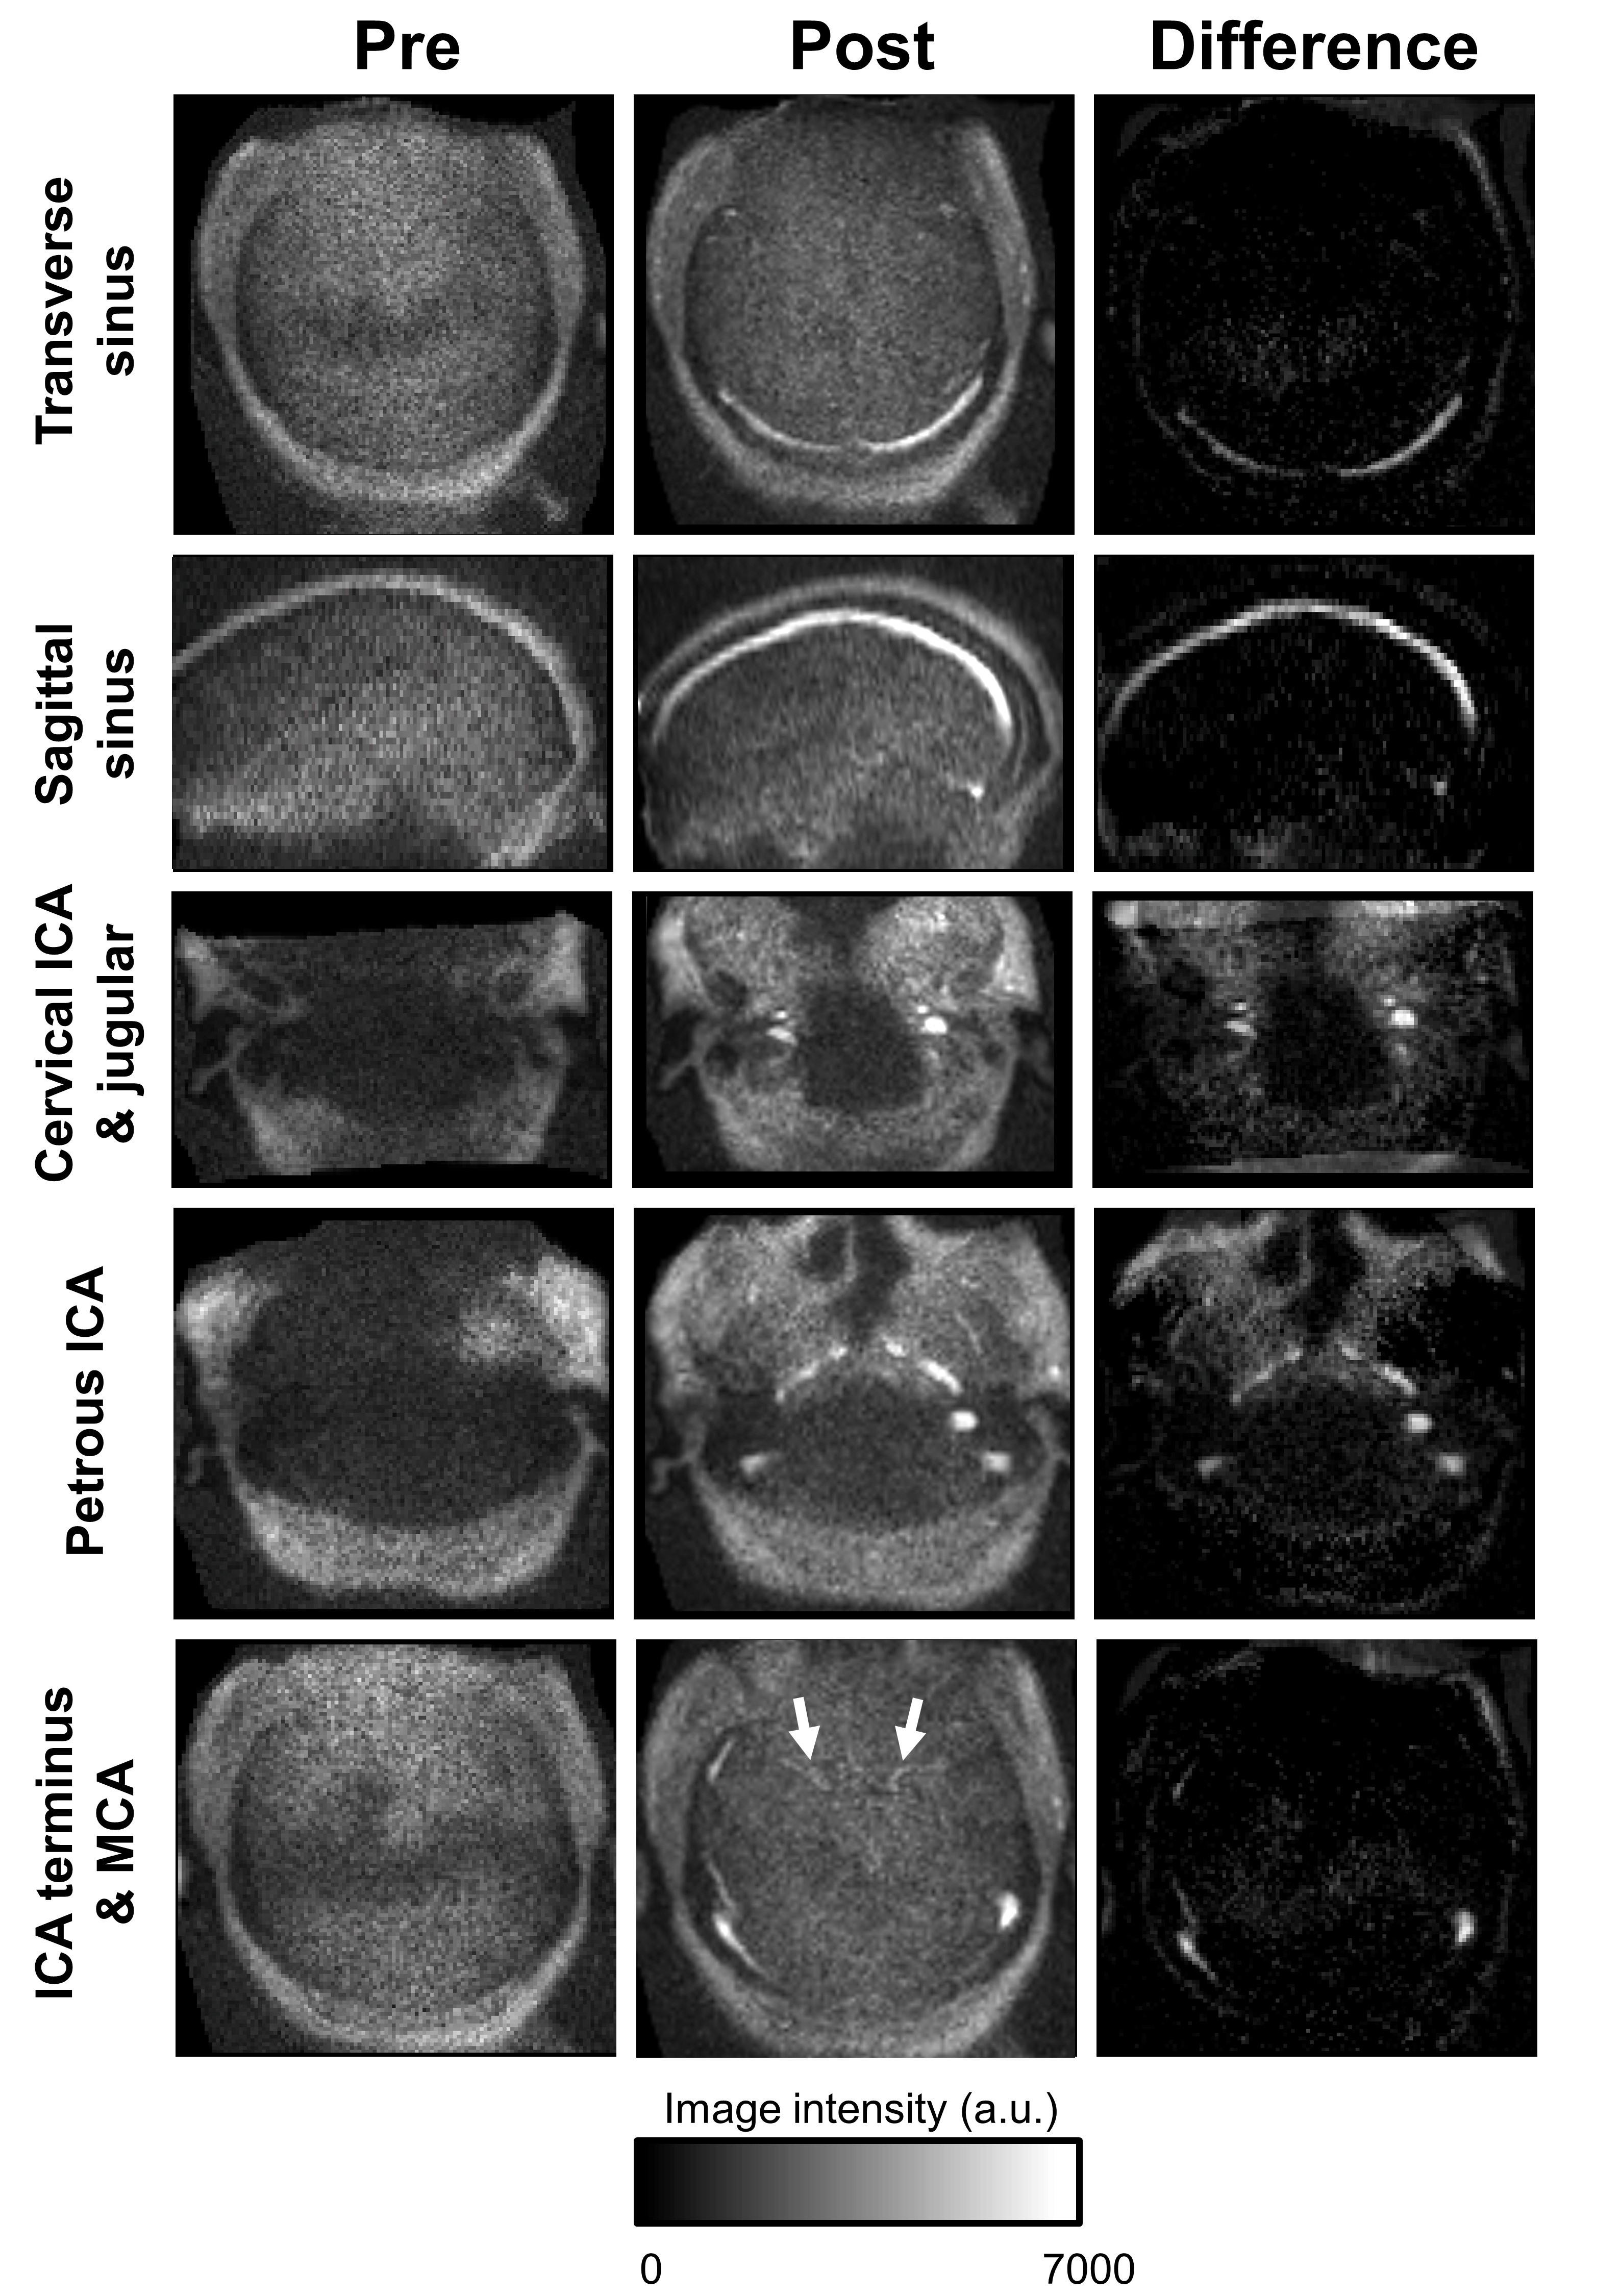
All images were acquired on a 64mT portable MRI system (Swoop, Hyperfine, Guilford, CT). To characterize relaxation properties, a phantom was created consisting of vials with varying dilutions of stock ferumoxytol (510 mg of iron/17 mL) reflecting expected biological concentrations7,8 and one vial of 2 mM of gadolinium contrast as a reference. The phantom holder was filled with copper sulfate. T1 mapping was performed using a fast spin-echo T1-weighted sequence (TR=3 s, TE=6.16 ms), sampling inversion times between 1-800 ms. T2 mapping was achieved with a fast spin-echo T2-weighted sequence (TR = 1 s, echo train length = 40), sampling ten different echo times ranging from 6-228 ms. Resolution was 1.5 x 1.5 x 5 mm3. Fitting was performed on a voxel-by-voxel basis and average T1 and T2 calculated over a region of interest in each vial. Human subject imaging was approved by the Institutional Review Board of the University of Pennsylvania. Two patients receiving ferumoxytol as part of standard clinical care for iron-deficiency anemia were recruited for this study. Ferumoxytol was administered as a 15-minute infusion and patients were monitored for adverse reactions for 30 minutes afterwards following dosing and administration guidelines. Participants were scanned before infusion and immediately after the monitoring period. Both participants received the following 3D fast spin-echo scans optimized for typical brain tissue contrasts: T1-weighted (TE=6.16 ms, TR=1500 ms, TI=300 ms, scan time=4:52 min, average =1, resolution =1.5x1.5x5 mm3), T2-weighted (TE=252.56, TR=2200 ms, scan time= 7:01 min, average =1, resolution =1.5x1.5x5 mm3), and FLAIR (TE=227.55, TR=4000, TI= 1400, average = 1, scan time 9:29 min, resolution: 1.6x1.6x5 mm3). One patient received an additional angiographic sequence optimized for ferumoxytol contrast: T1-weighted spoiled gradient echo (flip angle=60 degrees, TE=5.17 ms, TR=10.34 ms, averages =6, scan time 5:43 min, resolution 1.5x1.5x3 mm3). To isolate the contrast effects, pre- and post-infusion images were co-registered and then subtracted (post minus pre). Contrast in the venous system was segmented using ITK-SNAP software9.Results
In phantom experiments, we characterized the T1 and T2 values for several concentrations of ferumoxytol as well as a typical concentration of gadolinium (Fig. 1). Over the spectrum of biologically plausible concentrations, ferumoxytol exhibited a large, dynamic range in T1 and T2 relaxation rates (Table 1). The 2mM reference vial of the gadolinium agent had T1/T2 relaxation rates similar to a 1/3000 dilution of ferumoxytol. In imaging patients with scans optimized for brain tissue, ferumoxytol generated contrast most evident in venous structures, with modest positive contrast in T1-weighted scans (Fig.2, top row) and more pronounced negative contrast on T2-weighted (middle) and FLAIR (bottom) scans for intrinsically hyperintense veins. Segmentation of the venous system on FLAIR difference imaging (pre-minus-post) clearly delineates the sagittal, transverse, straight and sigmoid sinuses and jugular veins (Fig. 3). On the T1-weighted angiography sequence, contrast enhancement was evident in both venous and arterial structures (Fig. 4). Visible venous structures were similar to those observed on T2/T2-FLAIR, while internal carotid artery segments could be seen, and anterior and middle cerebral arteries faintly appreciated.Discussion and Conclusion
These initial results demonstrate the promise of ferumoxytol as a contrast agent for low-field MRI systems. This and similar iron oxide agents have been tested in a variety of low-field and ultra-low-field systems in phantoms and rodent models; however, to our knowledge these are the first in human results for a scanner with < 0.1T. Our study addresses the feasibility of using this FDA approved contrast agent on a low-field portable MRI system and offers exciting potential for clinical translation in assessment of cerebrovascular disease. Experiments with ferumoxytol may also inform imaging with gadolinium agents. Future directions include additional optimization of these as well as T2*-weighted sequences and exploration of delayed phase imaging for visualization of brain lesions.Acknowledgements
We thank Hyperfine Research for the use of their low-field MRI scanner and the Penn Neuroradiology Research Core for assisting with patient recruitment and scanning. This work was supported by the NIH (T32NS091006-01), the HHMI-NIBIB Interfaces Initiative (5T32EB009384-10), Jonathan and Bonnie Rothberg, The Mirowski Family Fund, and Neil and Barbara Smit.References
1. Ogbole GI, Adeyomoye AO, Badu-Peprah A, Mensah Y, Nzeh DA. Survey of magnetic resonance imaging availability in West Africa. Pan Afr Med J. 2018;30. doi:10.11604/pamj.2018.30.240.14000
2. Rooney WD, Johnson G, Li X, et al. Magnetic field and tissue dependencies of human brain longitudinal 1H2O relaxation in vivo. Magn Reson Med. 2007;57(2):308-318. doi:10.1002/mrm.21122
3. Pohmann R, Speck O, Scheffler K. Signal-to-noise ratio and MR tissue parameters in human brain imaging at 3, 7, and 9.4 tesla using current receive coil arrays. Magn Reson Med. 2016;75(2):801-809. doi:10.1002/mrm.25677
4. Marques JP, Simonis FFJ, Webb AG. Low‐field MRI: An MR physics perspective. J Magn Reson Imaging. 2019;49(6):1528-1542. doi:10.1002/jmri.26637
5. Toth GB, Varallyay CG, Horvath A, et al. Current and potential imaging applications of ferumoxytol for magnetic resonance imaging. Kidney Int. 2017;92(1):47-66. doi:10.1016/j.kint.2016.12.037
6. Waddington DEJ, Boele T, Maschmeyer R, Kuncic Z, Rosen MS. High-sensitivity in vivo contrast for ultra-low field magnetic resonance imaging using superparamagnetic iron oxide nanoparticles. Sci Adv. 2020;6(29):1-10. doi:10.1126/sciadv.abb0998
7. Wei H, Bruns OT, Kaul MG, et al. Exceedingly small iron oxide nanoparticles as positive MRI contrast agents. Proc Natl Acad Sci U S A. 2017;114(9):2325-2330. doi:10.1073/pnas.1620145114
8. Gharagouzloo CA, McMahon PN, Sridhar S. Quantitative contrast-enhanced MRI with superparamagnetic nanoparticles using ultrashort time-to-echo pulse sequences. Magn Reson Med. 2015;74(2):431-441. doi:10.1002/mrm.25426
9. Yushkevich PA, Piven J, Hazlett HC, et al. User-guided 3D active contour segmentation of anatomical structures: Significantly improved efficiency and reliability. Neuroimage. 2006;31(3):1116-1128. doi:10.1016/J.NEUROIMAGE.2006.01.015
Figures