1249
Comprehensive multiparametric cardiac MRI tissue phenotyping (LGE, T1, T2, DWI, BOLD & VAI) of acute myocardial infarction in swine1Cardiovascular Research Center, Massachusetts General Hospital, Boston, MA, United States, 2Department of Radiology, University Medical Center Groningen, Groningen, Netherlands, 3A.A. Martinos Center for Biomedical Imaging, Massachusetts General Hospital, Boston, MA, United States, 4Department of Diagnostic Physics, Oslo University Hospital, Oslo, Norway, 5Department of Nuclear Medicine and Molecular Imaging, University Medical Center Groningen, Groningen, Netherlands
Synopsis
Myocardial infarction (MI) and ischemic reperfusion (IR) injury are a common western world problem and are aimed to be better understood by imaging techniques to enable non-invasive longitudinal follow up. Novel MRI based techniques, such as cardiac DWI, BOLD and VAI, are emerging and detailed assessment and comparison with current golden standard and histology is needed to determine their role in treatment planning and revalidation of MI patients. Here we show that specifically BOLD can be used as an early marker in the acute MI phase.
Introduction
Myocardial infarctions (MI) are a common phenomenon in the western world, but survival rates are increasing. While acute reperfusion treatments reduce the number of deaths caused by acute occlusions, it remains challenging to predict a patient’s recovery in the early stage of MI. Magnetic resonance imaging (MRI) one of the non-invasive and innovative tools used to determine the tissue characteristics after MI to identify potential markers that could predict long term clinical outcomes. However, in the early acute MI state the ischemic reperfusion (IR) injury leads to similar readouts for most common cardiac MRI techniques, which makes it difficult to determine early markers that could differentiate in potentially viable tissue or certainly future non-functional tissue. Here, we compare several novel MRI techniques that enable determination of vascular reactivity by using a cardiac blood level dependent imaging technique (BOLD) [1], the vascular architecture (VAI) using gadolinium perfusion [2,9], the tissue diffusivity using diffusion weighted imaging (DWI) [3], with more conventional techniques including late gadolinium enhancement (LGE) [4], T1 [5,7] and T2 mapping [6].Methods
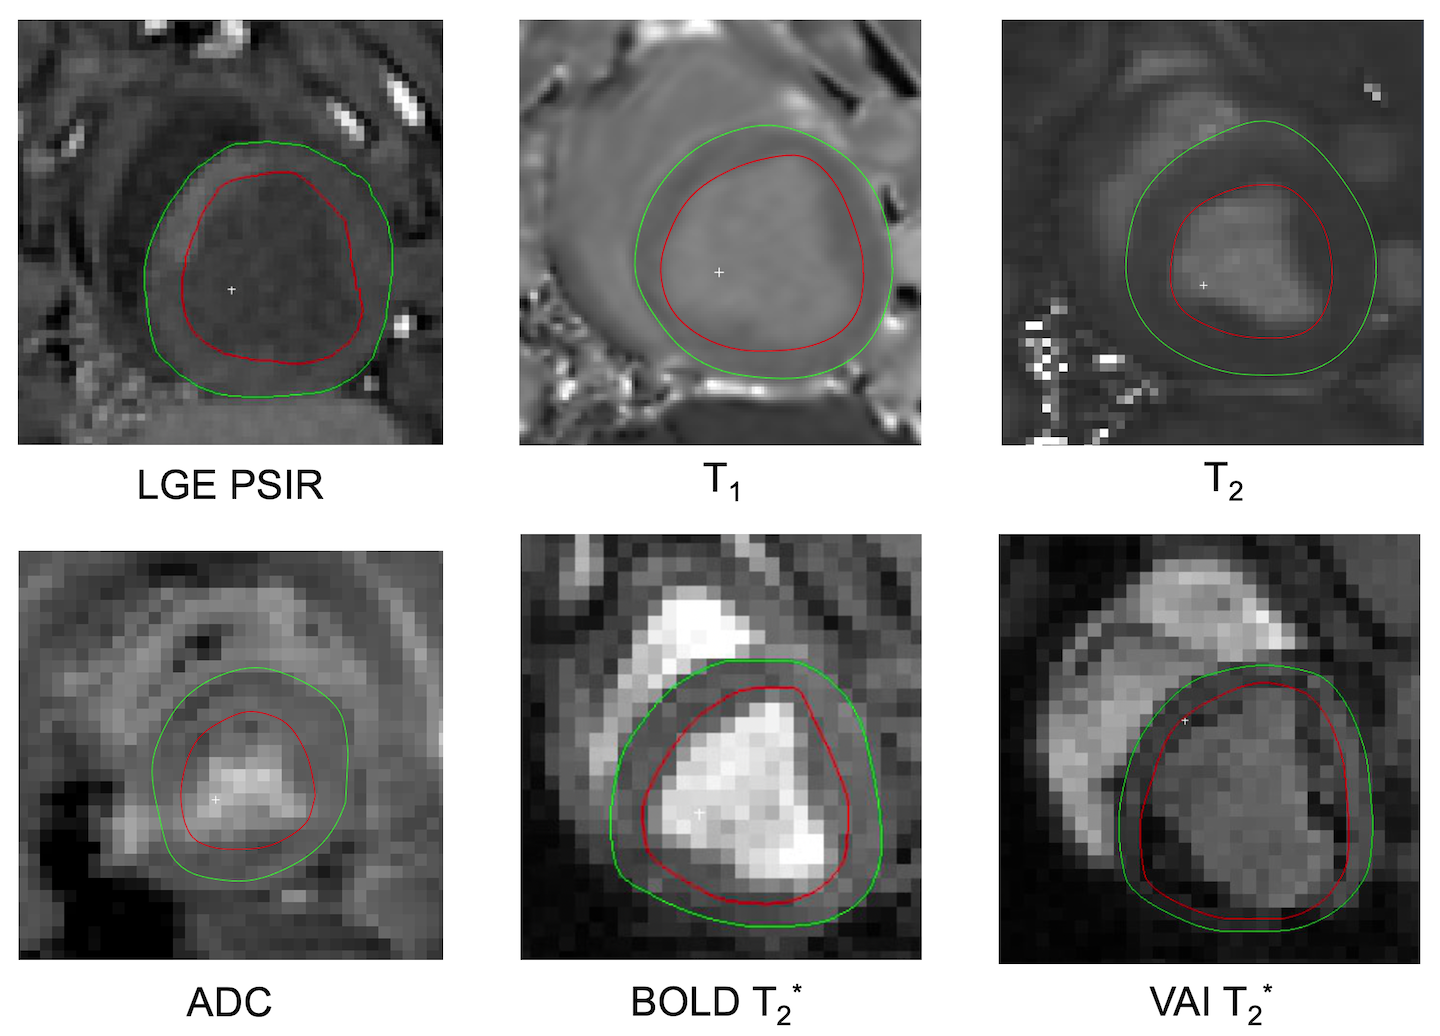
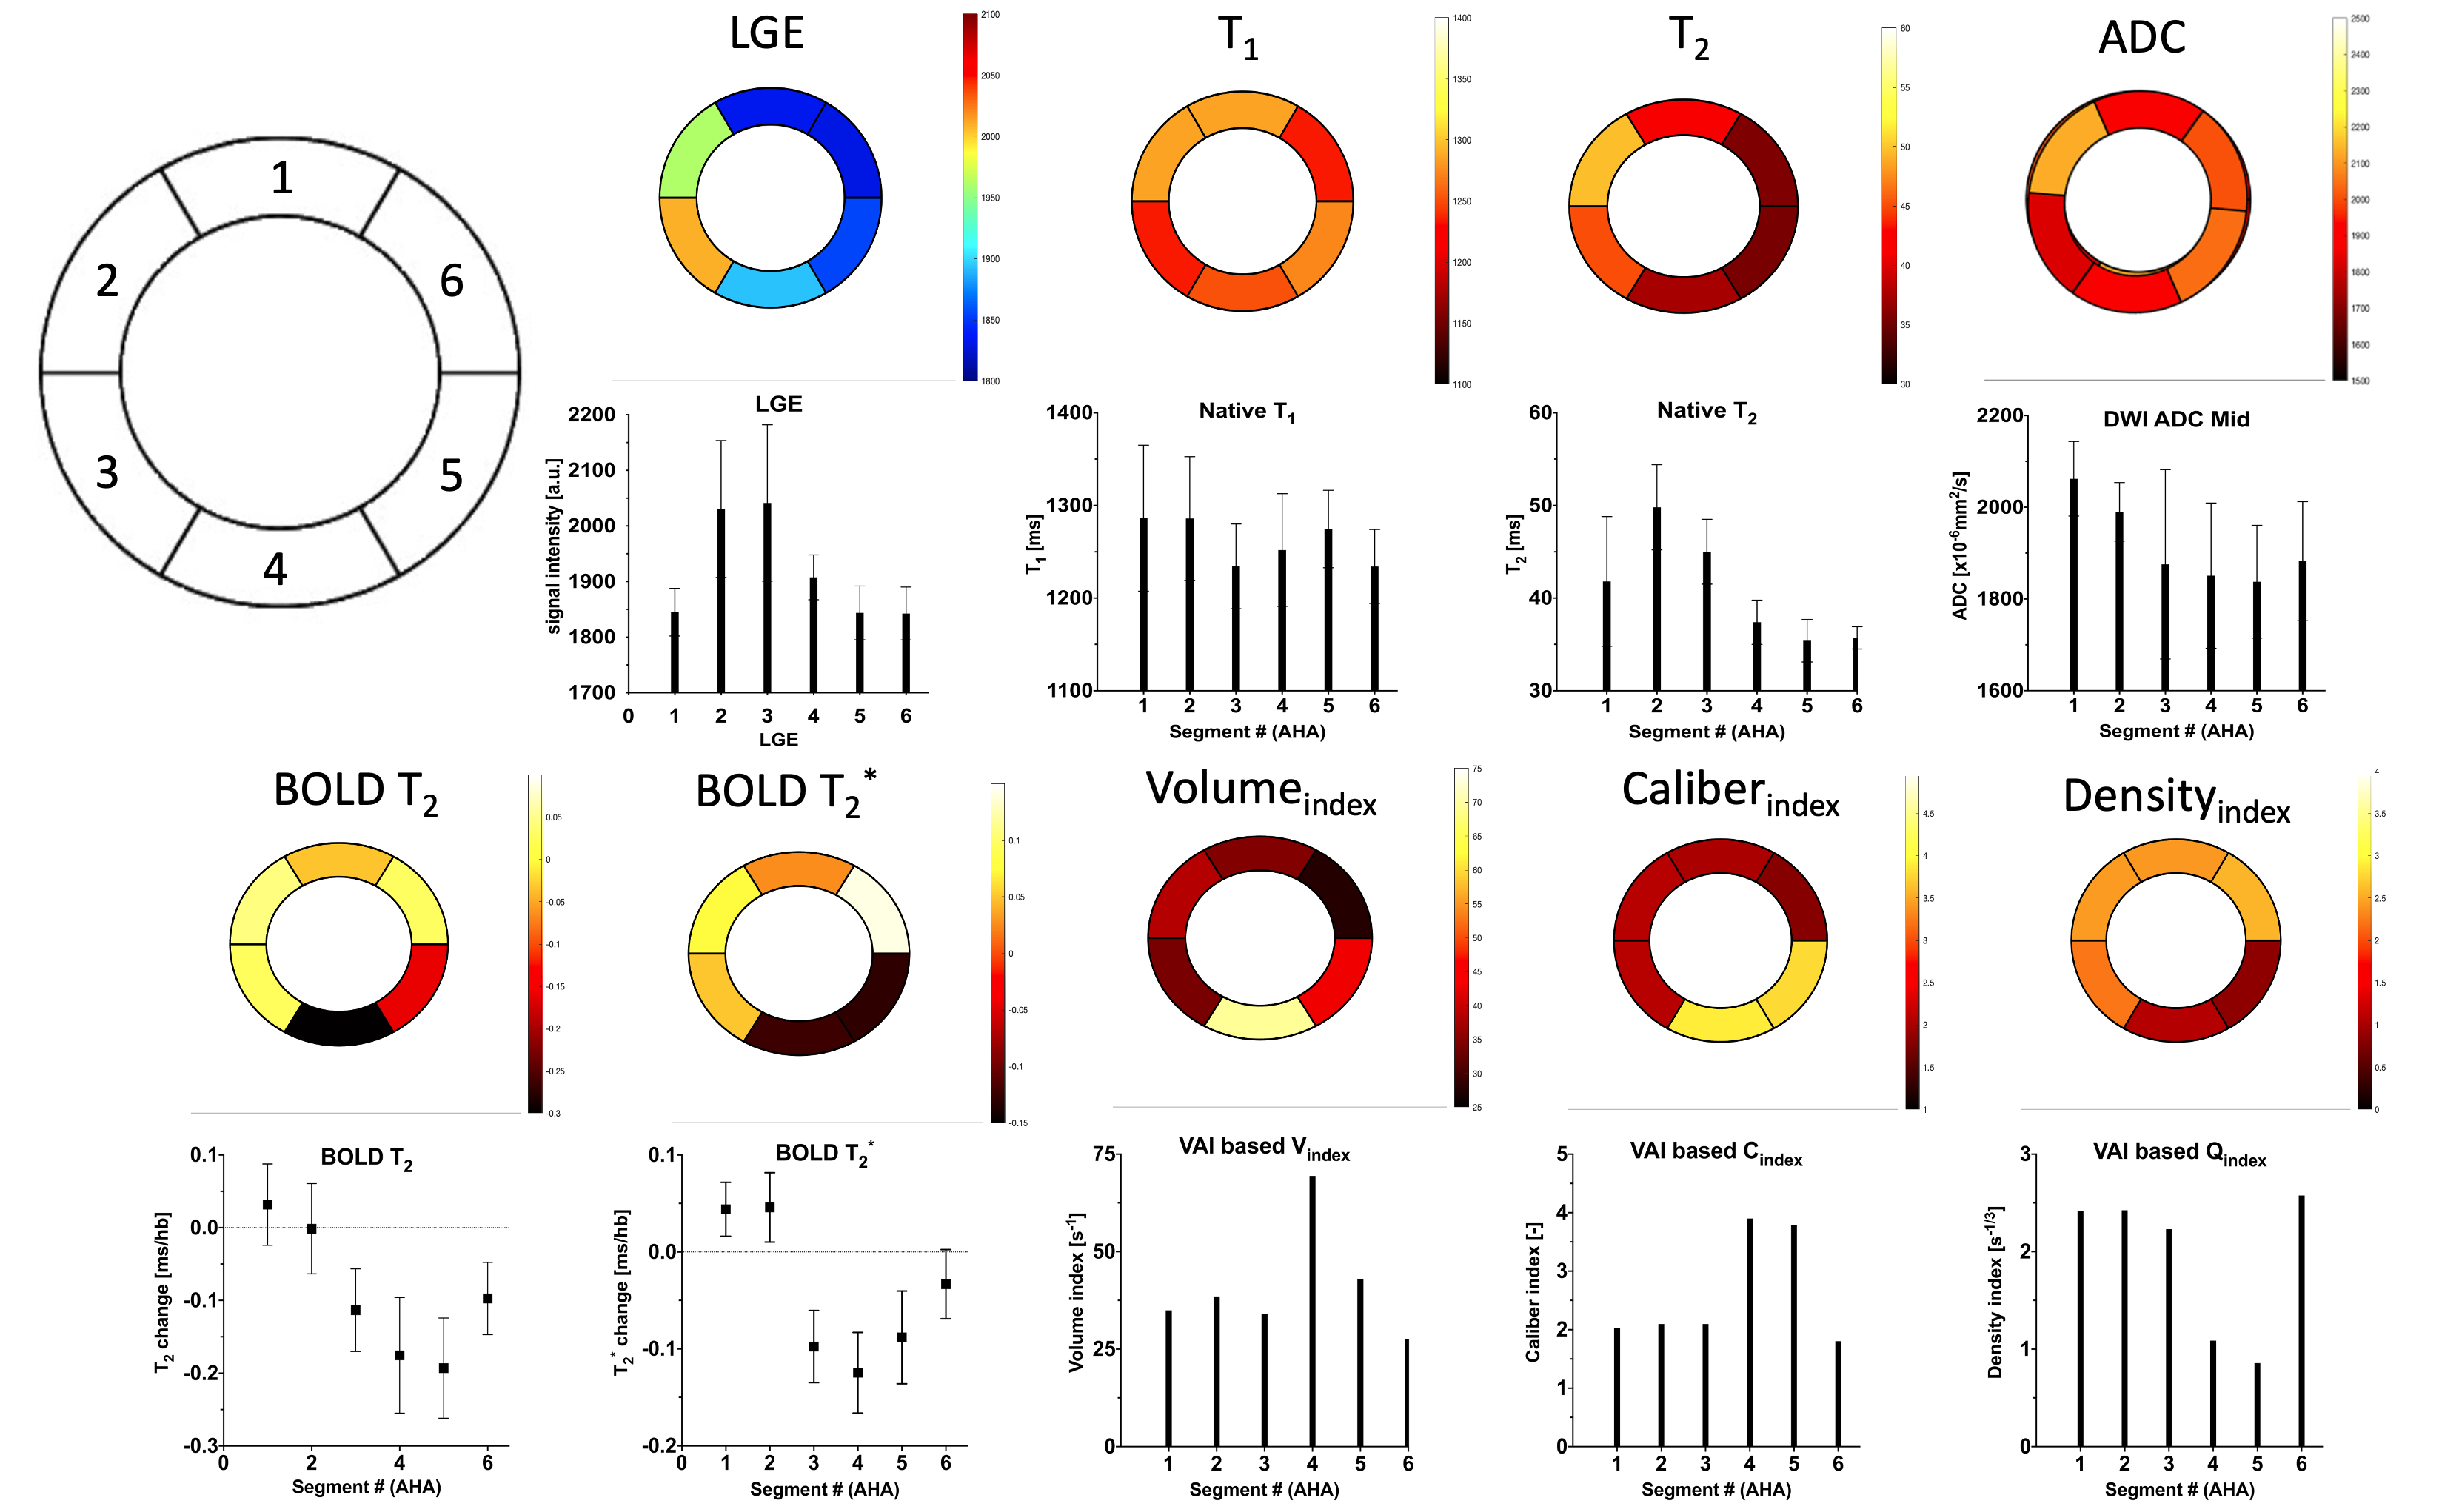
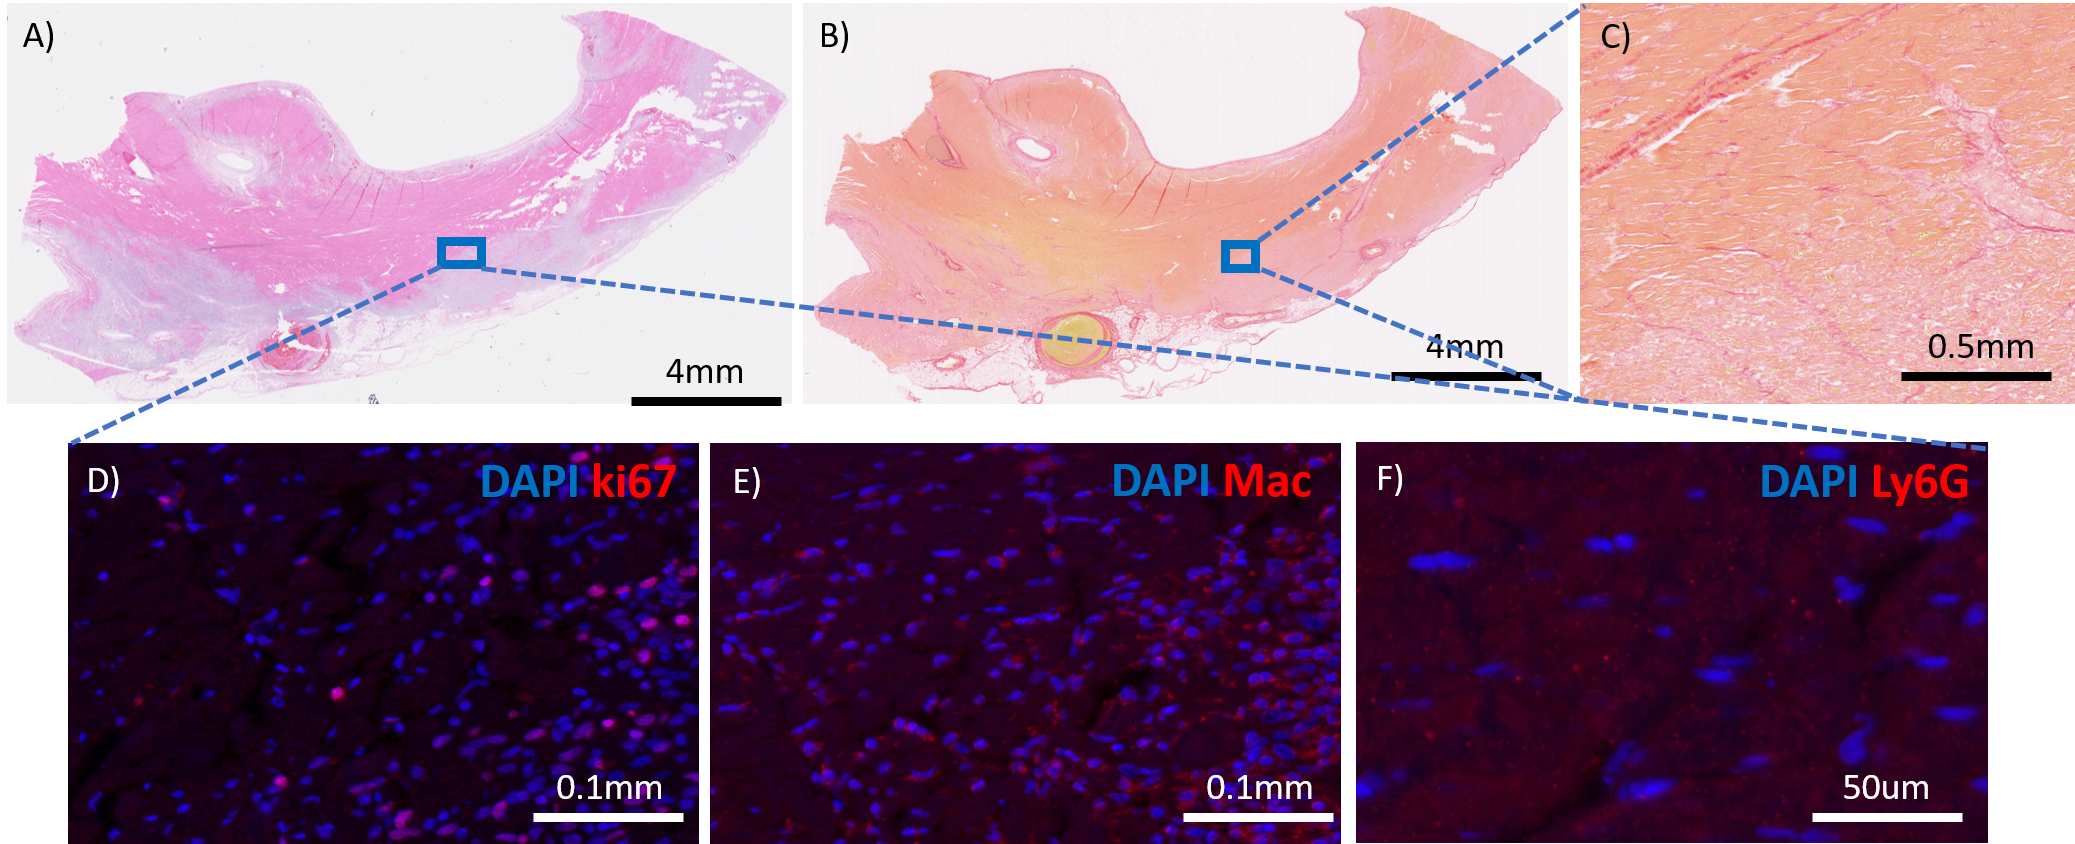
MI was induced in five Yorkshire swine by occlusion of the LAD for up to 80 minutes with a catheter balloon (figure 1). Animals were scanned with a 3T Biograph mMR 3-4 days post-surgery using standard ShMOLLI based T1 mapping [7], FLASH based T2 mapping [8] and LGE [4]. In addition, advanced DWI [3], BOLD [1] and VAI [9] were acquired using recently published sequences and post processing techniques. Each of these images were manually segmented using Segment (Medviso, Lund, Sweden) and polar plots were then generated for the mid-ventricular slice with 6 mid-ventricular AHA based segments using Matlab (The Math Works, Inc. MATLAB, version r2019b. Natick, MA). Statistical analysis was performed with Prism v8.0 Graphpad to determine any significant change in the reported parameters between remote and infarcted segments using a student-t test and estimation plots were generated. Furthermore, infarct segments were determined based on a SI increase of >2SD compared to a lateral remote segment. After the in-vivo MRI, one heart was fixated and a midventricular tissue section from the infarct zone was taken corresponding to the MRI based LGE core. Immunofluorescence (IF) histological staining of mitotic cells (ki67), neutrophils (Ly6G) and macrophages (Mac) was performed in combination with DAPI staining on 3 consecutive paraffin embedded slides of 5um thickness. After fluorescence microscopic imaging, the same slides were H&E stained and an additional slide was stained with picosirius red to determine the extent of fibrosis.Results and Discussion
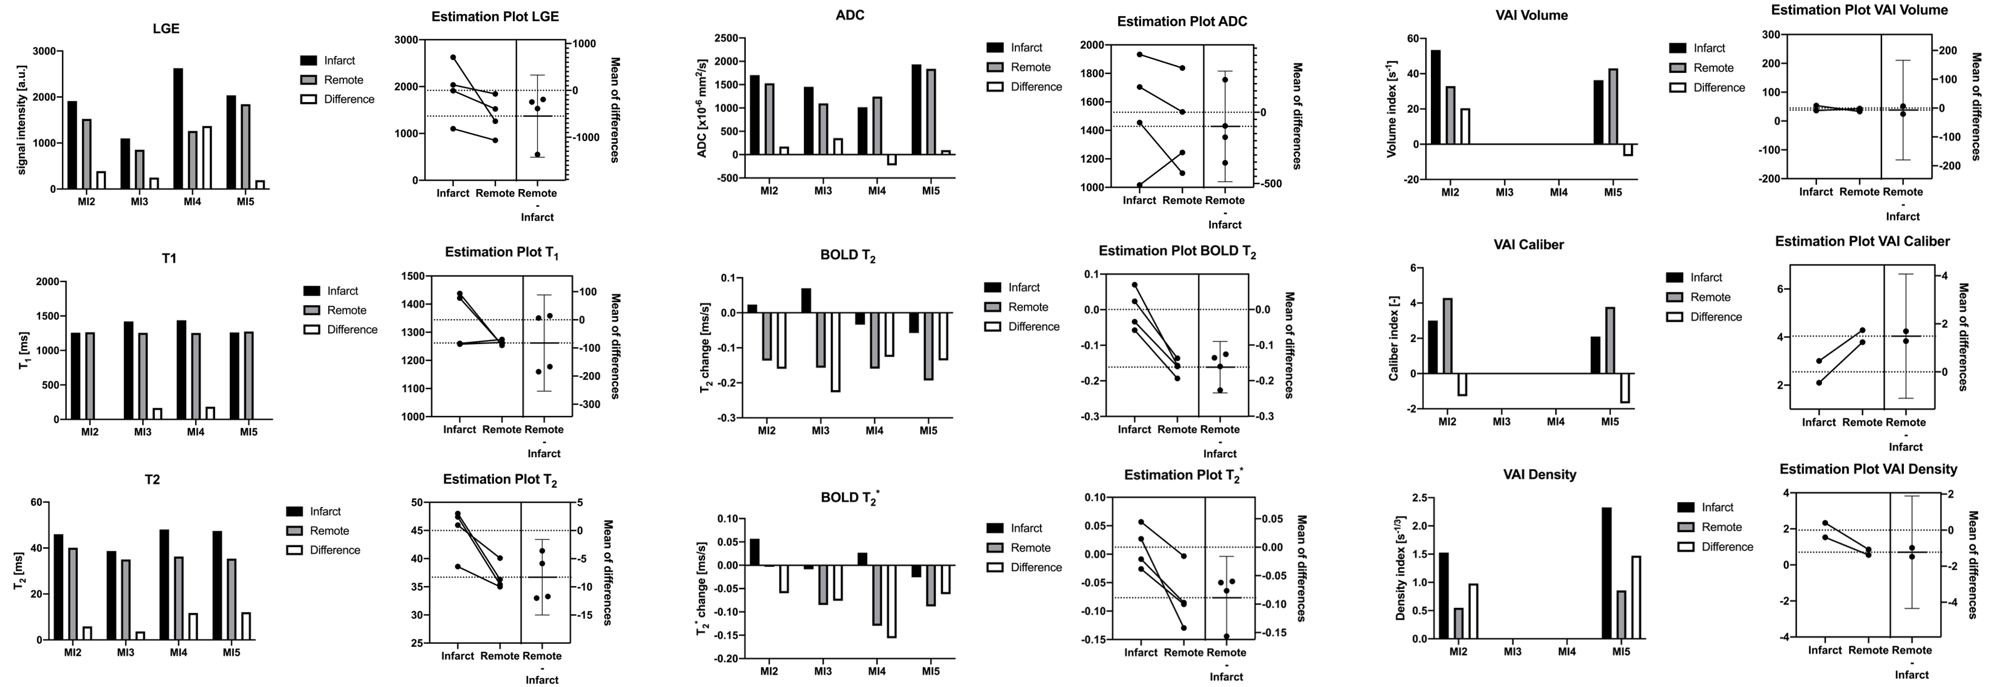
Total occlusion times varied between the animals with MI2 80mins, MI3 30mins, MI4 30+50mins, and MI5 80 mins. One animal did not survive the surgery. Figure 2 depicts the acquired images of one animal with the corresponding polar plots of the same animal in Figure 3. In that example, the segment 5 was considered the remote with segment 2 and 3 as infarcted segments. In comparison with the corresponding remote segment, the infarct segments showed no significant change in T1 or ADC values. However, a significant increase in T2 and vascular density index, and a decreased vascular volume and caliber index were detected. Additionally, a significant difference in T2 and T2* based BOLD change was detected. The acquired values for all animals are shown in figure 4 with an overall significant change in T2 and both BOLD readouts in the acute MI segments. The H&E staining showed a strong necrotic tissue in the core of the infarct (figure 5a) with only presence of diffuse fibrosis (figure 5b-c), which can explain the only small T1 changes seen in the infarct segments. The IF histology shows an increase in mitotic cells in the boarders surrounding the infarcted tissue (figure 5d), as well as an increase in macrophages (figure 5e). Furthermore, a scattered presence of neutrophils (figure 5f) can be seen inside the necrotic tissue as well as in the boarders. These findings confirm the strong inflammatory response indicated by T2 mapping as well. Furthermore, we hypothesize that the vasculature in the infarct zone is already maximally delated to facilitate the supply for inflammatory cells and extort their waste products. However additional histological validation is needed to determine the vascular structure and its correlation with the VAI based indices and BOLD responses before any conclusions can be drawn.Conclusion
Most parametric mapping approaches are inconsistent for the wide range of IR injuries studied here. However, due to the wide range of different occlusion times, such variation in these markers can be expected and should be further validated with histology to confirm the observed change. We have seen that BOLD and T2 are the only consistent and significant markers for infarcted segments which indicates a compromised vascular responsiveness in the whole heart and edema formation due to the inflammatory response in the infarct zone. Future work will correlate histology with the multiparametric cardiac MRI results to better contextualize the mechanisms behind each imaging technique.Acknowledgements
This work was supported in part by the Dutch Heart Association (2016T042) and by NIH research grants: R01HL135242, R01HL151704References
References
1. van den Boomen, M. et al. Blood Oxygen Level–Dependent MRI of the Myocardium with Multiecho Gradient-Echo Spin-Echo Imaging. Radiology 294, 538–545 (2020).
2. van den Boomen, M. et al. Vessel architectural imaging in the human heart using heartbeat-to-heartbeat GESE-EPI. ISMRM 2020.
3. Nguyen, C. et al. Free‐breathing diffusion tensor MRI of the whole left ventricle using second‐order motion compensation and multitasking respiratory motion correction. Magn. Reson. Imaging. In Press (2020).
4. Amado, L.C. et al. Accurate and Objective Infarct Sizing by Contrast-Enhanced Magnetic Resonance Imaging in a Canine Myocardial Infarction Model. J. Am. Coll. Cardiol. 44(12), 2383-9 (2004).
5. van den Boomen, M. et al. Native T1 reference values for nonischemic cardiomyopathies and populations with increased cardiovascular risk: A systematic review and meta‐analysis. J. Magn. Reson. Imaging 47, 891-912 (2018).
6. Snel, G.J.H. et al. Cardiovascular magnetic resonance native T2 and T2* quantitative values for cardiomyopathies and heart transplantations: a systematic review and meta-analysis. J. Cardiovascular Magn. Reson. 22:34 (2020).
7. Messroghli, D.R. et al. Clinical recommendations for cardiovascular magnetic resonance mapping of T1, T2, T2* and extracellular volume: A consensus statement by the Society for Cardiovascular Magnetic Resonance (SCMR) endorsed by the European Association for Cardiovascular Imaging (EACVI). J. Cardiovascular Magn. Reson. 19:75 (2017).
8. Shivraman, G. et al. T2 quantification for improved detection of myocardial edema. J. Cardiovascular Magn. Reson. 11:56 (2009).
9. Emblem, K.E. et al. Vessel architectural imaging identifies cancer patient responders to anti-angiogenic therapy. Nat. Med. 19(9), 1178-83 (2013).
Figures