1248
Merging T1 weighted images with QSM provides a unique contrast for brain tissue segmentation in humans and non-human primates1Functional Imaging Laboratory, German Primate Center, Göttingen, Germany, 2Georg August Universität Göttingen, Göttingen, Germany
Synopsis
Automatic brain tissue segmentations mostly rely on T1 weighted images (T1w) which provide an excellent grey matter – to -white matter contrast but T1w lacks sufficient contrast for major subcortical nuclei. Particularly in non-human primates, these segmentation approaches encounter their limits. By merging T1w with Quantitative Susceptibility Mapping, a unique brain tissue contrast could be generated. TQ-SILiCON maps allowed for an improved subcortical nuclei classification while retaining the excellent white matter delineation of T1w. The approach works equally well for humans and non-human primates.
Introduction
Current automatic brain tissue segmentations mostly depend upon T1 weighted (T1w) images. T1w provides an excellent grey matter (GM) and white matter (WM) contrast but lack sufficient contrast for major subcortical GM nuclei such as the globus pallidus. This lack in contrast often leads to misclassification of major GM structures as part of the WM. In contrast, Quantitative Susceptibility Mapping (QSM), enhances the visibility of subcortical deep GM mainly based on the abundance of iron in these structures but provides only limited GM-to-WM contrast2,3. Thus, merging T1w and QSM may unite the best of both worlds. By keeping the acquisition time as short as possible, the study aimed to provide an acquisition protocol and analysis pipeline offering a unique brain tissue contrast equally suitable for automatic brain segmentation in basic research and clinical application.Methods
Data Acquisition: Three healthy adults (mean age: 27 years, male) and 3 long-tailed macaques (mean age: 8 years, female) were scanned at a field strength of 3 T (MAGNETOM Prisma, Siemens) using a 20 channel head coil and a circular single loop coil for signal detection, respectively. T1 weighted images and T2* weighted images were obtained using the MR parameters given below.Human: T1w: 3D MPRAGE, echo time/ repetition time (TE/TR) = 2.2/2400 ms, spatial resolution = 0.8 mm isotropic, flip angle (FA) = 8˚, and total acquisition time (TA) of 6.3 minutes. T2*w: 3D multi-echo gradient echo (ME-GRE) sequence, TE1/ spacing/ TE8 of 4.5/ 4.5/ 36 ms, TR = 41 ms, spatial resolution = 0.75 mm isotropic, FA = 20˚, and TA = 7 minutes.
Monkey: T1w: 3D MPRAGE, TE/TR = 2.7/2700 ms, spatial resolution = 0.5 mm isotropic, FA = 8˚, and TA = 17 minutes. T2*w: ME-GRE sequence, TE1/ spacing/ TE9/ TE10 of 3.7/ 4.9/ 43/ 50.4 ms, TR = 57 ms, spatial resolution = 0.31 mm isotropic, FA = 20˚, and TA = 24 minutes.
Data analysis: Human and monkey brain T1w images were denoised and bias field corrected using ANTs. Brain masks were generated on T1w using the ITK-SNAP tool. The mean of the ME-GRE images across echo times (mGRE) was linearly registered to the subject T1w images using ANTs registration. Human and monkey brain QSM maps were reconstructed using coil combined ME-GRE phase and magnitude data. This QSM reconstruction was based on the multi-scale dipole inversion algorithm1. Preprocessed T1w image and QSM map were fused by a weighted linear combination. Weights were generated randomly between the ranges -1 to 1 for each contrast (c). T1 signal intensities and QSM values (X) were normalized to range between 0 and 1 before feeding into the fusion generation equation (c = 0; 1). $$Y_i = \sum_{c = 0}^{1}{{W_{i_C} \ X_c}}$$ The resultant fused images were evaluated based on structural similarity index and linear discriminant analysis (LDA). For LDA, four tissue classes (cortical GM + WM + CSF + subcortical GM, based on the manual drawing) served as labels in the model training, and the accuracy of the model was used to select the most promising combinations. Three-class tissue segmentation (inside the T1 brain mask) was performed using ANTs Atropos resulting in CSF, GM, and WM segmentation mask together with their probabilistic maps.
Results
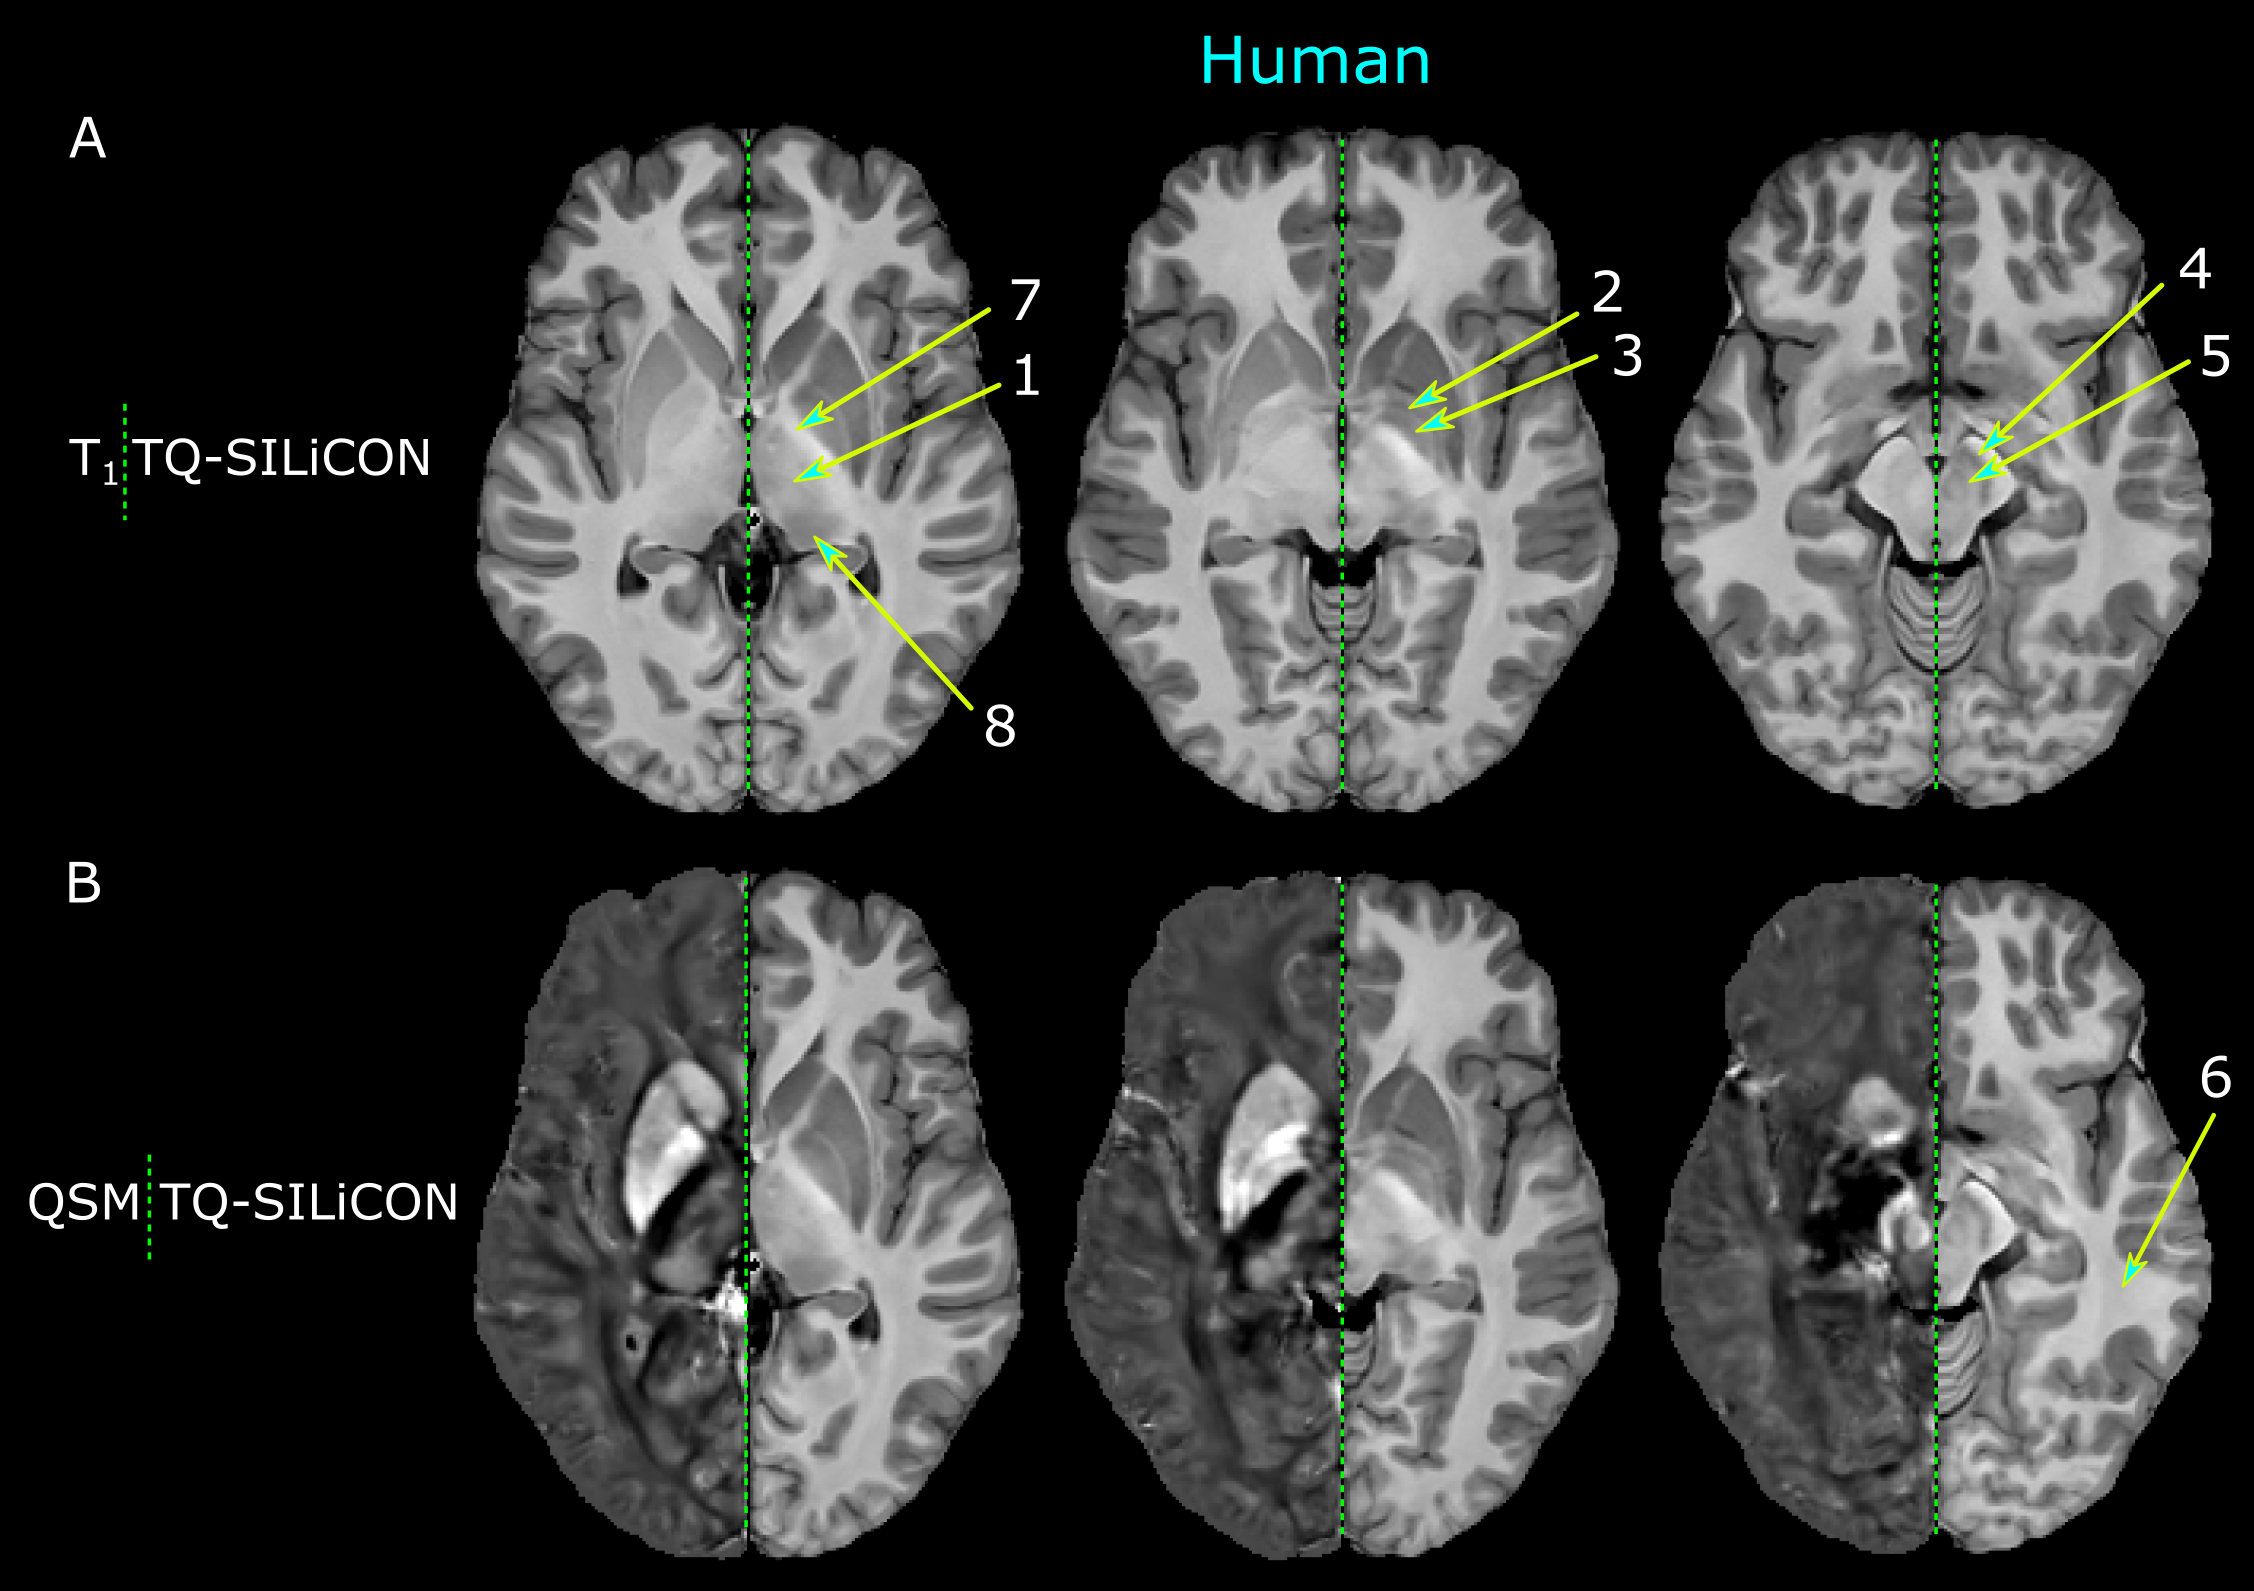
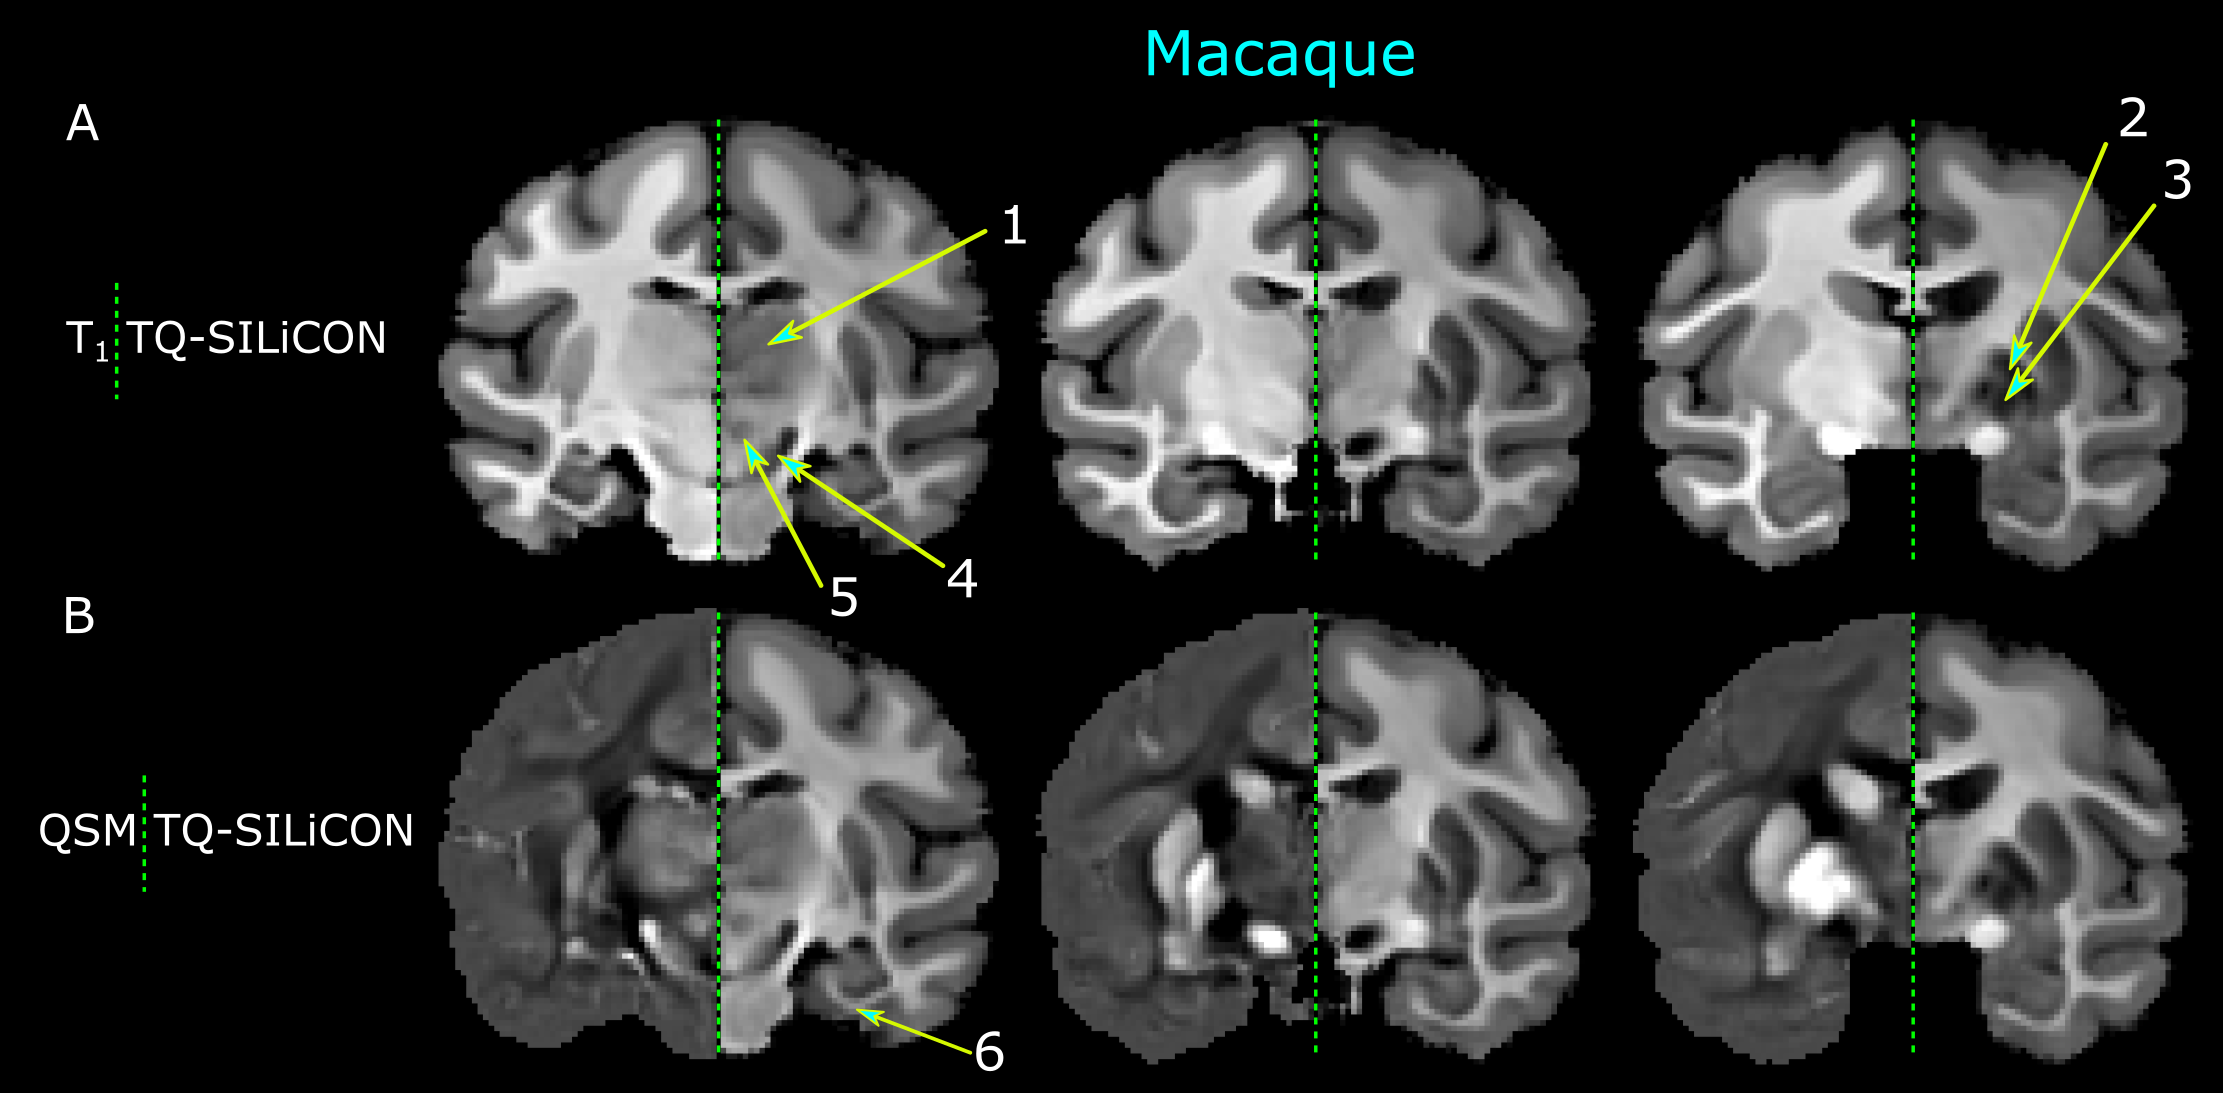
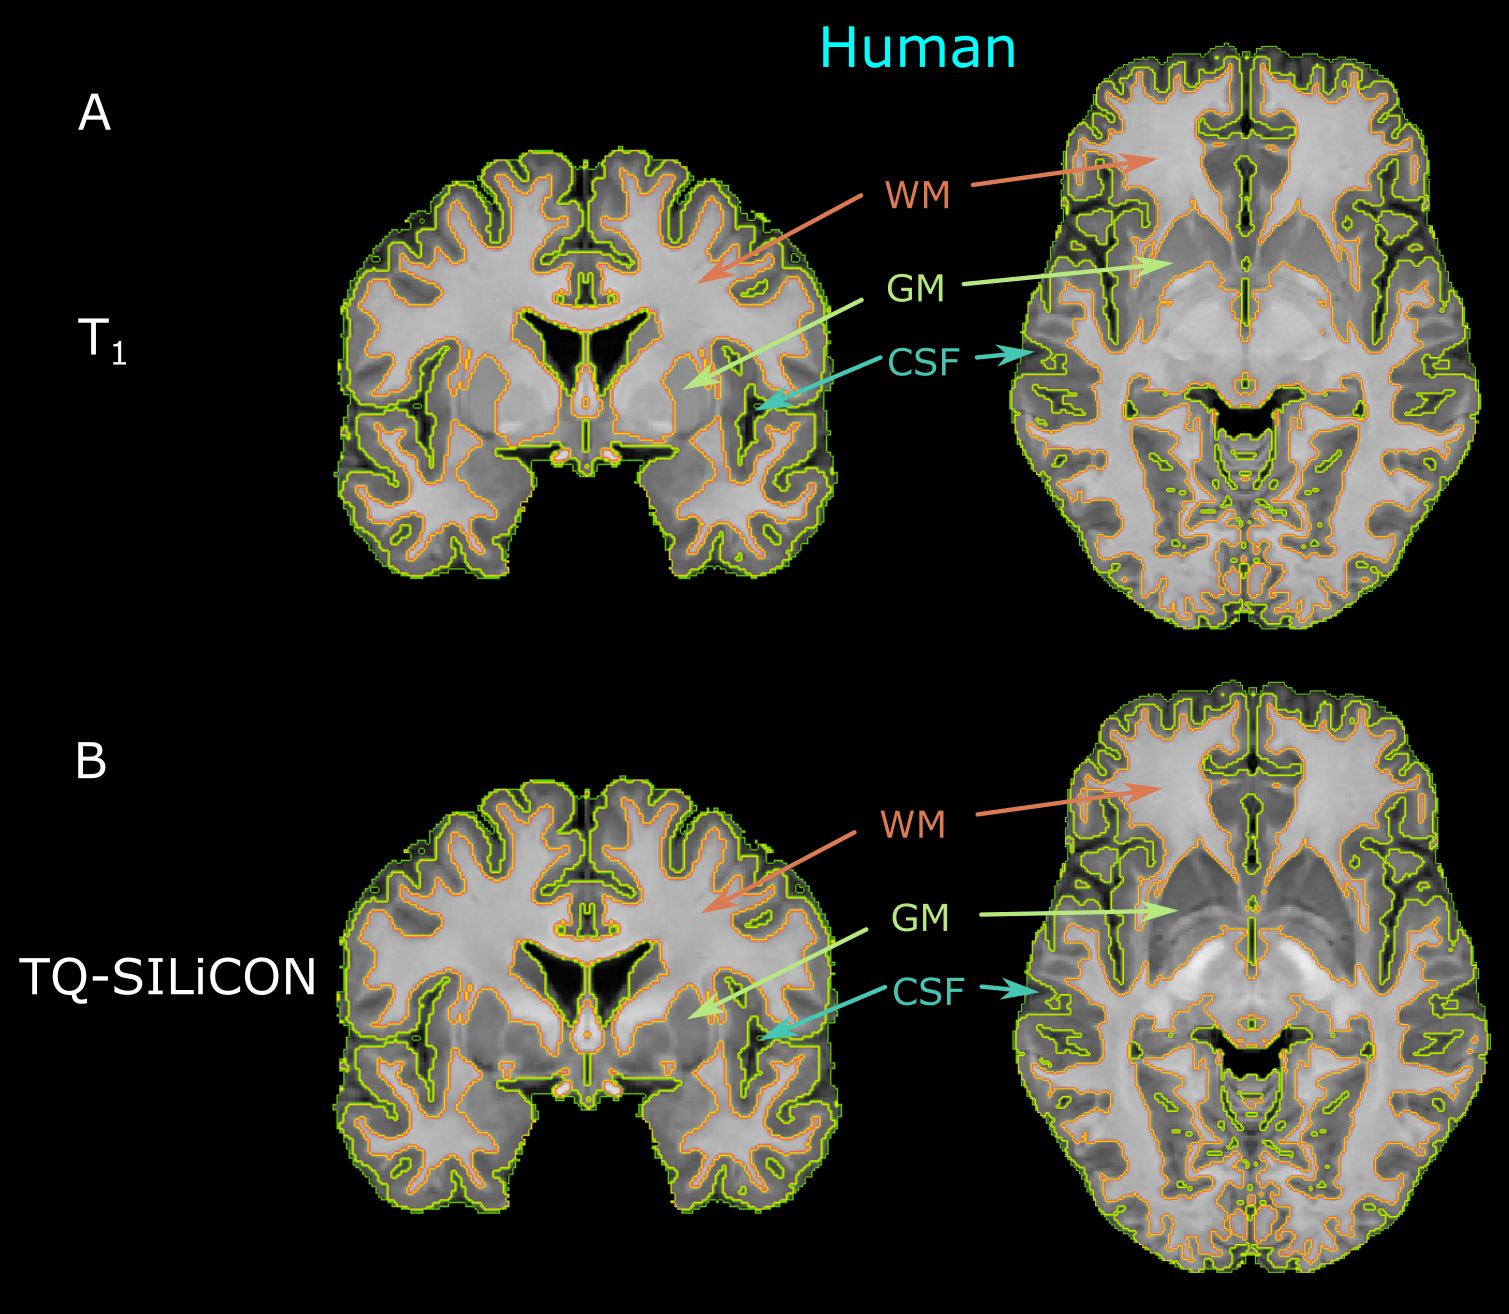
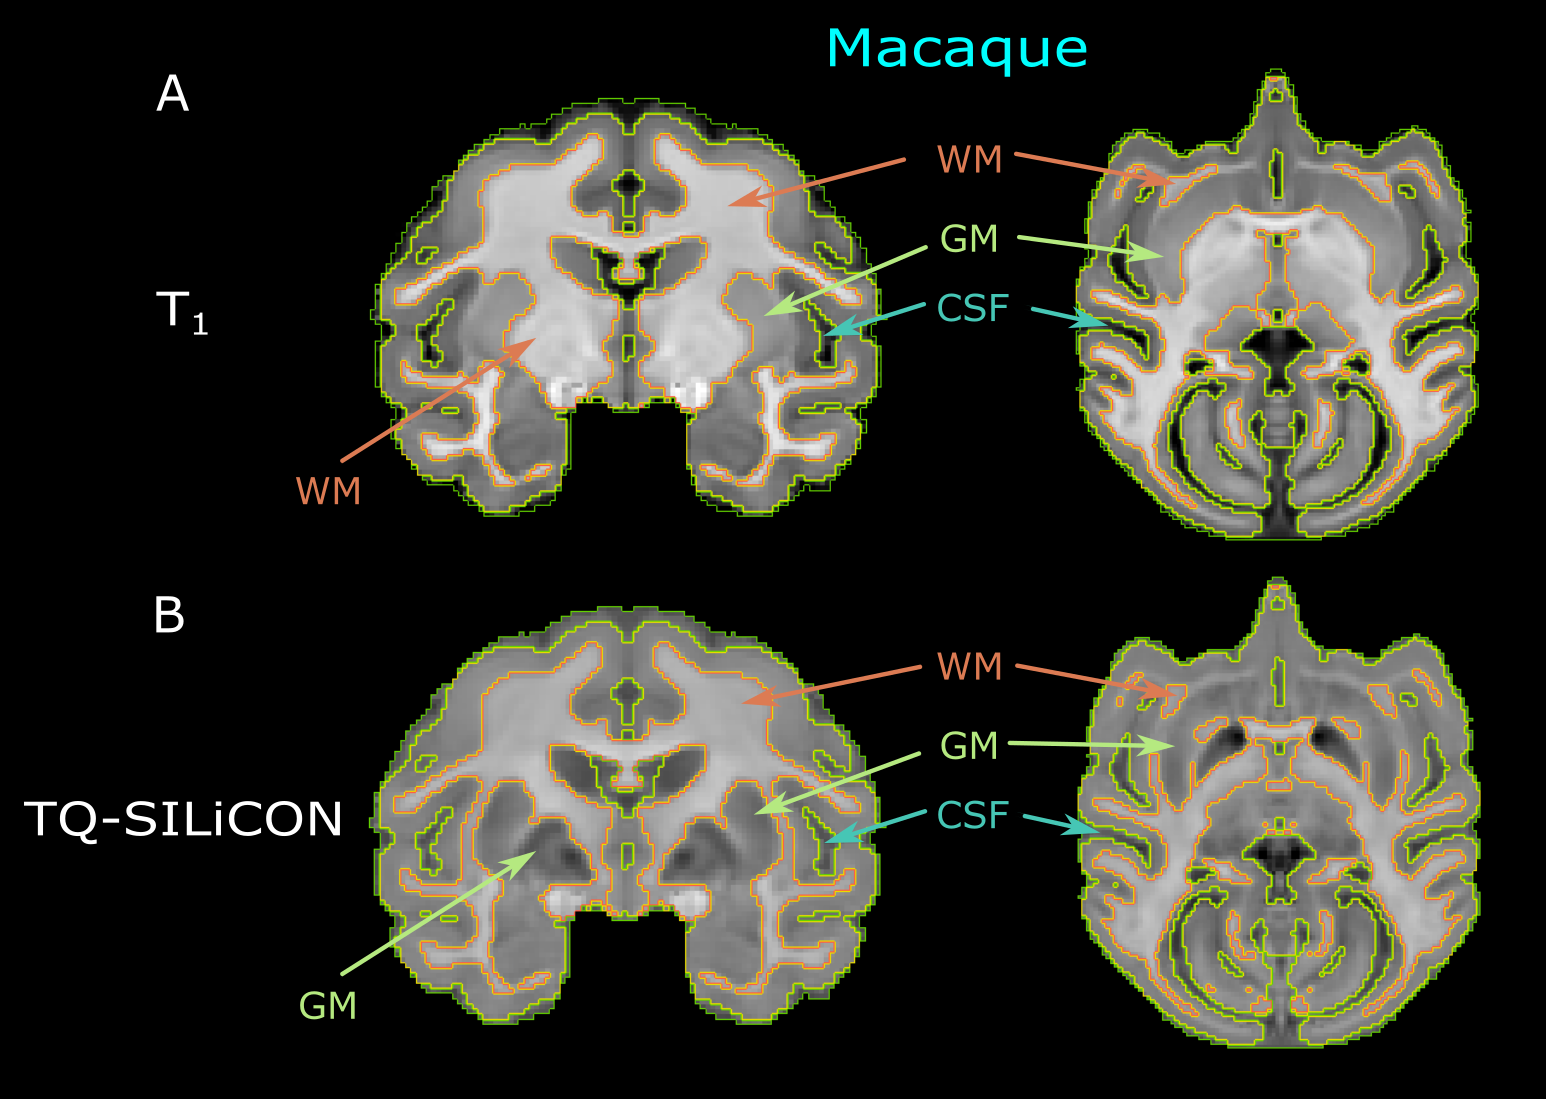
The single-subject human and macaque fusion images are shown in Figure 1 and Figure 2 were generated using the weights of 0.318 and -0.790 for T1w and QSM, respectively. Compared to the single contrast TQ-SILiCON maps (T1-QSM Synthetic Images via Linearly-weighted combination of CONtrasts) provided both, an excellent GM-WM contrast as well as a clear delineation of subcortical structures. For instance, the globus pallidus, thalamus, pulvinar nucleus, substantia nigra, and the red nucleus are very well distinguishable from WM structures. As shown in Figure 3, T1 based tissue segmentation misclassified major parts of the subcortical nuclei as part of the WM (Figure 3A & 4A). TQ-SILiCON maps, in contrast, resulted in an improved subcortical nuclei classification (Figure 3B & 4B) while remaining the excellent white matter delineation. The approach worked equally well for humans and non-human primates which may further facilitate comparative and translational neuroimaging studies.Discussion and Concluison
Image synthesis based on multi-contrast MRI has currently become an emerging field of research. Due to limitations in measurement time, however, the acquired data sets need to be chosen with care. Here we propose a combination of T1w and QSM that significantly improved the quality of automatic brain segmentation, even in the case of a single loop coil and its respective steep sloping sensitivity profile. The linear combination of T1w and QSM facilitates an excellent delineation of the cerebral cortex, WM structures, and deep GM nuclei. With an acquisition time of 13 minutes, TQ-SILiCON may be suitable for application in human diagnostics. Moreover, the achieved improvement in the detection of several brain structures may be very valuable for research and treatment of many neurological disorders including monitoring in deep brain stimulation (DBS).Acknowledgements
We wish to thank Kristin Kötz for her technical assistance.References
1. Acosta-Cabronero, J., Milovic, C., Mattern, H., Tejos, C., Speck, O., Callaghan, M.F., 2018. A robust multi-scale approach to quantitative susceptibility mapping. Neuroimage 183, 7–24.
2. Liu, C., Wei, H., Gong, N.-J., Cronin, M., Dibb, R., Decker, K., 2015. Quantitative Susceptibility Mapping: Contrast Mechanisms and Clinical Applications. Tomography 1, 3–17.
3. Shmueli, K., Zwart, J.A. de, Gelderen, P. van, Li, T.-Q., Dodd, S.J., Duyn, J.H., 2009. Magnetic susceptibility mapping of brain tissue in vivo using MRI phase data. Magnetic Resonance in Medicine 62, 1510–1522.
Figures