1238
Changes of native T1, T1ρ, and T2 values during liver fibrosis in rats at 11.7T MRI1Department of Radiology, Xinhua Hospital, Shanghai Jiao Tong University School of Medicine, shanghai, China, 2Fudan University, Institute of Science and Technology for Brain-Inspired Intelligence, shanghai, China
Synopsis
The relaxation times (including T1, T2, and T1ρ) are tissue-specific parameters , and depend on the physical, chemical and biological characteristics of the tissue. In liver fibrosis, the deposition of macromolecules (such as collagen fibers, proteoglycans, etc.) in the extracellular matrix may affect the movement of free protons, resulting in tissue relaxation times change. Many studies have shown that native T1 and T2 values are related to the degree of liver fibrosis. We investigate the influence of different pathological changes on T1 mapping, T1ρ, and T2 mapping in two vivo animal models of liver fibrosis, with a focus on liver fibrosis.
Purpose
Purpose: To investigate the influence of different pathological changes on T1 mapping, T1ρ, and T2 mapping in two vivo animal models of liver fibrosis, with a focus on liver fibrosis, and further to explore the accuracy of the quantitative parameters for staging liver fibrosis at 11.7T magnetic resonance imaging (MRI).Methods
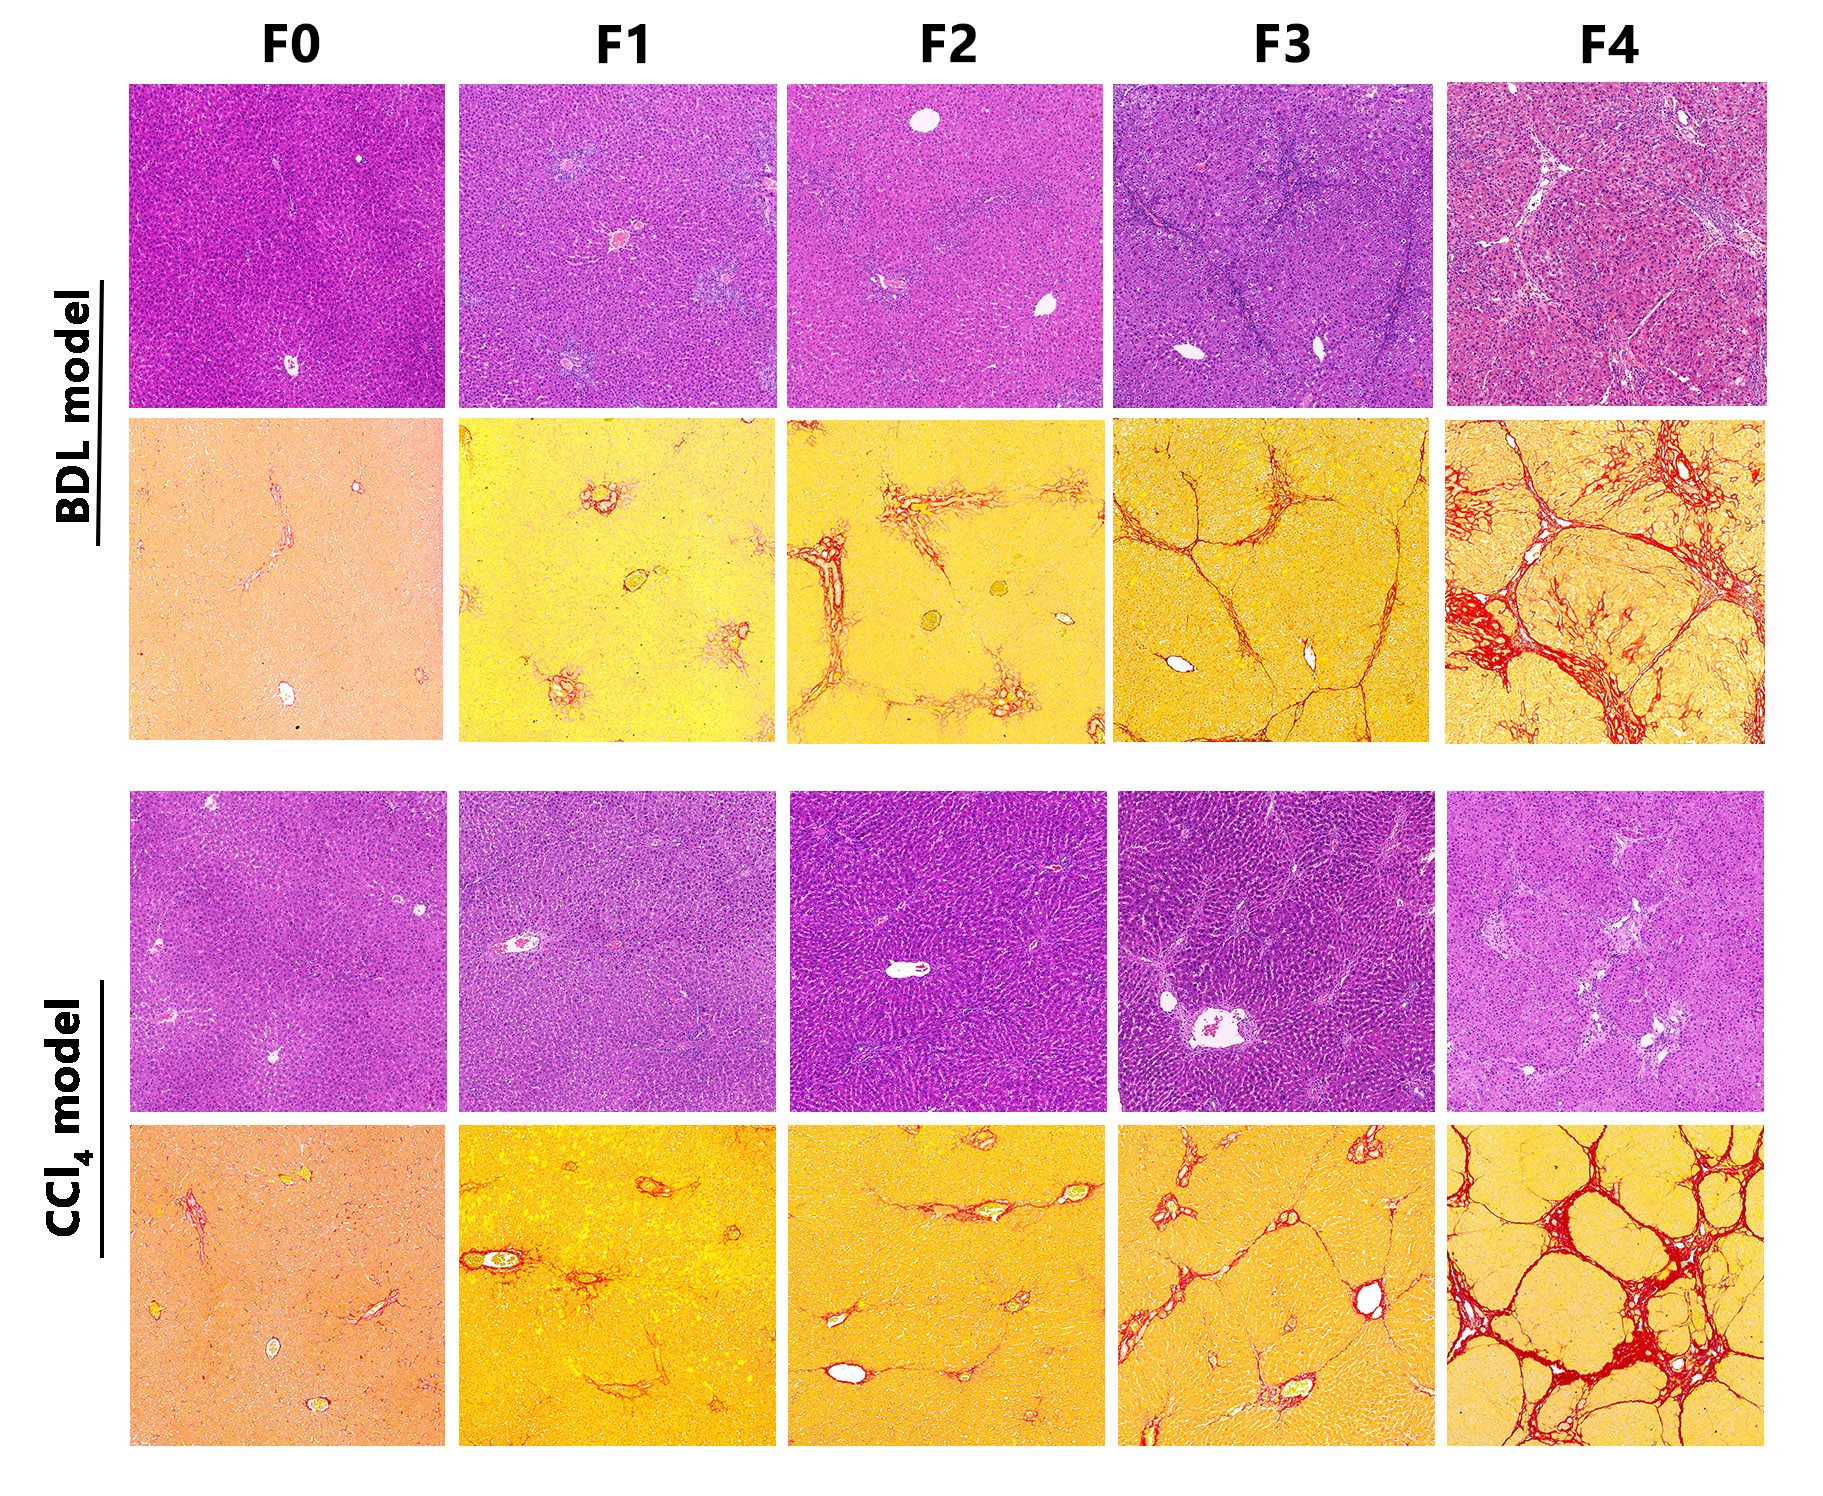
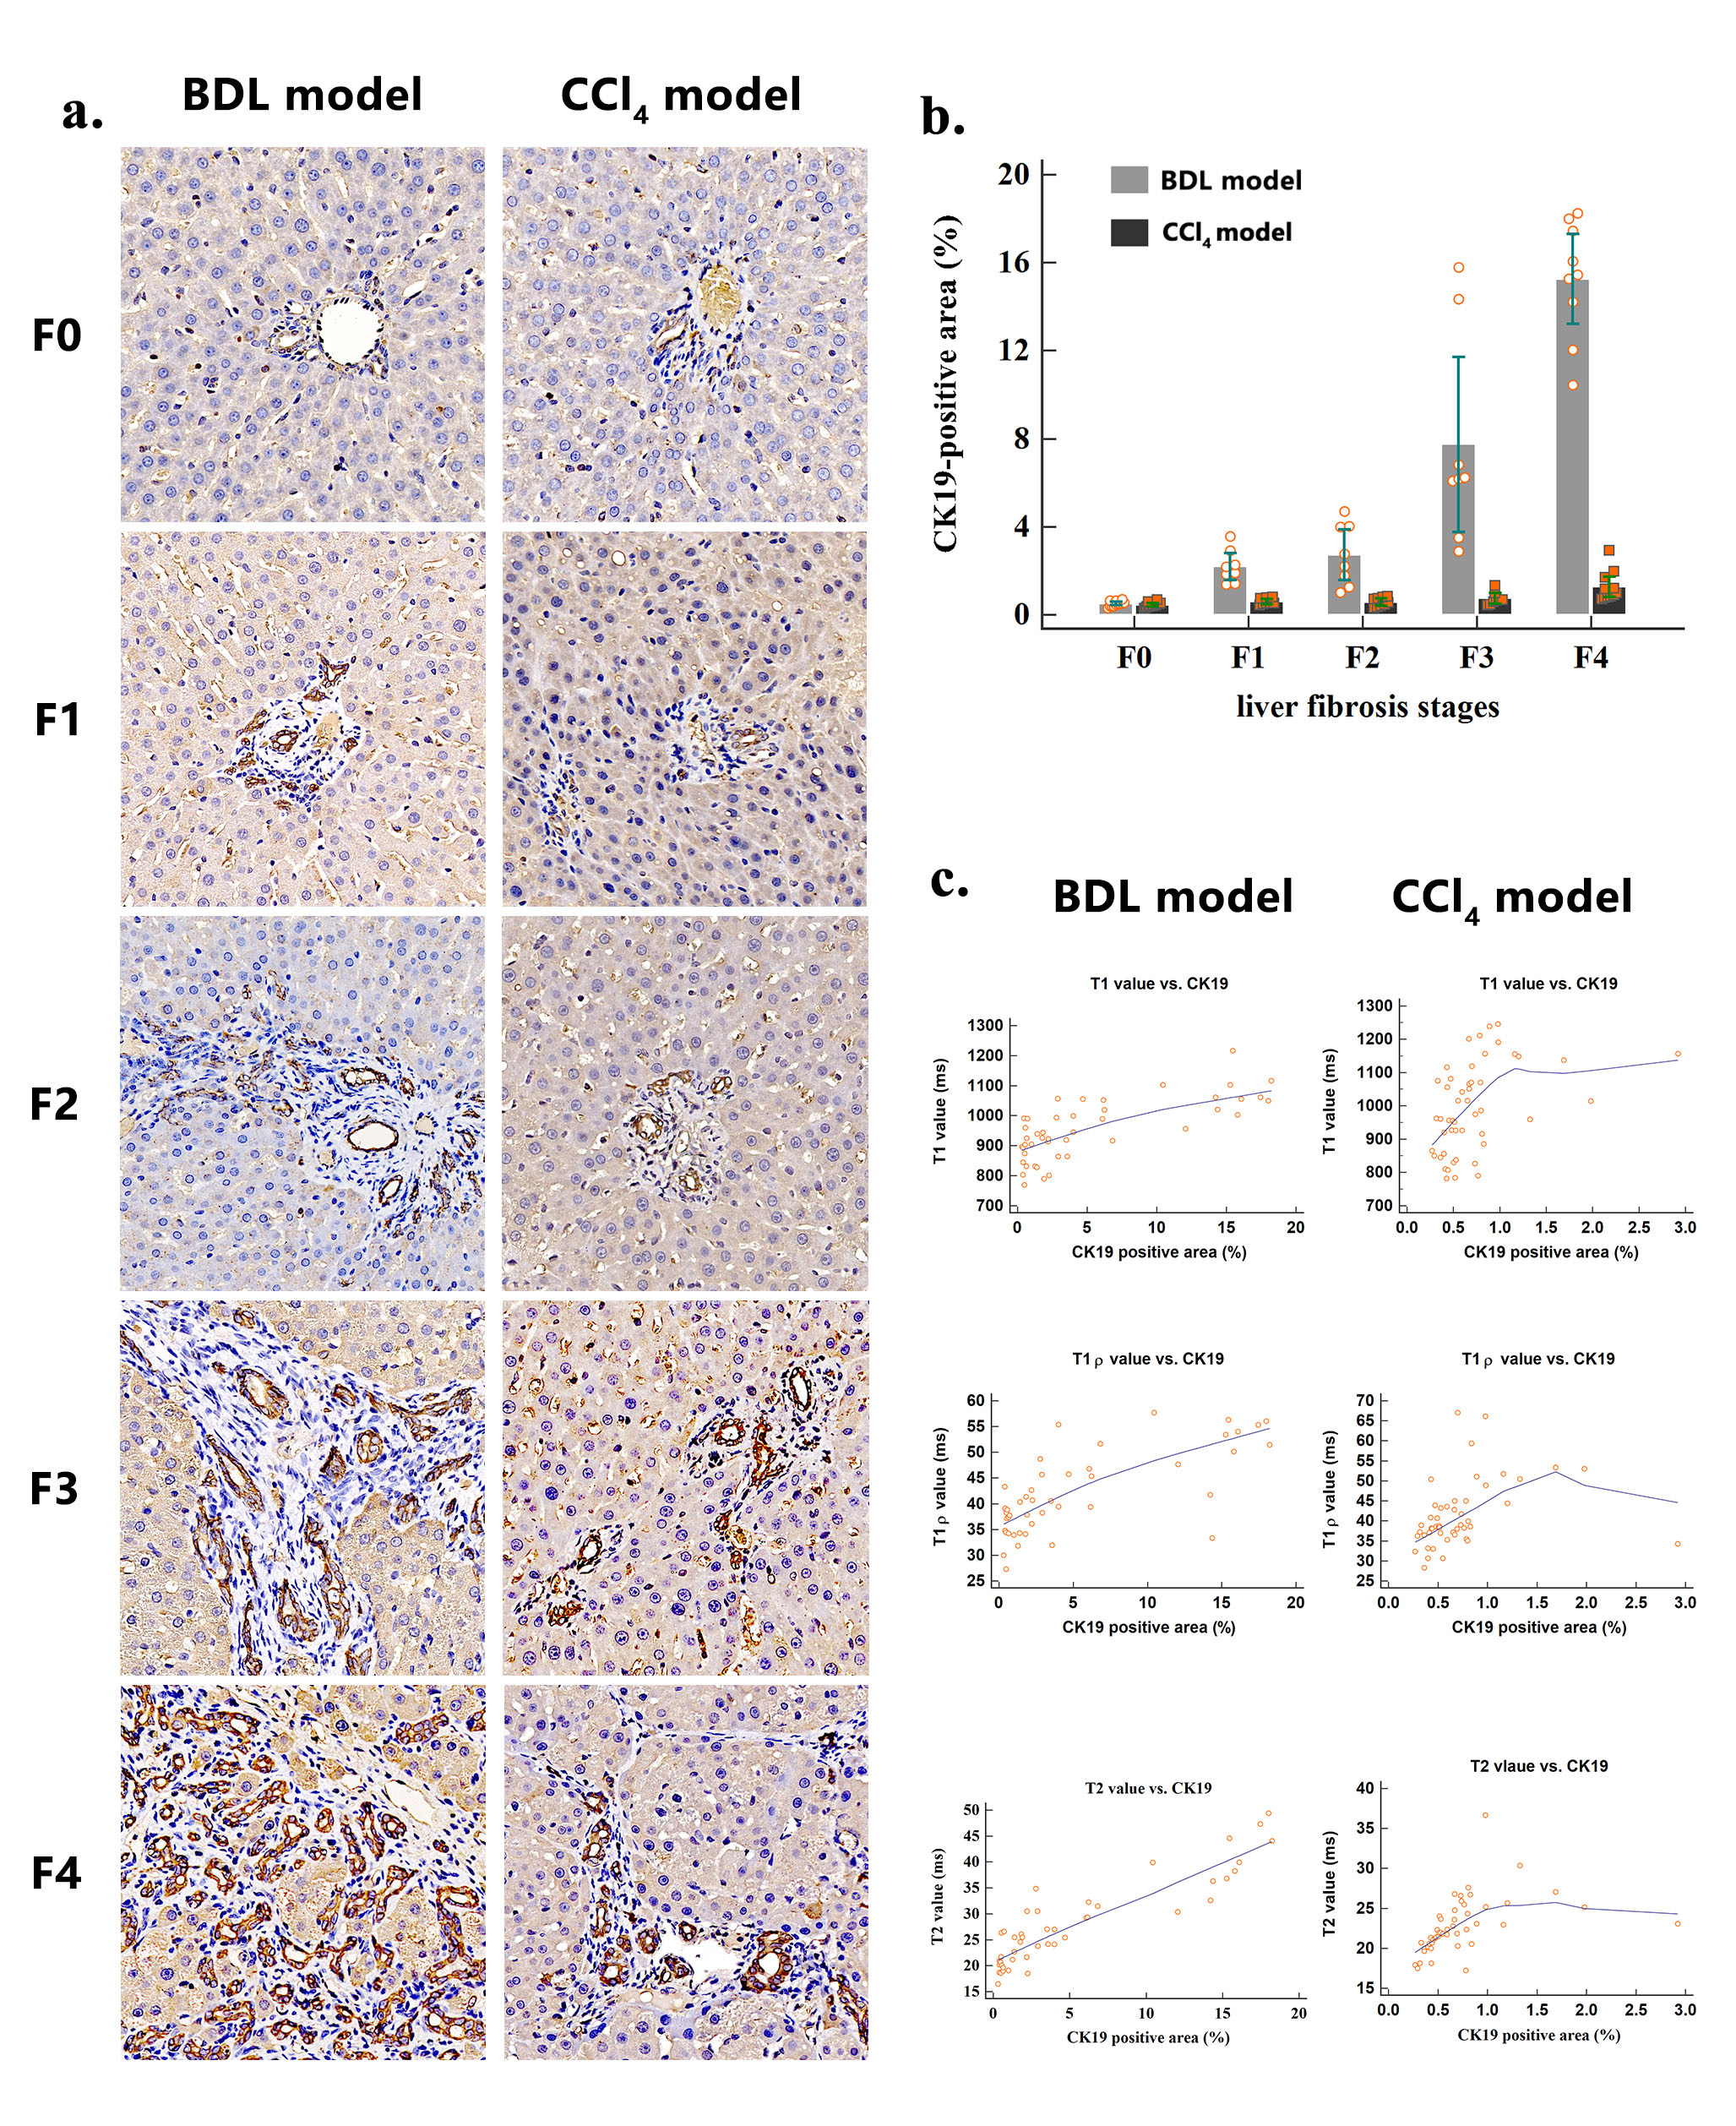
Methods: Using the intraclass correlation coefficient (ICC) to explore the repeatability of the quantitative parameters in 8 rats. Two animal models, the bile duct ligation (BDL) and carbon tetrachloride (CCl4), induced different degrees of liver fibrosis in 120 rats. The fibrosis stages, inflammatory activity grades, steatosis content, iron deposition, and cytokeratin 19 (CK19) expression were semi-quantified by using histology stain. To test differences in quantitative parameters and tissue analyses among groups by using one-way ANOVA. To explore independent influencing factors of quantitative parameters by using multiple regression analysis. The interaction between the two animal models on each quantitative parameter was tested by factorial design ANOVA. The ability of each quantitative parameters to stage liver fibrosis was quantified by using receiver operating characteristic (ROC) curve analysis.Results
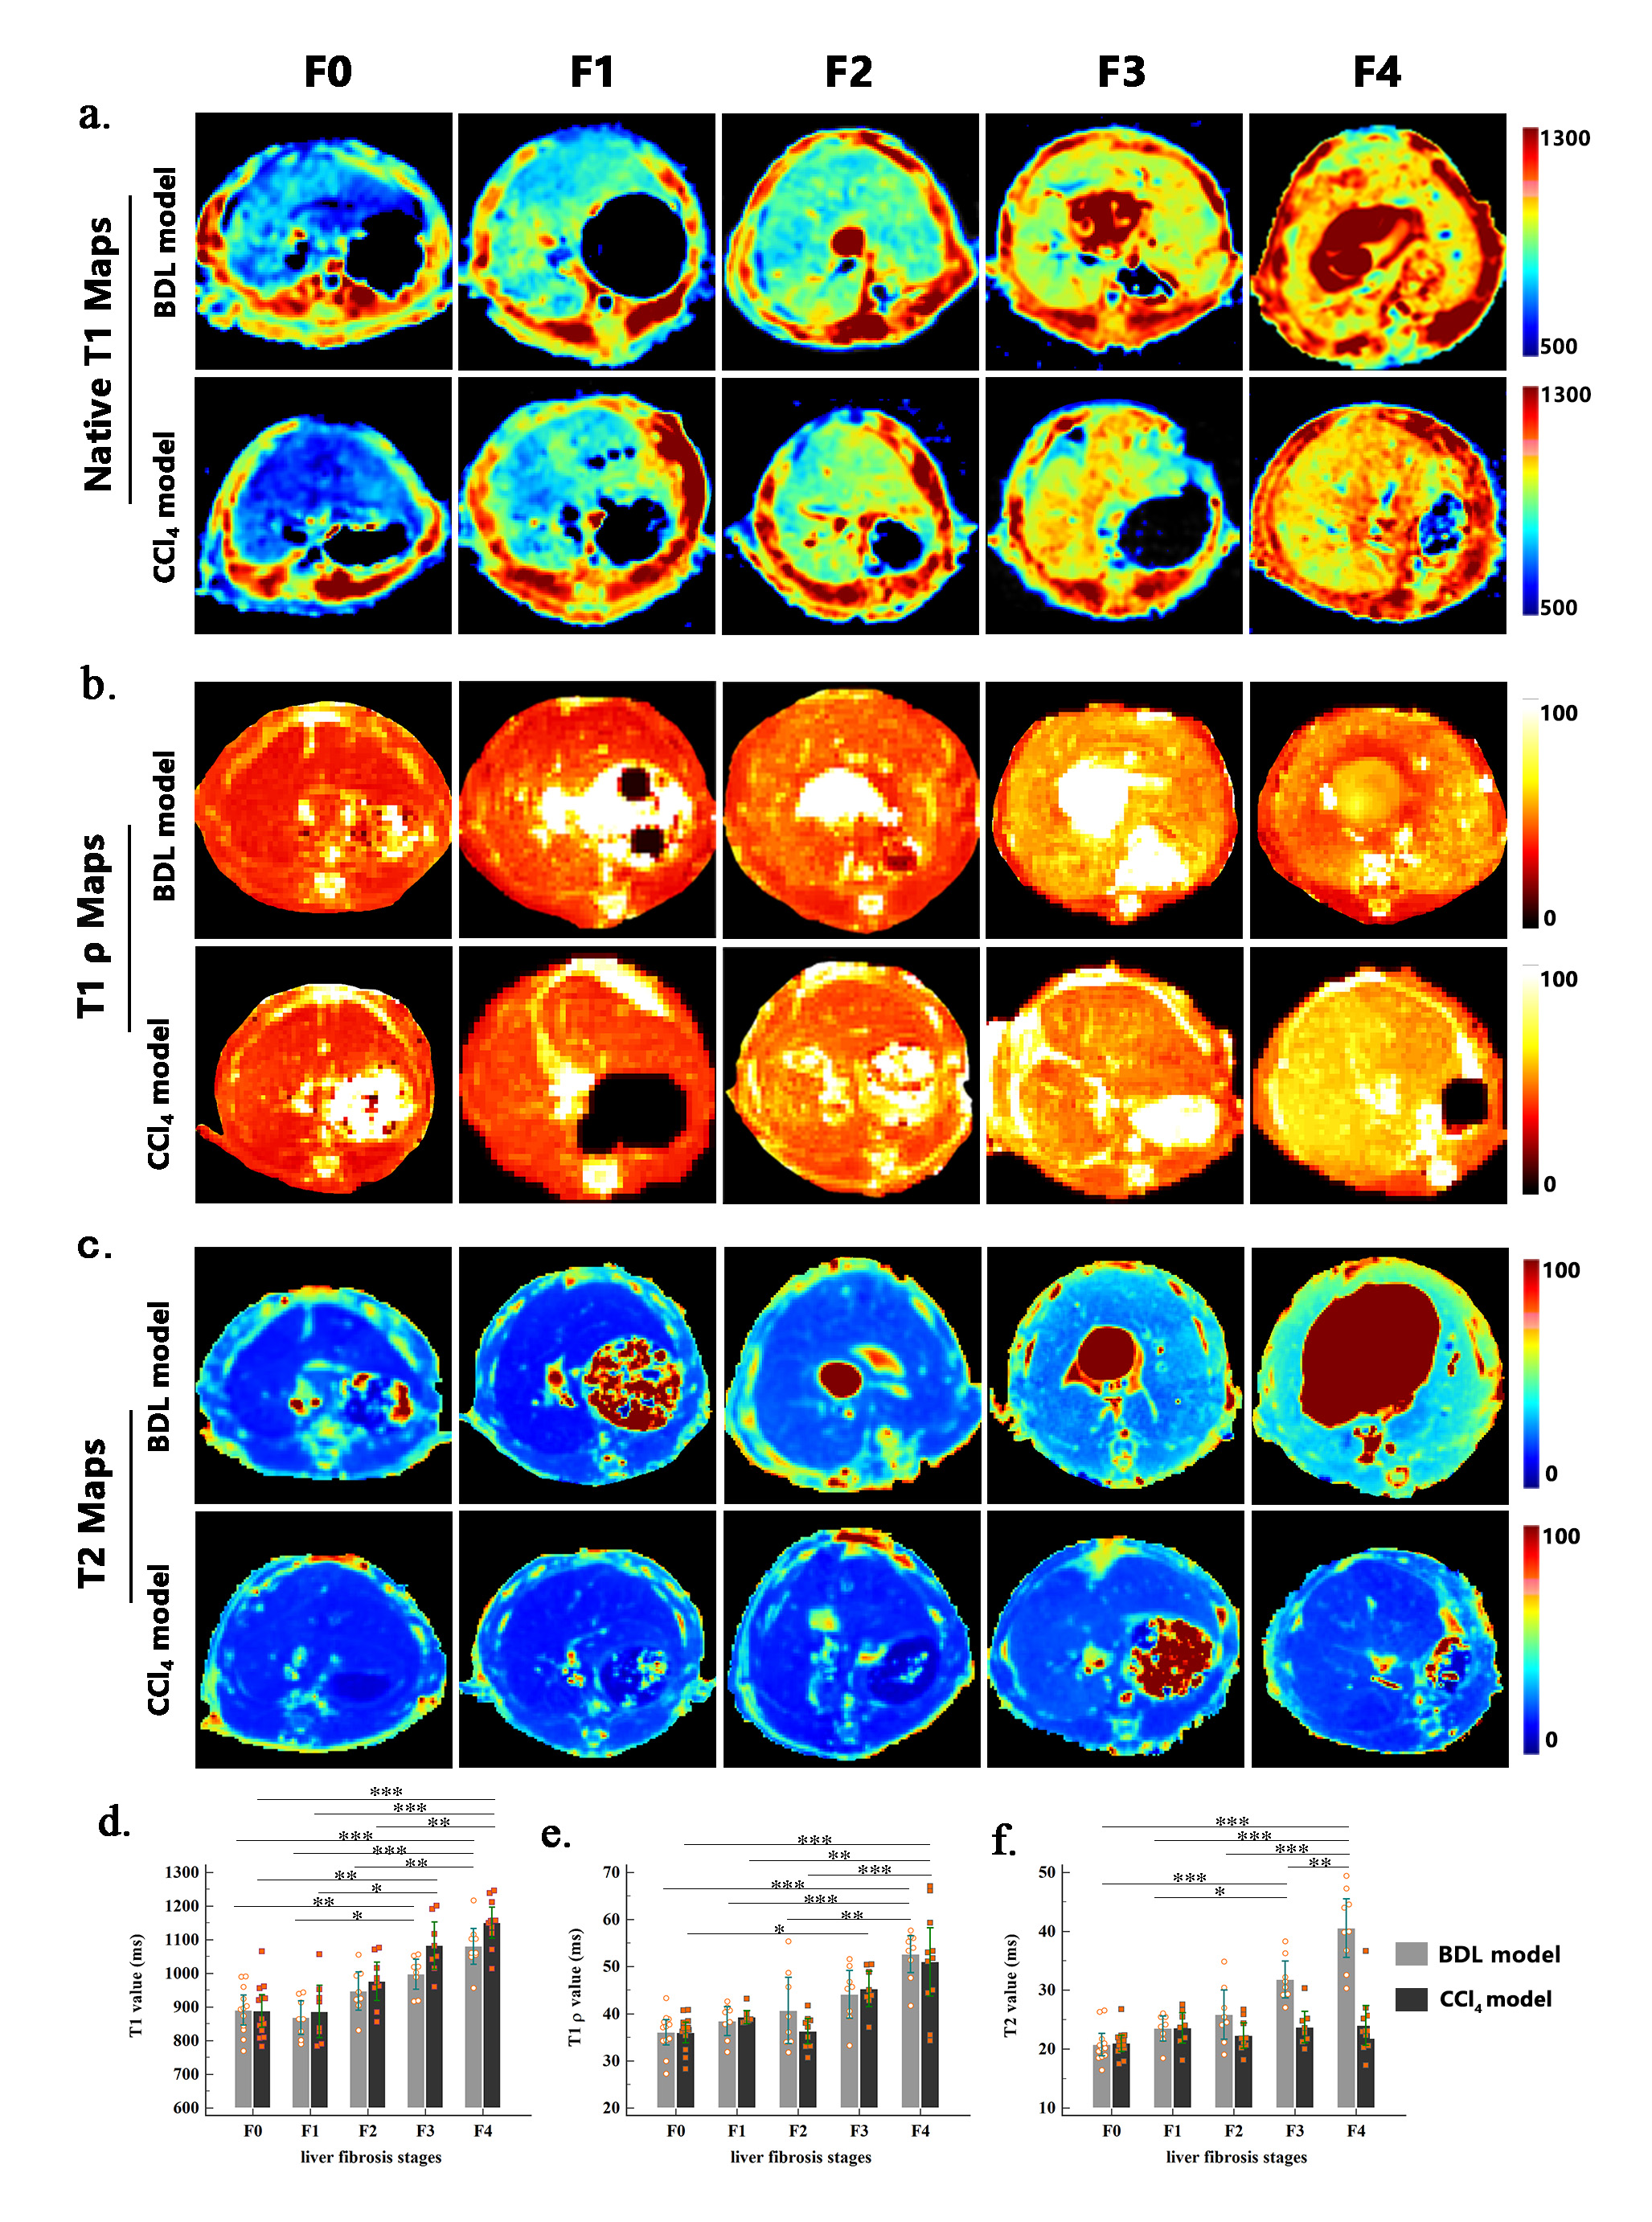
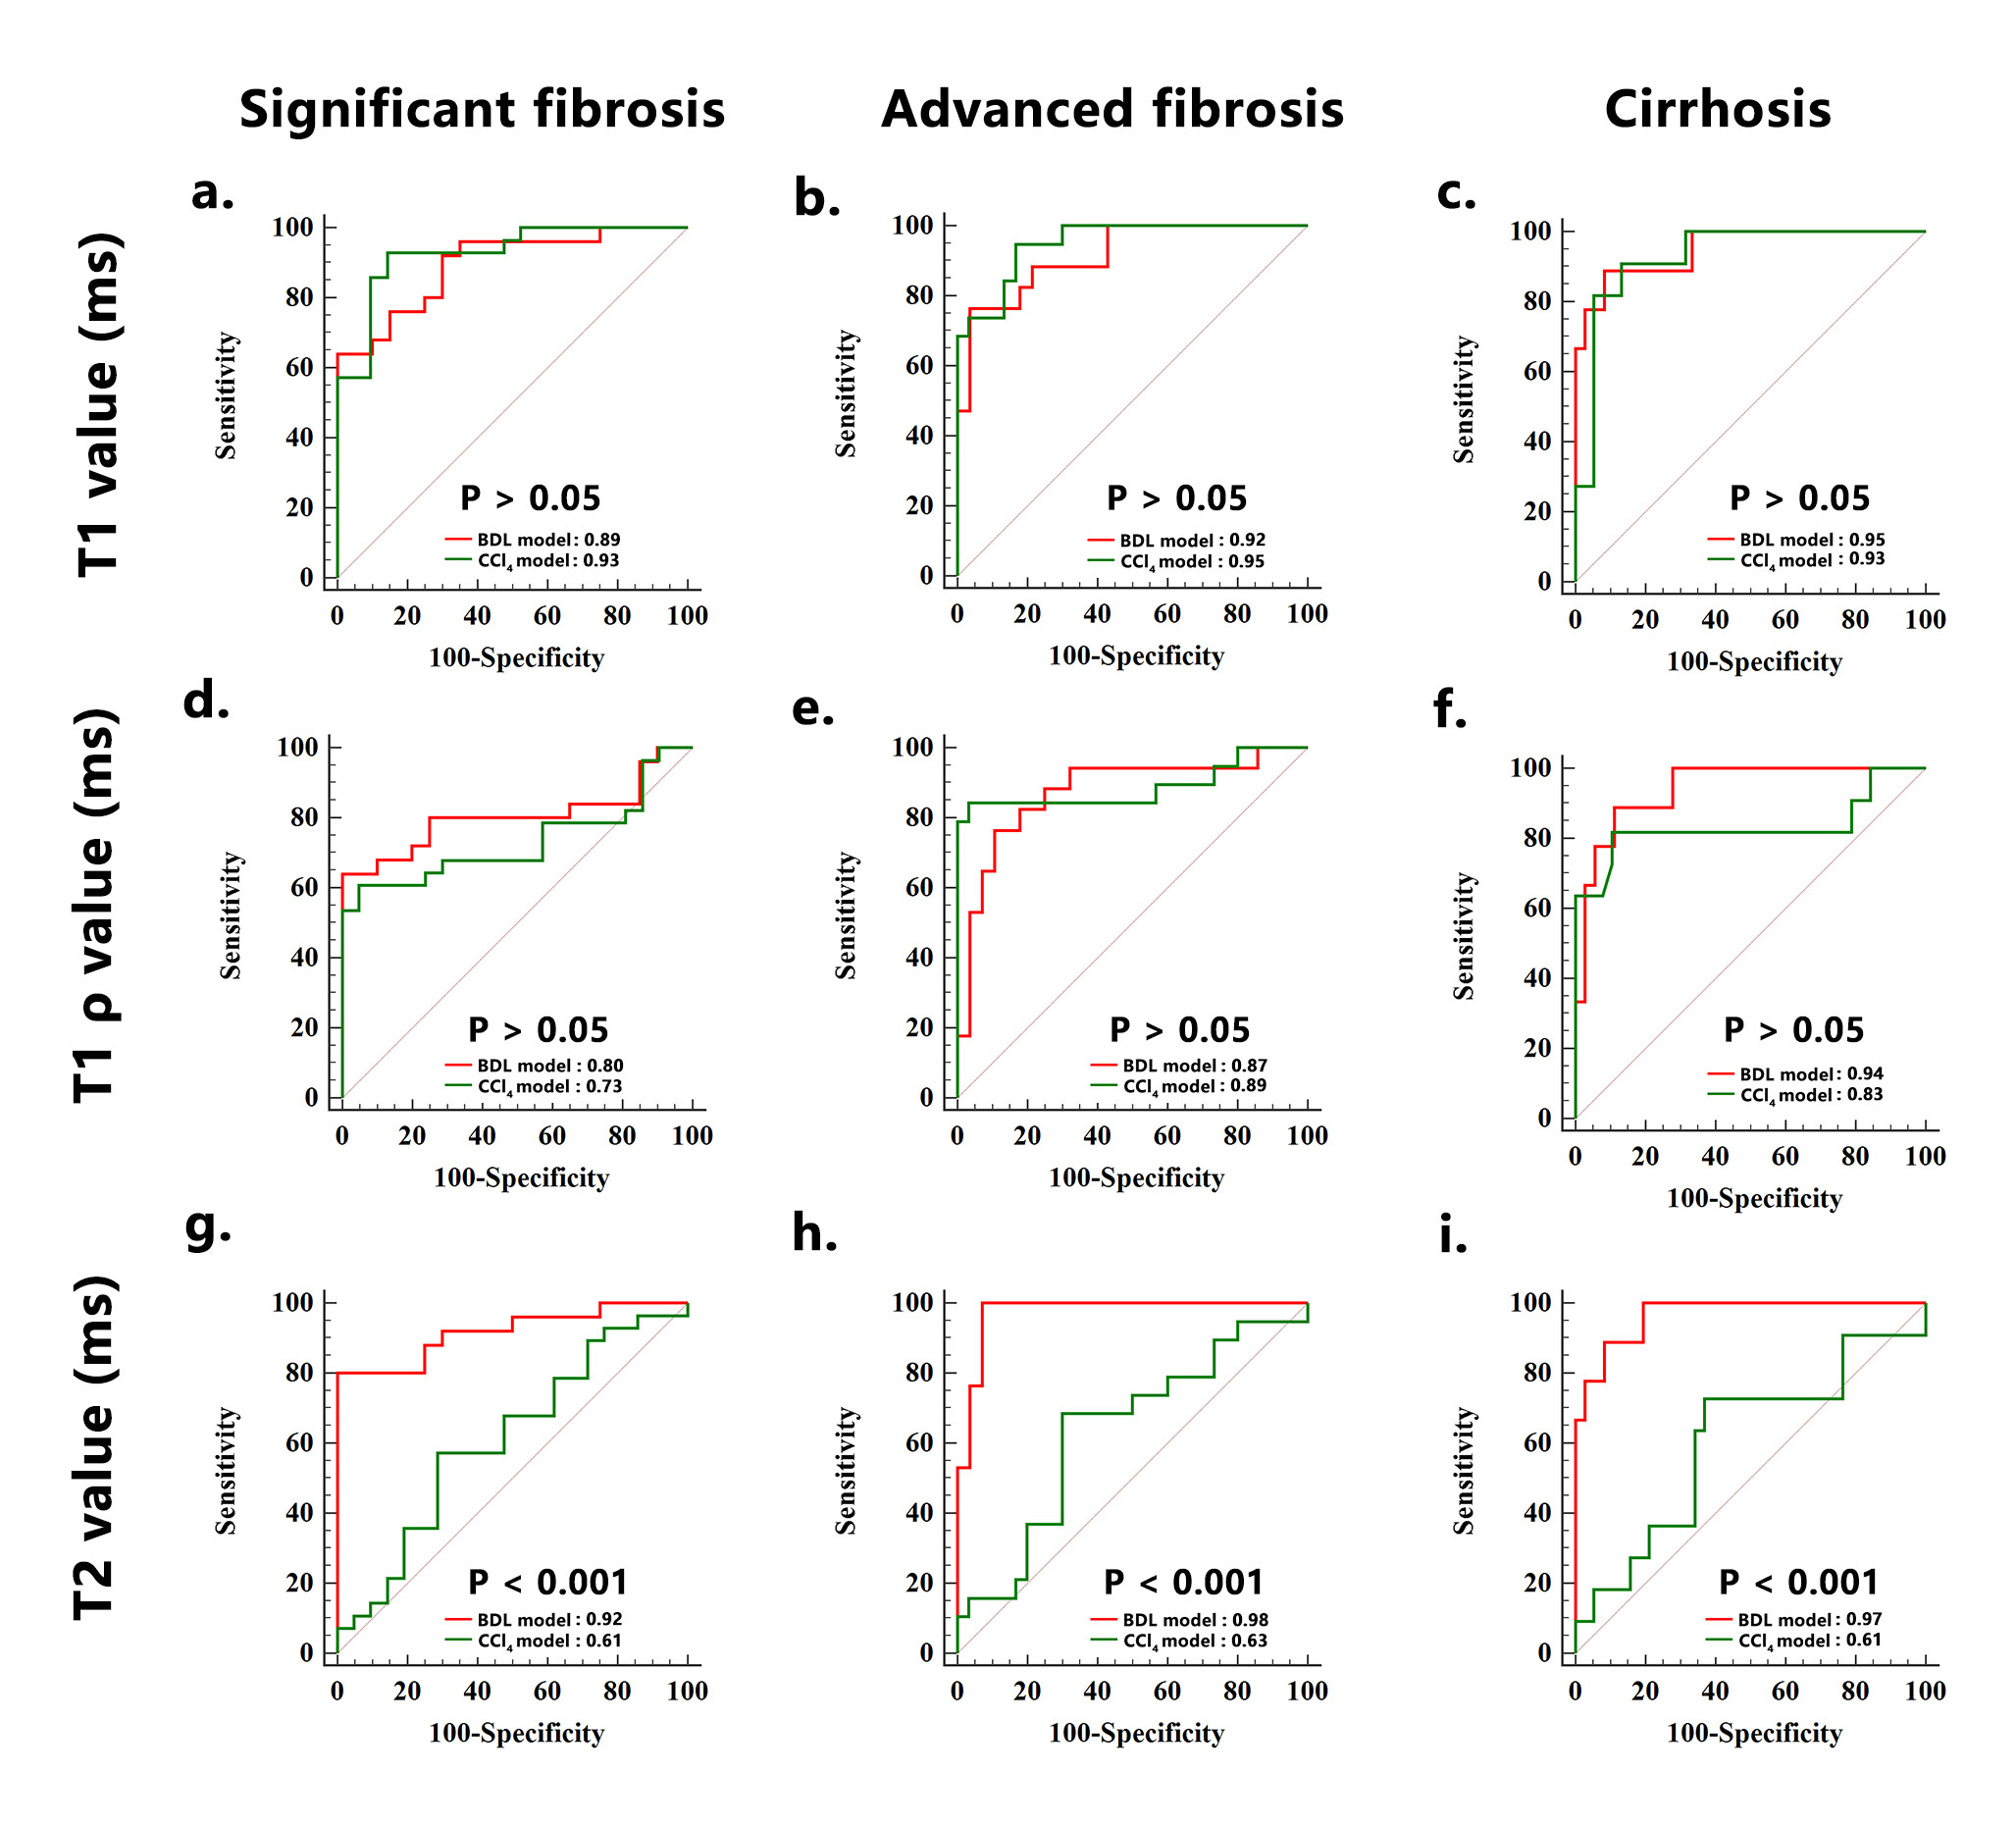
Results: Native T1, T2, and T1ρ values shared similar and excellent repeatability (ICC:0.86-0.92). The most sensitive and accurate method for staging liver fibrosis was native T1 mapping in both animal models, followed by T1ρ. We observed strong and moderate positive correlations between liver fibrosis stages and native T1 value (rho = 0.732 for the BDL model, and rho = 0.797 for the CCl4 model) as well as T1ρ value (rho = 0.676 for the BDL model, and rho = 0.611 for the CCl4 model). In addition, the area under the receiver operating curve (AUC) of native T1 value for distinguishing early (≤ F2) from late ( ≥ F3) fibrosis was higher than T1ρ value in the CCl4 model (AUC: 0.93 vs. 0.73, P < .05). T2 mapping showed a model-dependent pattern, revealing good performance in the BDL model but poor performance in the CCl4 model.Conclusion
Conclusion: Native T1 mapping and T1ρ may be more valuable tools for noninvasively evaluating liver fibrosis than T2mapping. Compared with T1ρ, native T1 mapping may provide better accuracy for diagnosing early fibrosis.Keywords
Keywords: Liver fibrosis · Magnetic resonance imaging · Native T1 mapping · T1ρ · T2 mappingAcknowledgements
We thank Dr. XiaoyingWang, Department of Pathology (Xinhua Hospital), for the pathological analysis of liver specimens. We are also grateful to Xi Zhang, Ph.D. (ClinicalResearch Unite, Xinhua Hospital, Shanghai Jiao Tong University School of Medicine, Shanghai, China), for her statistical support of this study.References
[1] Parola M, Pinzani M. Liver fibrosis: Pathophysiology, pathogenetic targets and clinical issues[J]. Molecular Aspects of Medicine,2019,65:37-55.
[2] Chang M L, Yang S S. Metabolic Signature of Hepatic Fibrosis: From Individual Pathways to Systems Biology[J]. Cells,2019,8(11).
[3] Zoubek M E, Trautwein C, Strnad P. Reversal of liver fibrosis: From fiction to reality[J]. Best Practice & Research Clinical Gastroenterology,2017,31(2):129-141.
[4] N R, E C, Tf B. Liver Fibrosis: Mechanistic Concepts and Therapeutic Perspectives.[J]. Cells,2020,9(4).
[5] S W, F L, C H, et al. Ursolic acid reverses liver fibrosis by inhibiting interactive NOX4/ROS and RhoA/ROCK1 signalling pathways.[J]. Aging,2020,12.
[6] Goodman Z D. Grading and staging systems for inflammation and fibrosis in chronic liver diseases[J]. JOURNAL OF HEPATOLOGY,2007,47(4):598-607.
[7] V R, F C, A H, et al. Sampling variability of liver biopsy in nonalcoholic fatty liver disease.[J]. Gastroenterology,2005,128(7):1898-1906.
[8] A R, M B, Lj J, et al. Sampling error and intraobserver variation in liver biopsy in patients with chronic HCV infection.[J]. The American journal of gastroenterology,2002,97(10):2614-2618.
[9] Heye T, Yang S R, Bock M, et al. MR relaxometry of the liver: significant elevation of T1 relaxation time in patients with liver cirrhosis.[J]. European radiology,2012,22(6):1224-1232.
[10] Luetkens J A, Klein S, Traber F, et al. Quantification of Liver Fibrosis at T1 and T2 Mapping with Extracellular Volume Fraction MRI: Preclinical Results[J]. Radiology,2018,288(3):748-754.
[11] Ar G, L S, R U, et al. T2 relaxation time is related to liver fibrosis severity.[J]. Quantitative imaging in medicine and surgery,2016,6(2):103-114.
[12] Wang Y X, Yuan J, Chu E S, et al. T1rho MR imaging is sensitive to evaluate liver fibrosis: an experimental study in a rat biliary duct ligation model[J]. Radiology,2011,259(3):712-719.
[13] Thomsen C, Christoffersen P, Henriksen O, et al. Prolonged T1 in patients with liver cirrhosis: an in vivo MRI study[J]. Magn Reson Imaging,1990,8(5):599-604.
[14] Chow A M, Gao D S, Fan S J, et al. Measurement of liver T1 and T2 relaxation times in an experimental mouse model of liver fibrosis[J]. Journal of Magnetic Resonance Imaging,2012,36(1):152-158.
[15] Ya N, Z B, Fj C, et al. Animal Models for Liver Disease - A Practical Approach for Translational Research.[J]. Journal of hepatology,2020.
[16] Li J, Liu H, Zhang C, et al. Native T1 mapping compared to ultrasound elastography for staging and monitoring liver fibrosis: an animal study of repeatability, reproducibility, and accuracy[J]. European Radiology,2020,30(1):337-345.
[17] A B, Cd F, Ch Ö, et al. Inhibition of intestinal bile acid absorption improves cholestatic liver and bile duct injury in a mouse model of sclerosing cholangitis.[J]. Journal of hepatology,2016,64(3):674-681.
[18] Y D, B T. Pathology of hepatic iron overload.[J]. Seminars in liver disease,2011,31(3):260-271.
[19] Wa C, Tj F, H A, et al. Quantitative MRI of Diffuse Liver Disease: Current Applications and Future Directions.[J]. Radiology,2019,290(1):23-30.
[20] G X, S Z, X X, et al. Comparison of laboratory tests, ultrasound, or magnetic resonance elastography to detect fibrosis in patients with nonalcoholic fatty liver disease: A meta-analysis.[J]. Hepatology (Baltimore, Md.),2017,66(5):1486-1501.
[21] K P, G S. Limitations of non-invasive tests for assessment of liver fibrosis.[J]. JHEP reports : innovation in hepatology,2020,2(2):100067.
[22] Luetkens J A, Klein S, Traeber F, et al. Quantitative liver MRI including extracellular volume fraction for non-invasive quantification of liver fibrosis: a prospective proof-of-concept study[J]. Gut,2018,67(3):593-594.
[23] Keller S, Borde T, Brangsch J, et al. Native T1 Mapping Magnetic Resonance Imaging as a Quantitative Biomarker for Characterization of the Extracellular Matrix in a Rabbit Hepatic Cancer Model.[J]. Biomedicines,2020,8(10).
[24] Xu X, Zhu H, Li R, et al. Whole-liver histogram and texture analysis on T1 maps improves the risk stratification of advanced fibrosis in NAFLD.[J]. European radiology,2020.
[25] Agrawal S, Hoad C L, Francis S T, et al. Visual morphometry and three non-invasive markers in the evaluation of liver fibrosis in chronic liver disease.[J]. Scandinavian journal of gastroenterology,2017,52(1):107-115.
[26] Iy Z, V C J, Nj R, et al. Advanced MRI of Liver Fibrosis and Treatment Response in a Rat Model of Nonalcoholic Steatohepatitis.[J]. Radiology,2020:192118.
[27] Petitclerc L, Sebastiani G, Gilbert G, et al. Liver fibrosis: Review of current imaging and MRI quantification techniques[J]. Journal of Magnetic Resonance Imaging,2017,45(5):1276-1295.
[28] Koon C, Zhang X, Chen W, et al. Black blood T1rho MR imaging may diagnose early stage liver fibrosis: a proof-of-principle study with rat biliary duct ligation model[J]. Quantitative imaging in medicine and surgery,2016,6(4 ):353-363.
[29] Cm K, X Z, W C, et al. Black blood T1rho MR imaging may diagnose early stage liver fibrosis: a proof-of-principle study with rat biliary duct ligation model.[J]. Quantitative imaging in medicine and surgery,2016,6(4):353-363.
[30] Hu G, Zhang X, Liang W, et al. Assessment of liver fibrosis in rats by MRI with apparent diffusion coefficient and T1 relaxation time in the rotating frame.[J]. Journal of magnetic resonance imaging : JMRI,2016,43(5):1082-1089.
[31] S X, H Q, Q L, et al. Liver injury monitoring, fibrosis staging and inflammation grading using T1rho magnetic resonance imaging: an experimental study in rats with carbon tetrachloride intoxication.[J]. BMC gastroenterology,2020,20(1):14.
[32] Zhang H, Yang Q, Yu T, et al. Comparison of T2, T1rho, and diffusion metrics in assessment of liver fibrosis in rats[J]. J Magn Reson Imaging,2017,45(3):741-750.
[33] Sato K, Marzioni M, Meng F, et al. Ductular Reaction in Liver Diseases: Pathological Mechanisms and Translational Significances.[J]. Hepatology (Baltimore, Md.),2019,69(1):420-430.
[34] Cr W, Tm B, Ar G. T magnetic resonance fingerprinting.[J]. NMR in biomedicine,2020:e4284.
Figures