1237
Multiparametric MRI Distinguishes Cerebral Radiation Necrosis vs. Recurrent Glioma in Mouse Models1Radiology, Washington University in St Louis, St Louis, MO, United States, 2Neurosurgery, Washington University in St Louis, St Louis, MO, United States, 3Neuropathology, Washington University in St Louis, St Louis, MO, United States, 4Surgery, Washington University in St Louis, St Louis, MO, United States, 5Alvin J Siteman Cancer Center, Washington University in St Louis, St Louis, MO, United States, 6Internal Medicine, Washington University in St Louis, St Louis, MO, United States, 7Chemistry Department, Washington University in St Louis, St Louis, MO, United States
Synopsis
Malignant brain tumor patients treated with radiation are at risk of developing subsequent treatment effects, including radiation necrosis (RN), which cannot be differentiated from recurrent tumor. We have developed mouse models of RN and of admixed tumor growing in previously irradiated brain (“mixed lesion”) that recapitulate the major histologic characteristics of human RN and recurrent glioma, respectively. These models provide a platform for the development of imaging biomarkers capable of differentiating RN vs. tumor. We demonstrate a multiparametric, clinically translatable 1H MRI pipeline (R1, R1-post-contrast, R2, ADC, MTR, and DCEAUC) that shows significant promise for differentiating RN vs. recurrent tumor.
Introduction
The majority of neuro-oncology patients, including those with primary or secondary malignant brain tumors, are treated with radiation as an early therapeutic modality. These patients are at risk of developing post-treatment effects from the radiation, including late time-to-onset radiation necrosis (RN). Tumors frequently recur in these patients, often within regions of brain previously irradiated. The clinical dilemma of identifying tumor recurrence in a background of RN distinct from RN alone remains an important unmet clinical need in the management of neuro-oncology patients. Identification of novel imaging biomarkers capable of accurately distinguishing RN alone from recurrent tumor admixed within regions of RN would be a major clinical advance, allowing oncologists to offer the best available treatment options in a timely fashion. Evaluating potential new MR imaging techniques in humans is hampered by a lack of tissue samples to validate imaging findings. We have developed novel mouse models of delayed RN alone (“RN”) and of malignant glioma cells growing in a background of delayed RN (“mixed lesion”) that recapitulate the major histologic characteristics of human RN and recurrent glioma, respectively (1-3). Employing these models, a modified one-hour multiparametric 1H MRI acquisition pipeline previously developed in our lab (4) was investigated for differentiating RN and recurrent tumor. Several of the image contrasts, and in particular magnetization transfer ratio (MTR), show considerable promise as potential biomarkers of recurrent tumor vs. RN.Methods
8-week-old C57Bl/6 mice received single-fraction, 50-Gy hemispheric radiation using a clinical Gamma Knife stereotactic irradiator. One cohort of irradiated animals served as the RN group (n=9); in a second irradiated cohort, non-irradiated GL261 glioblastoma cells (~50K cells) were implanted into the irradiated hemisphere six weeks post-irradiation (mixed lesion; n=8). Age-matched non-irradiated mice implanted with GL261 cells served as a tumor only group (n=9).Imaging experiments were performed on a 4.7-T small-animal MR scanner (Varian/Agilent) employing an actively decoupled volume coil (transmit)/surface coil (receive) pair. Mice were anesthetized using 1.5% isoflurane/O2, placed in a lab-built head restraint and maintained at 37°C with a circulating warm water bath. The 1H MR imaging pipeline was:
Scout-->T2(R2)-->ADC-->MTR-->T1(R1)-->Inject Gd-contrast-->DCE-->T1PC (R1PC)-->T2W-->T1W.
Immediately following imaging, mice were euthanized, and their brains harvested and stained with H&E. MRI data were Gaussian filtered, parametric maps were modeled on a voxel-by-voxel basis with the Bayesian Toolbox (5), and lesion ROIs were manually drawn. ROI-based mean parameter values were statistically compared via unpaired t test.
Results
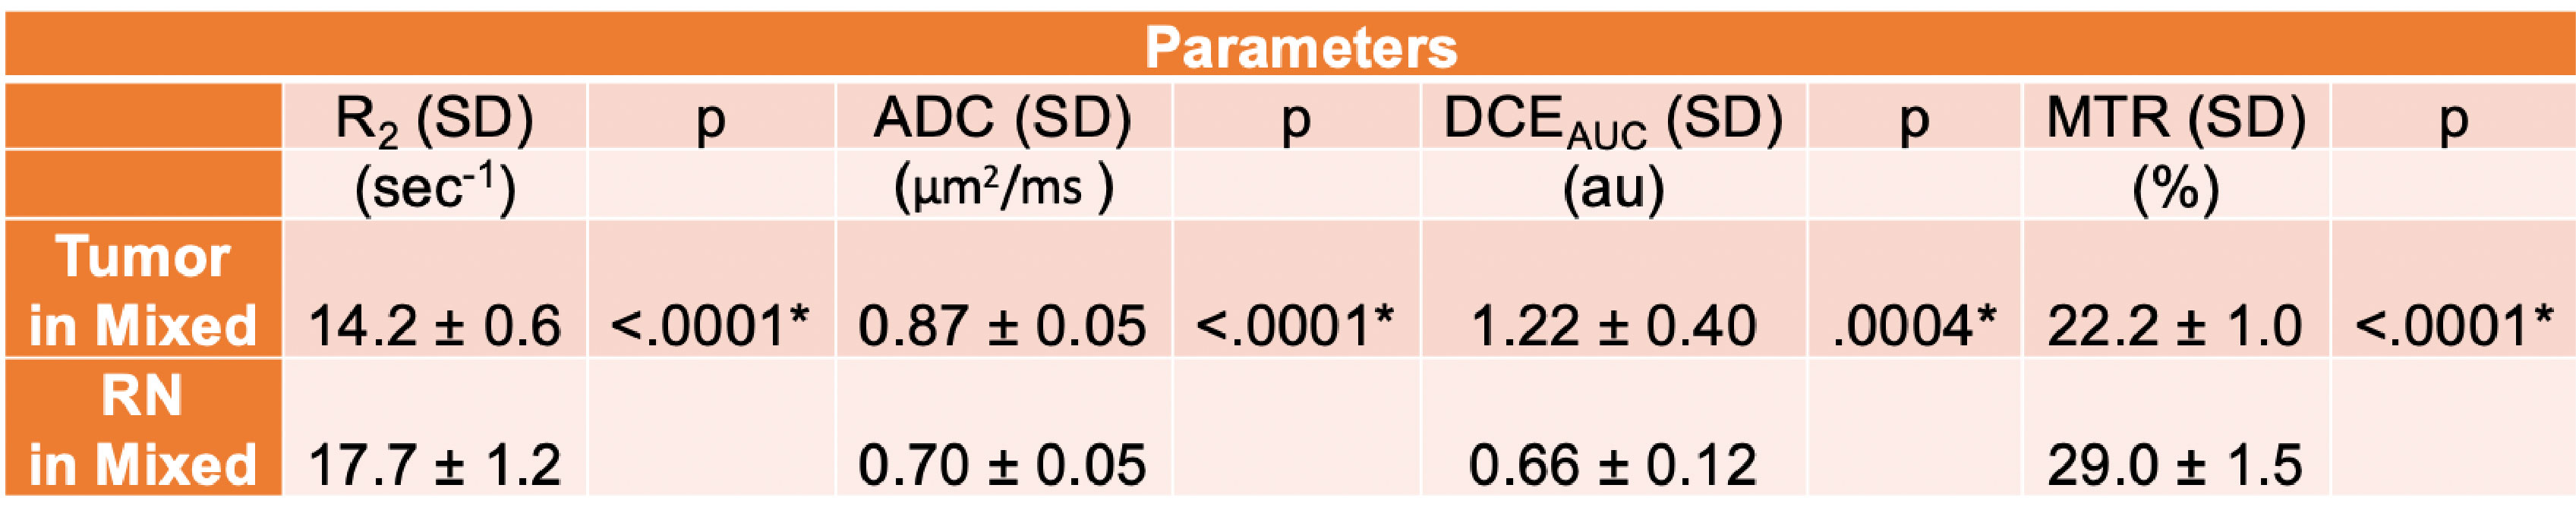
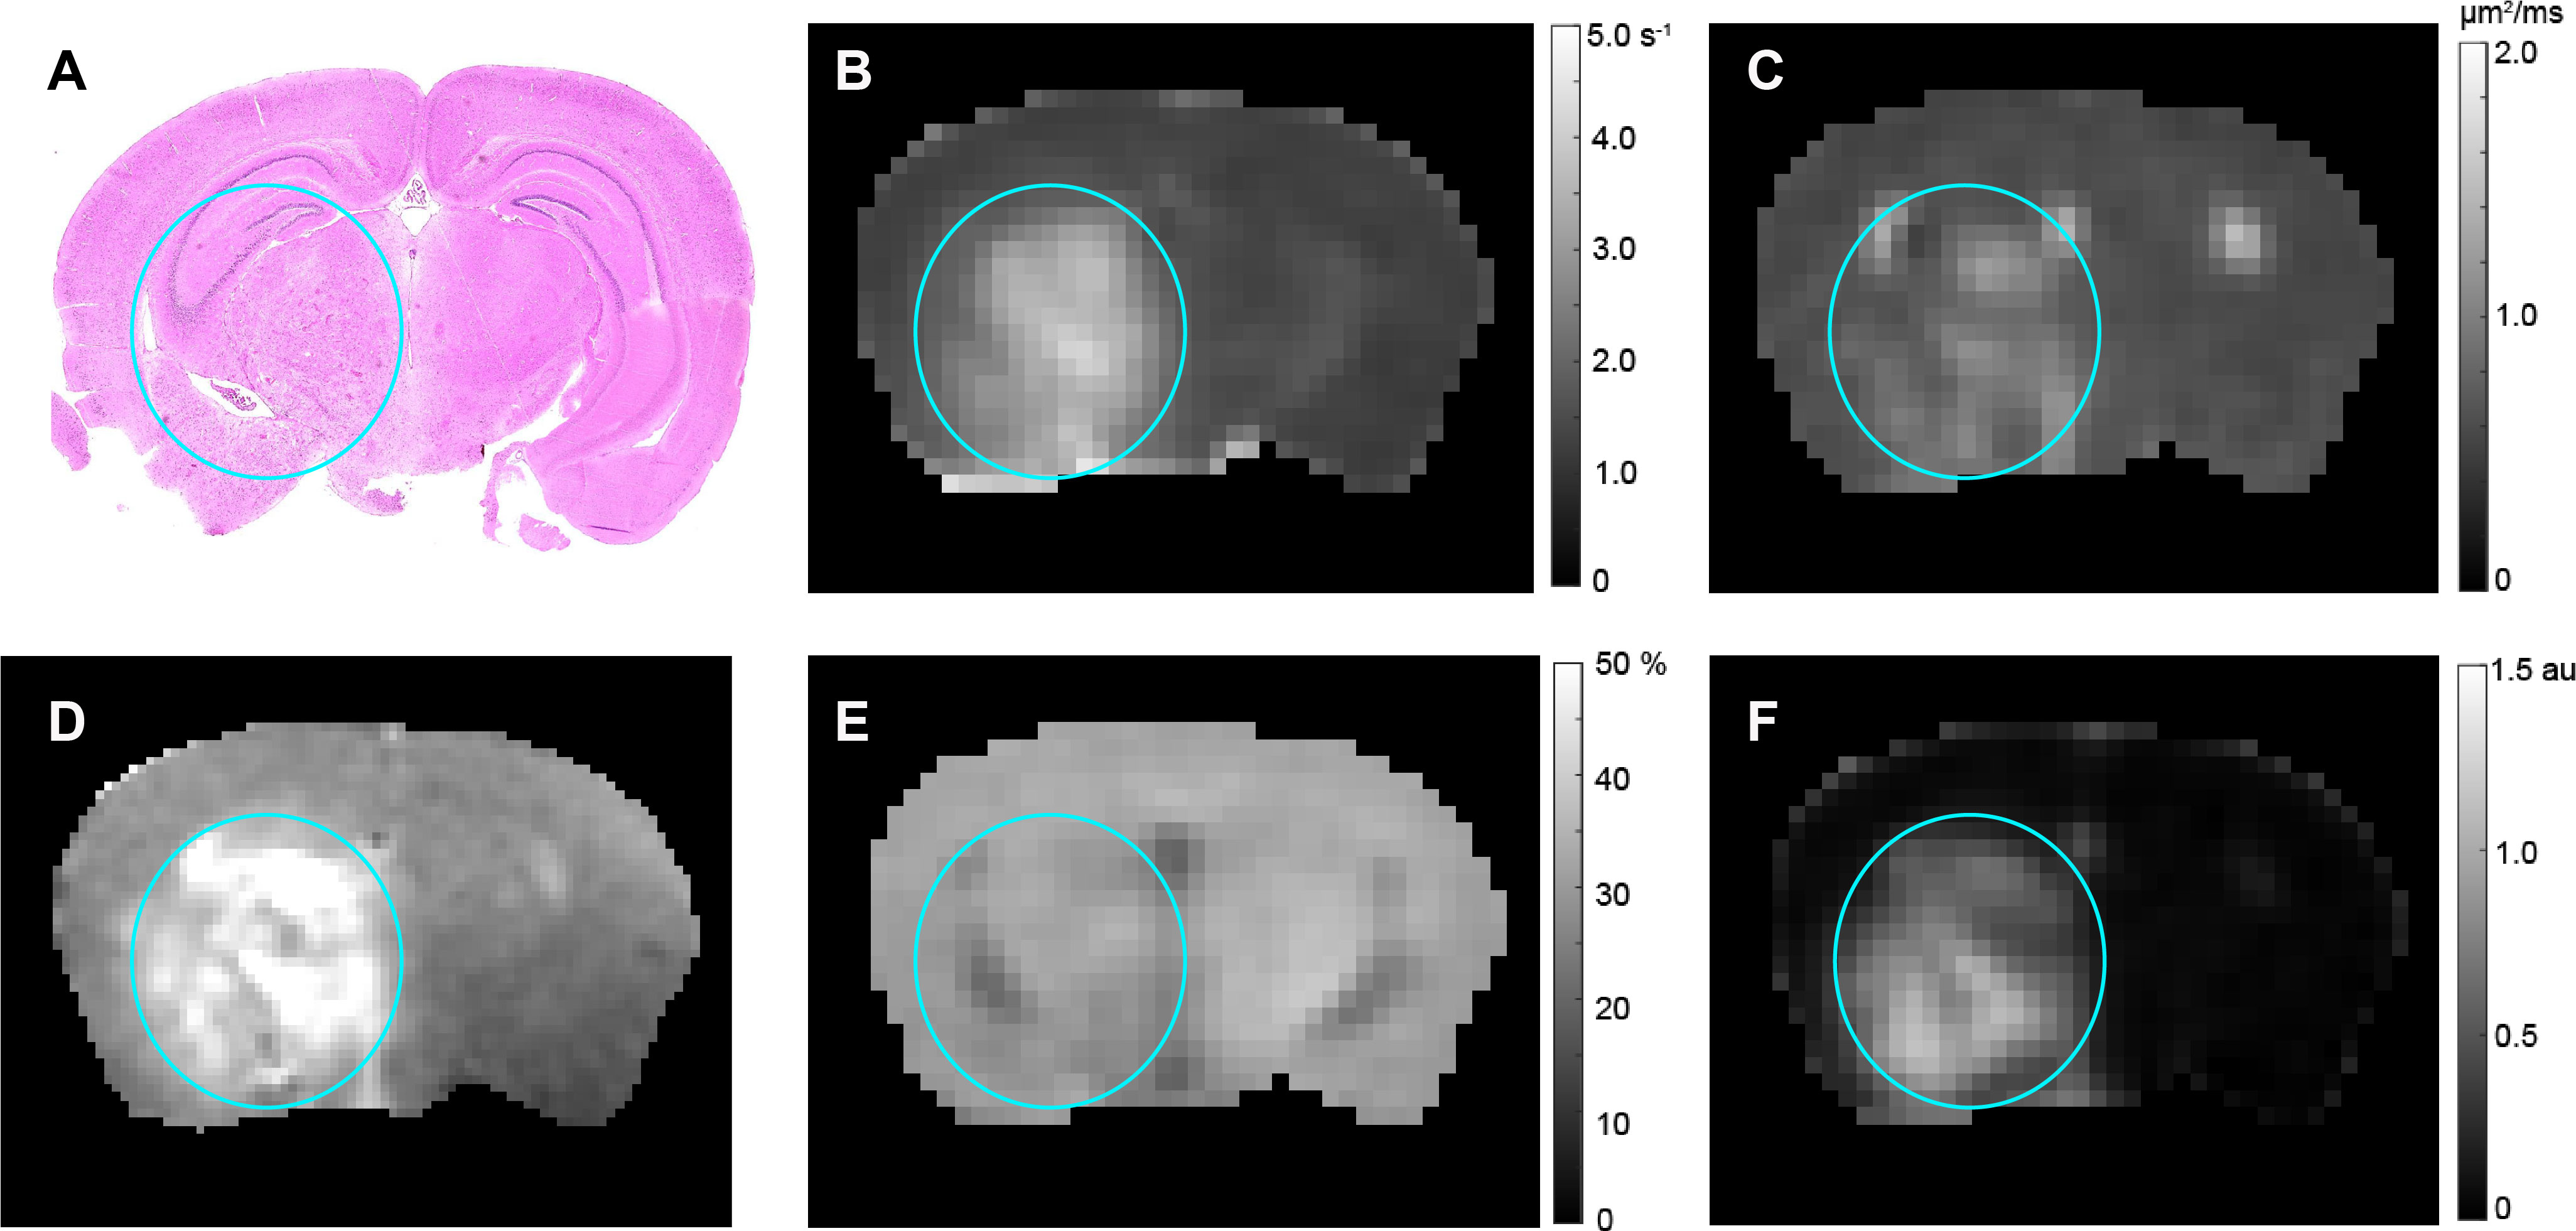
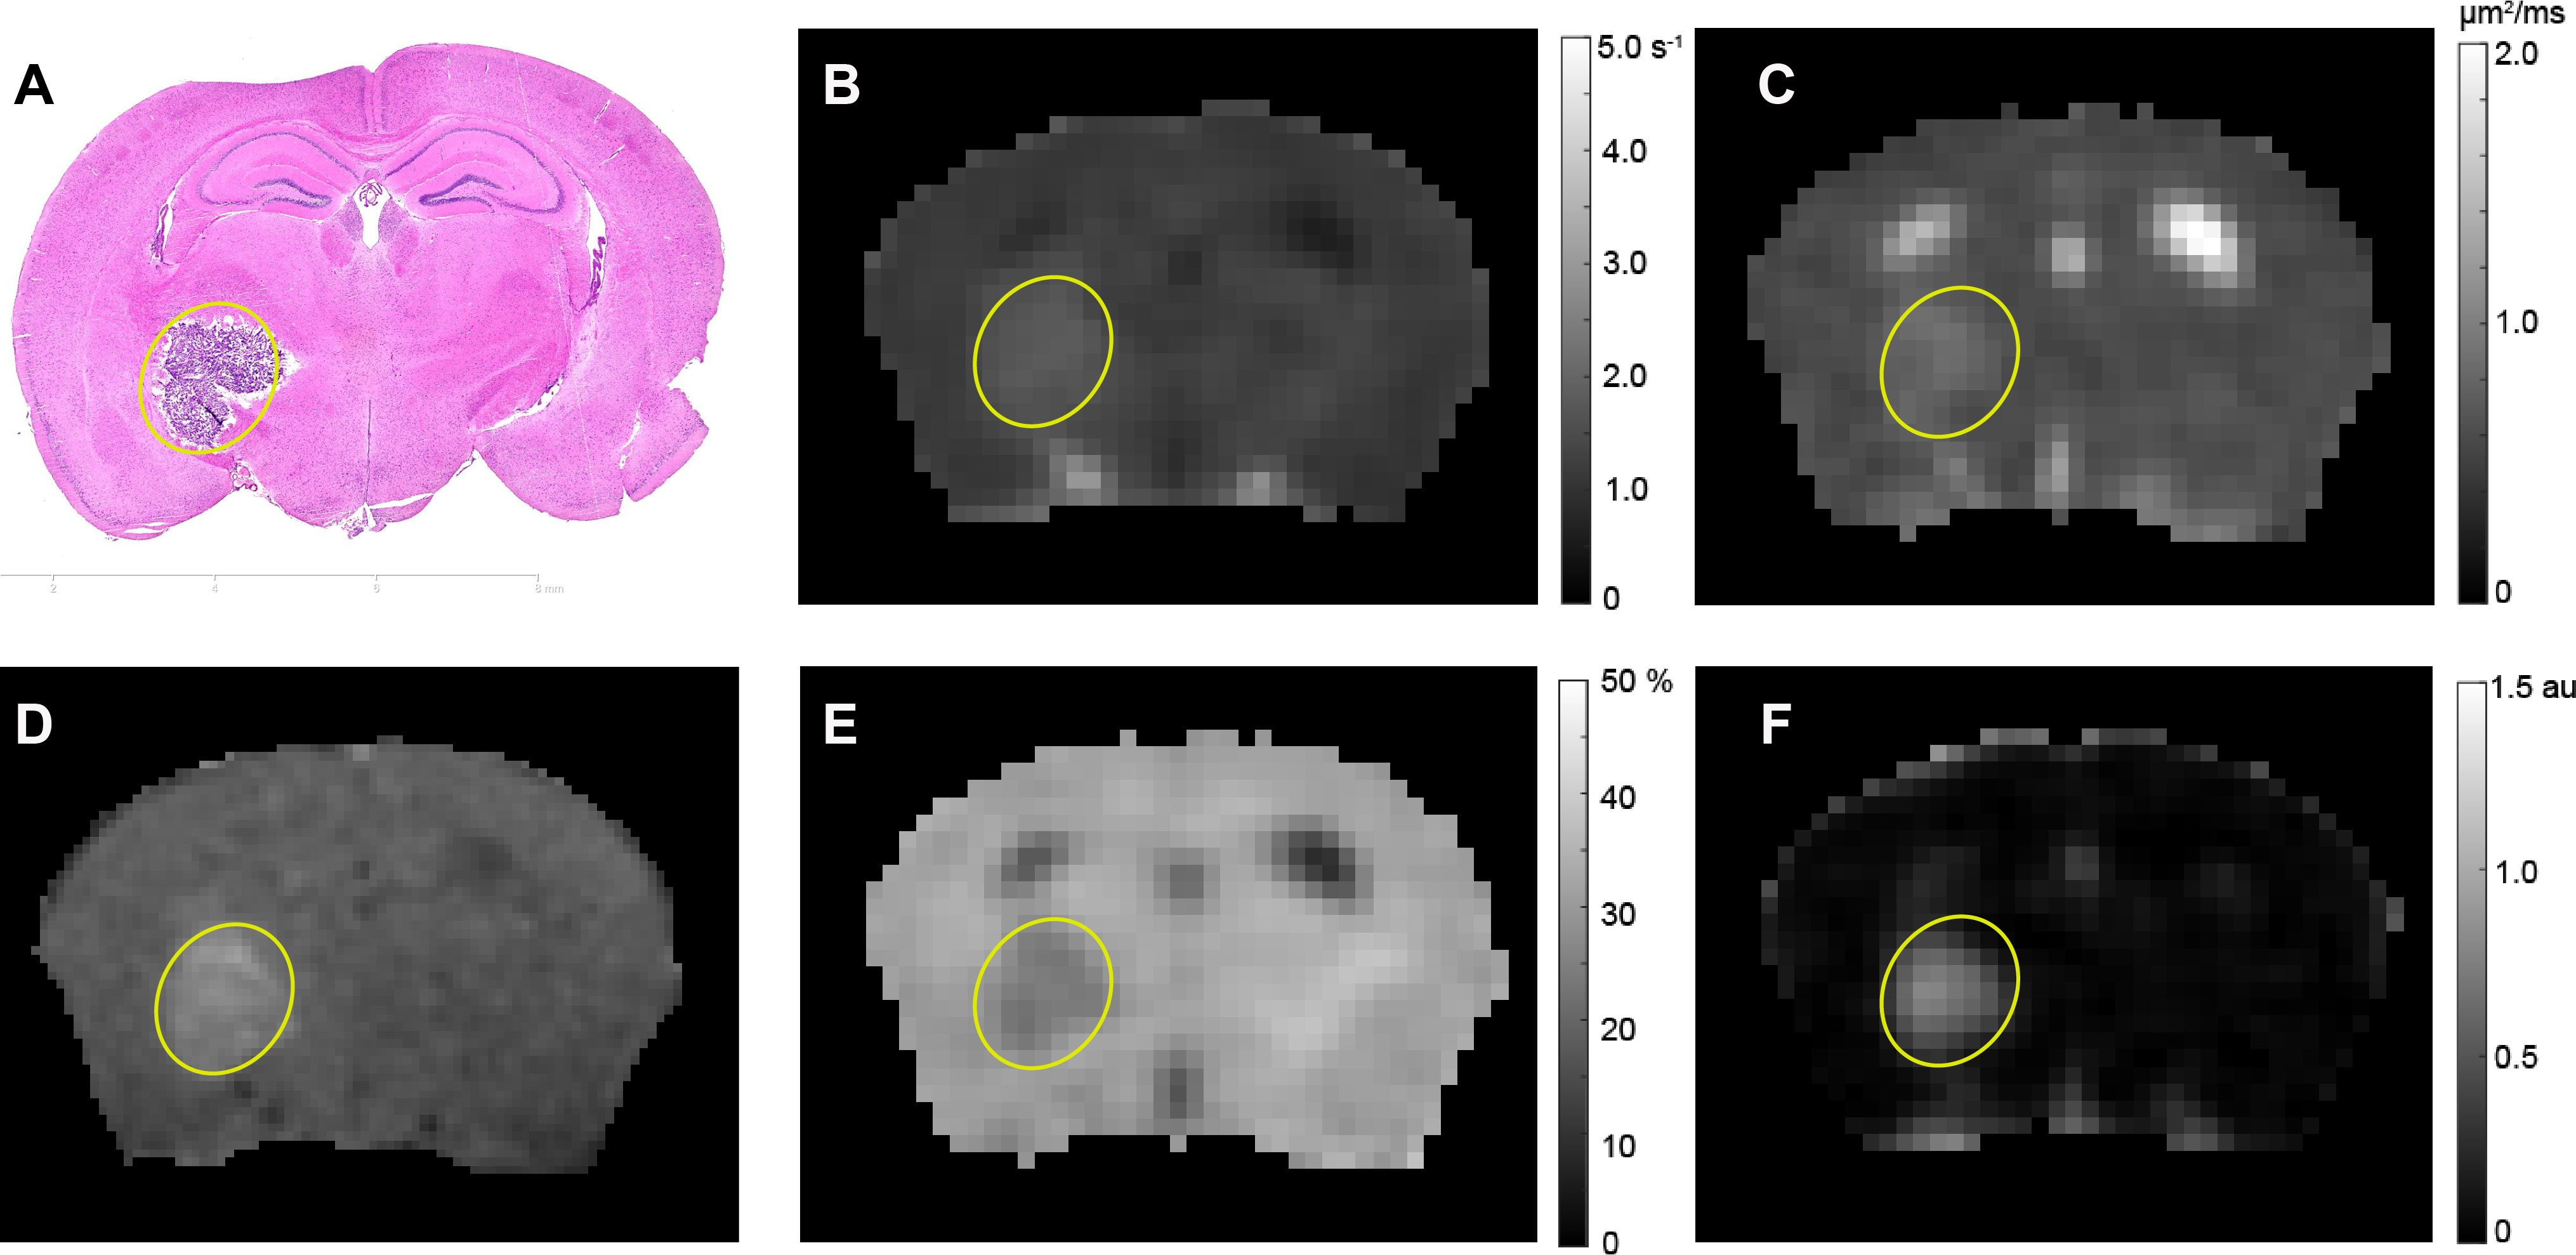
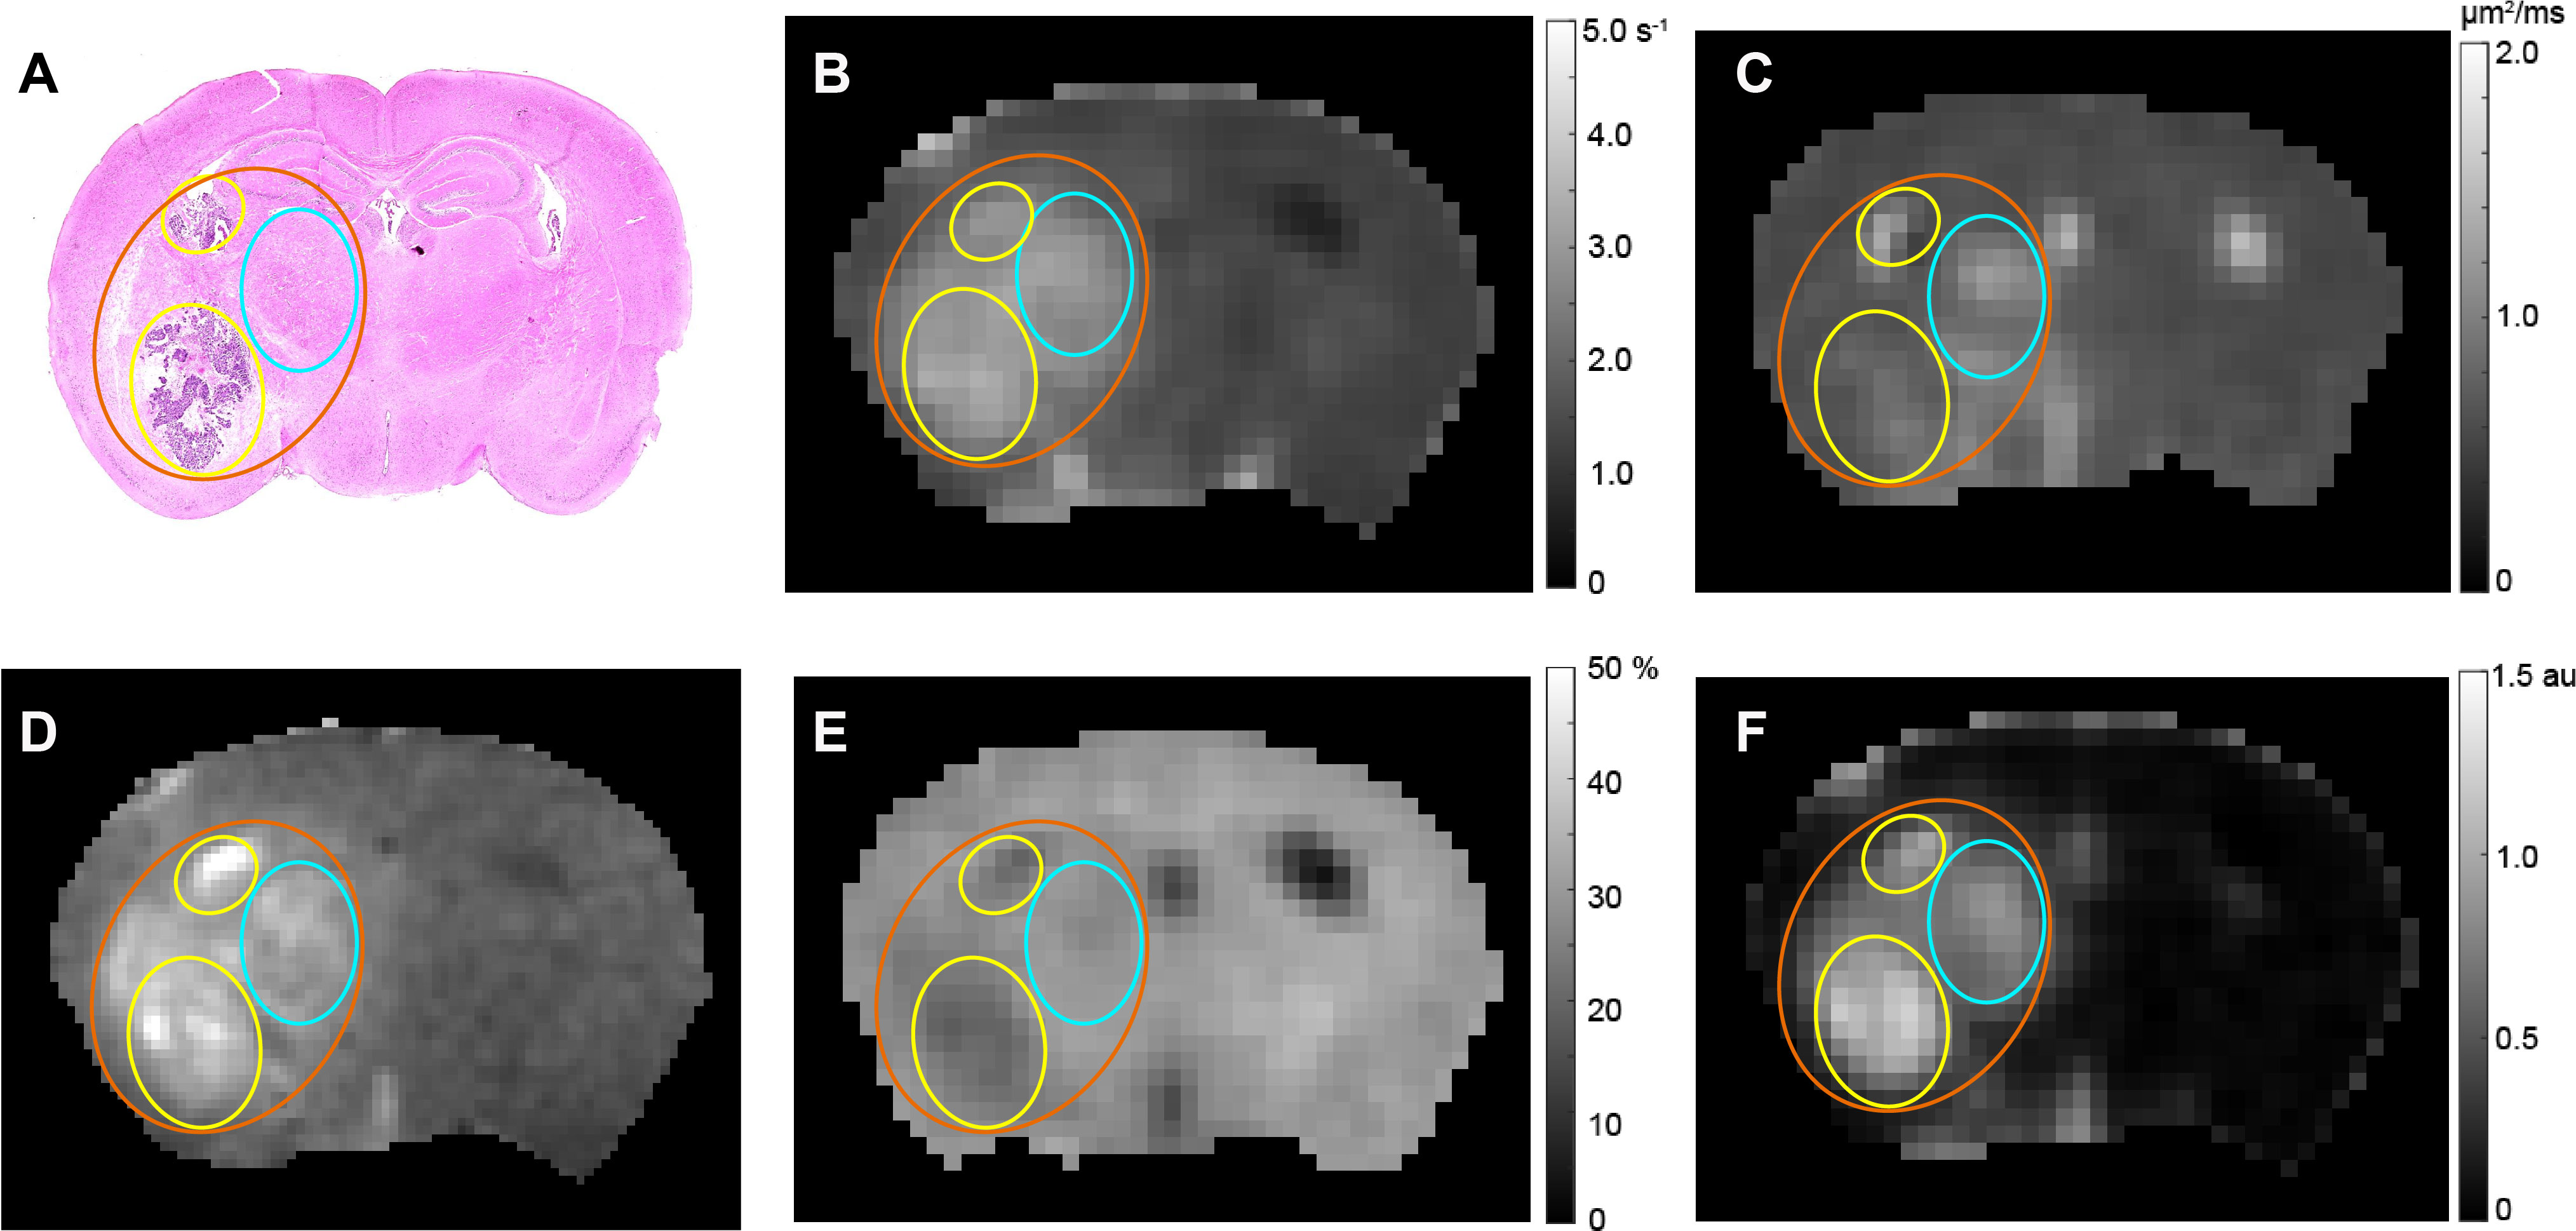
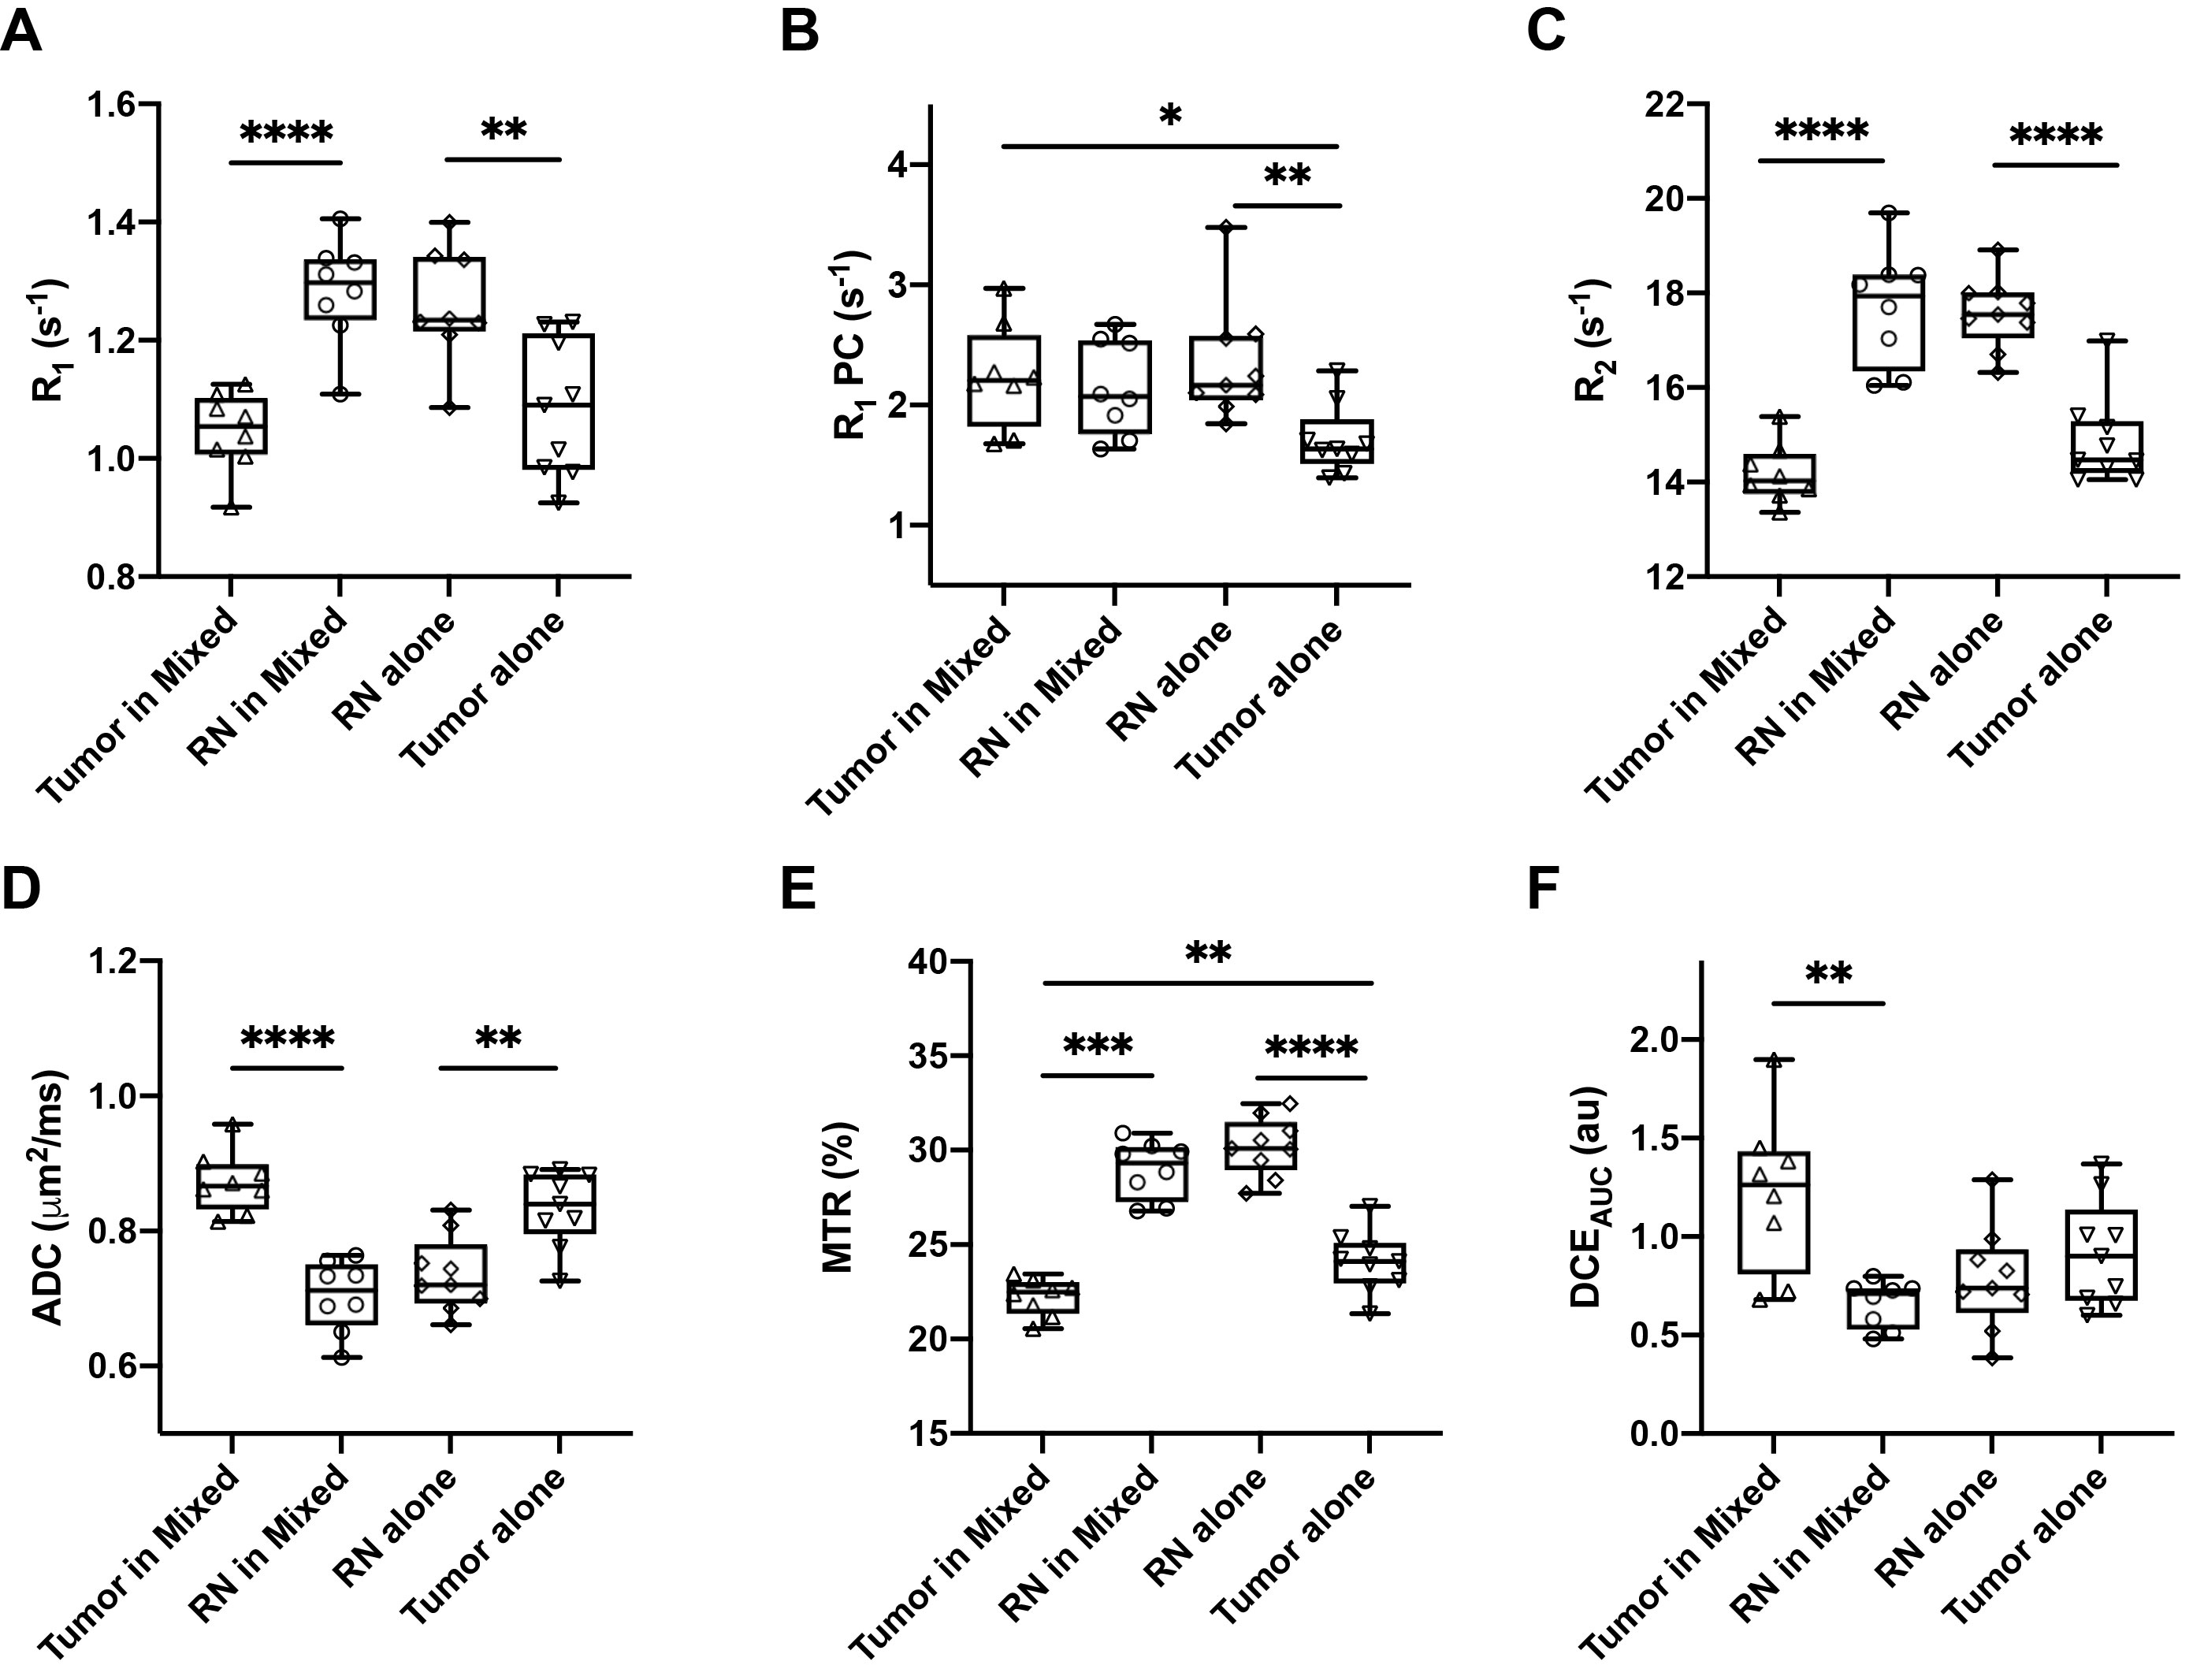
Representative parametric maps for RN alone, tumor alone, and mixed lesion mice are shown in Figures 1 through 3, respectively. All lesion parameters (R1, R1PC, R2, ADC, MTR, DCEAUC) are statistically significantly different vs. contralateral cortex (paired t test, data not shown). Table 1 summarizes measurements of R2, ADC, DCEAUC and MTR in the mixed tumor/RN model. (Results for all parameters are summarized in Figure 4.) For each member of the mixed model cohort (n=8), regions of confirmed tumor and RN were identified by histology, allowing regions of interest for tumor and RN to be drawn on the various parametric maps. Parameter means ±SDs for tumor and RN in the mixed model are reported in Table 1. Differences in R1 (not shown in the table), R2, ADC, DCEAUC, MTR, for tumor vs. RN in the mixed model are all highly statistically significant.Consistent with mixed lesion findings (Table 1), quantitative MR parameter readouts were highly statistically significant comparing tumor alone vs. RN alone and readouts from the pure models (tumor alone, RN alone) were largely similar (not statistically different) compared to regions of the same lesion in the mixed model. Only tumor MTR and DCEAUC values showed statistically significant differences comparing pure vs. mixed lesion (p = 0.01 and p= 0.03, respectively) and these were modest compared to differences between tumor vs. RN mixed-lesion MTR and DCEAUC metrics. Thus, the pure lesion models provide substantial predictive insight into MRI parameter readouts that will be characteristic of tumor vs. RN regions in the mixed lesion.
Discussion
Parametric maps were calculated for lesions identified by H&E in RN only, tumor only, and “mixed lesion” models. Differences in values of these parameters for tumor vs. RN in the mixed lesion model were all statistically significant with the exception of R1PC, demonstrating that the proposed 1H pipeline holds significant promise for identifying tumor recurrence in a background of RN distinct from RN alone. Parametric values for RN and tumor in the “mixed lesion” model are very similar to those for RN and tumor in the pure models, respectively. Thus, the pure lesion models provide substantial predictive insight into MRI parameter readouts that will be characteristic of tumor vs. RN regions in the mixed lesion. All of the contrasts in the pipeline are readily translatable, so the clinical relevance of these findings is high.Conclusion
A quantitative, clinically translatable 1H MR imaging pipeline has been developed and demonstrated to hold considerable promise for differentiating recurrent tumor from treatment effects (e.g., late time-to-onset necrosis) for high-grade tumor patients treated with radiation.Acknowledgements
Research was supported by the Alvin J Siteman Cancer Center Investment Program (supported by the Foundation of Barnes-Jewish Hospital, Cancer Frontier Fund; The Foundation for Barnes Jewish Hospital Fund # B1398; National Cancer Institute, Cancer Center Support Grant, P30 CA091842; and Barnard Trust), and Elekta AB (Stockholm, Sweden). All MR experiments were performed in the Small-Animal Cancer Imaging Shared Resource of the Siteman Cancer Center in partnership with Mallinckrodt Institute of Radiology’s Small-Animal MR Facility, Washington University School of Medicine.References
1. Beeman SC, Shui YB, Perez-Torres CJ, Engelbach JA, Ackerman JJ, Garbow JR. O2 -sensitive MRI distinguishes brain tumor versus radiation necrosis in murine models. Magn Reson Med. 2016;75(6):2442-7.
2. Jiang X, Yuan L, Engelbach JA, Cates J, Perez-Torres CJ, Gao F, Thotala D, Drzymala RE, Schmidt RE, Rich KM, Hallahan DE, Ackerman JJ, Garbow JR. A Gamma-Knife-Enabled Mouse Model of Cerebral Single-Hemisphere Delayed Radiation Necrosis. PLoS One. 2015;10(10):e0139596.
3. Perez-Torres CJ, Engelbach JA, Cates J, Thotala D, Yuan L, Schmidt RE, Rich KM, Drzymala RE, Ackerman JJ, Garbow JR. Toward distinguishing recurrent tumor from radiation necrosis: DWI and MTC in a Gamma Knife--irradiated mouse glioma model. Int J Radiat Oncol Biol Phys. 2014;90(2):446-53.
4. Ge X, Quirk JD, Engelbach JA, Bretthorst GL, Li S, Shoghi K, Garbow JR, Ackerman JJH, Test–Retest performance of a 1-hour multiparametric MR image acquisition pipeline with orthotopic triple-negative breast cancer patient-derived tumor xenografts, Tomography. 2019;5(3):320-331.
5. Quirk JD, Bretthorst GL, Garbow, JR, Ackerman JJH, Magnetic resonance data modeling: the Bayesian analysis toolbox. Concepts Magn Reson Part A. 2019;47A:e21467.
Figures