1235
Multi-contrast MRI Atlas of the Cynomolgus Macaque Brain1Functional Imaging Laboratory, German Primate Center, Göttingen, Germany, 2Georg August Universität Göttingen, Göttingen, Germany
Synopsis
Neuroimaging studies require a species-specific template to promote an exquisite spatial normalization. In this work, we provide a high-resolution multi-contrast MRI template of the cynomolgus macaque (Macaca fascicularis) brain. This template may serve as a standard neuroanatomical template to normalize single subject scans in the stereotaxic space. The incorporation of multiple MRI contrast mechanisms provides excellent contrast between gray matter, white matter, and subcortical structures with fine neuroanatomical details.
Introduction
Our close relatives, the non-human primates (NHP), are indispensable model organisms for studying brain physiology and higher cognitive functions10. Similar to neuroimaging studies in humans, anatomical templates of NHPs enable the analysis of a single-subject brain in a common space, and thus, facilitate comparison across subjects and MR measurements. In particular, species-specific templates are pivotal for neuroimaging studies to enhance reproducibility among studies and research groups8,9. Currently, the majority of openly available high-quality macaque brain templates are from the rhesus macaque (Macaca mulatta) and only very few are available for the cynomolgus macaque (Macaca fascicularis)3,6. To fill the gap we present high-resolution multi-contrast MRI templates for the cynomolgus macaque brain along with cortical, subcortical, and white matter parcellation.Methods
Subjects: 14 healthy female cynomolgus macaques (Macaca fascicularis) within an age range between 8 and 20 years (mean = 15 years) were included in this study.Data Acquisition: MRI acquisitions were carried out at 3T (MAGNETOM Prisma, Siemens) using a 7 cm single loop coil for signal detection.
T1-weighted (T1w) images were acquired using a 3D MPRAGE sequence with an echo time/ repetition time (TE/TR) of 2.7/2700 ms, a flip angle (FA) = 8˚, and a spatial resolution of 0.5 x 0.5 x 0.5 mm3.
T2-weighted (T2w) data were acquired using a fast spin-echo sequence with TE/TR = 17/8000 ms, spatial resolution = 0.4 x 0.4 x 0.9 mm3, and echo number = 1.
Maps of magnetic susceptibility (QSM)1 and transverse relaxation rate (R2*) were calculated from 3D multi-echo gradient echo (ME-GRE) data sets obtained with TE1/spacing/TE9/TE10/TR = 3.7/4.9/43/50.4/57 ms, FA = 20˚ and spatial resolution = 0.312x0.312x0.312 mm³.Magnetization Transfer (MT) saturation (MTsat) and apparent T1 (T1app) maps were calculated using a three-point acquisition scheme5 by acquiring MT - , proton density (PD) - , and T1-weighted images. Therefore a 3D FLASH sequence with TE/TR = [3.2, 3.2, 3.2]/[30, 25, 10] ms, FA = [5˚, 5˚, 15˚], and spatial resolution of 0.5x0.5x0.5 mm3.
Template analysis: Single-subject T1w, T2w, MTw, and mean of ME-GRE across echo times (mGRE) images were denoised and corrected for bias fields using the ANTs tool2. The skull stripping was performed manually for each subject using ITK-SNAP.
The T1w study template was constructed using the ANTs template construction pipeline7 after rigidly registering each scan to the NMT v2 rhesus macaque template6. To generate the symmetric template all 14 scans were duplicated and mirrored about the hemispheric plane. The resulting 28 volumes were then used to generate the final unbiased group average template.
Subject multimodal contrasts (T2w, MTw, and mGRE) were linearly registered to the same subject T1w image. The resulting linear deformation field and nonlinear deformation field from the subject T1w to final symmetric T1w template registration were concatenated for each subject. These concatenated deformation fields were then used to transform multimodal contrasts from native subject space into the symmetric template space. The openly available rhesus macaque atlases NMT v2 symmetric4,6, D9912, and INIA1911 were used for the classification of the brain structures. For that, the symmetric T1-weighted cynomolgus template was nonlinearly registered to the respective atlas using ANTs. Finally, all labels were manually assessed and refined wherever required.
Results
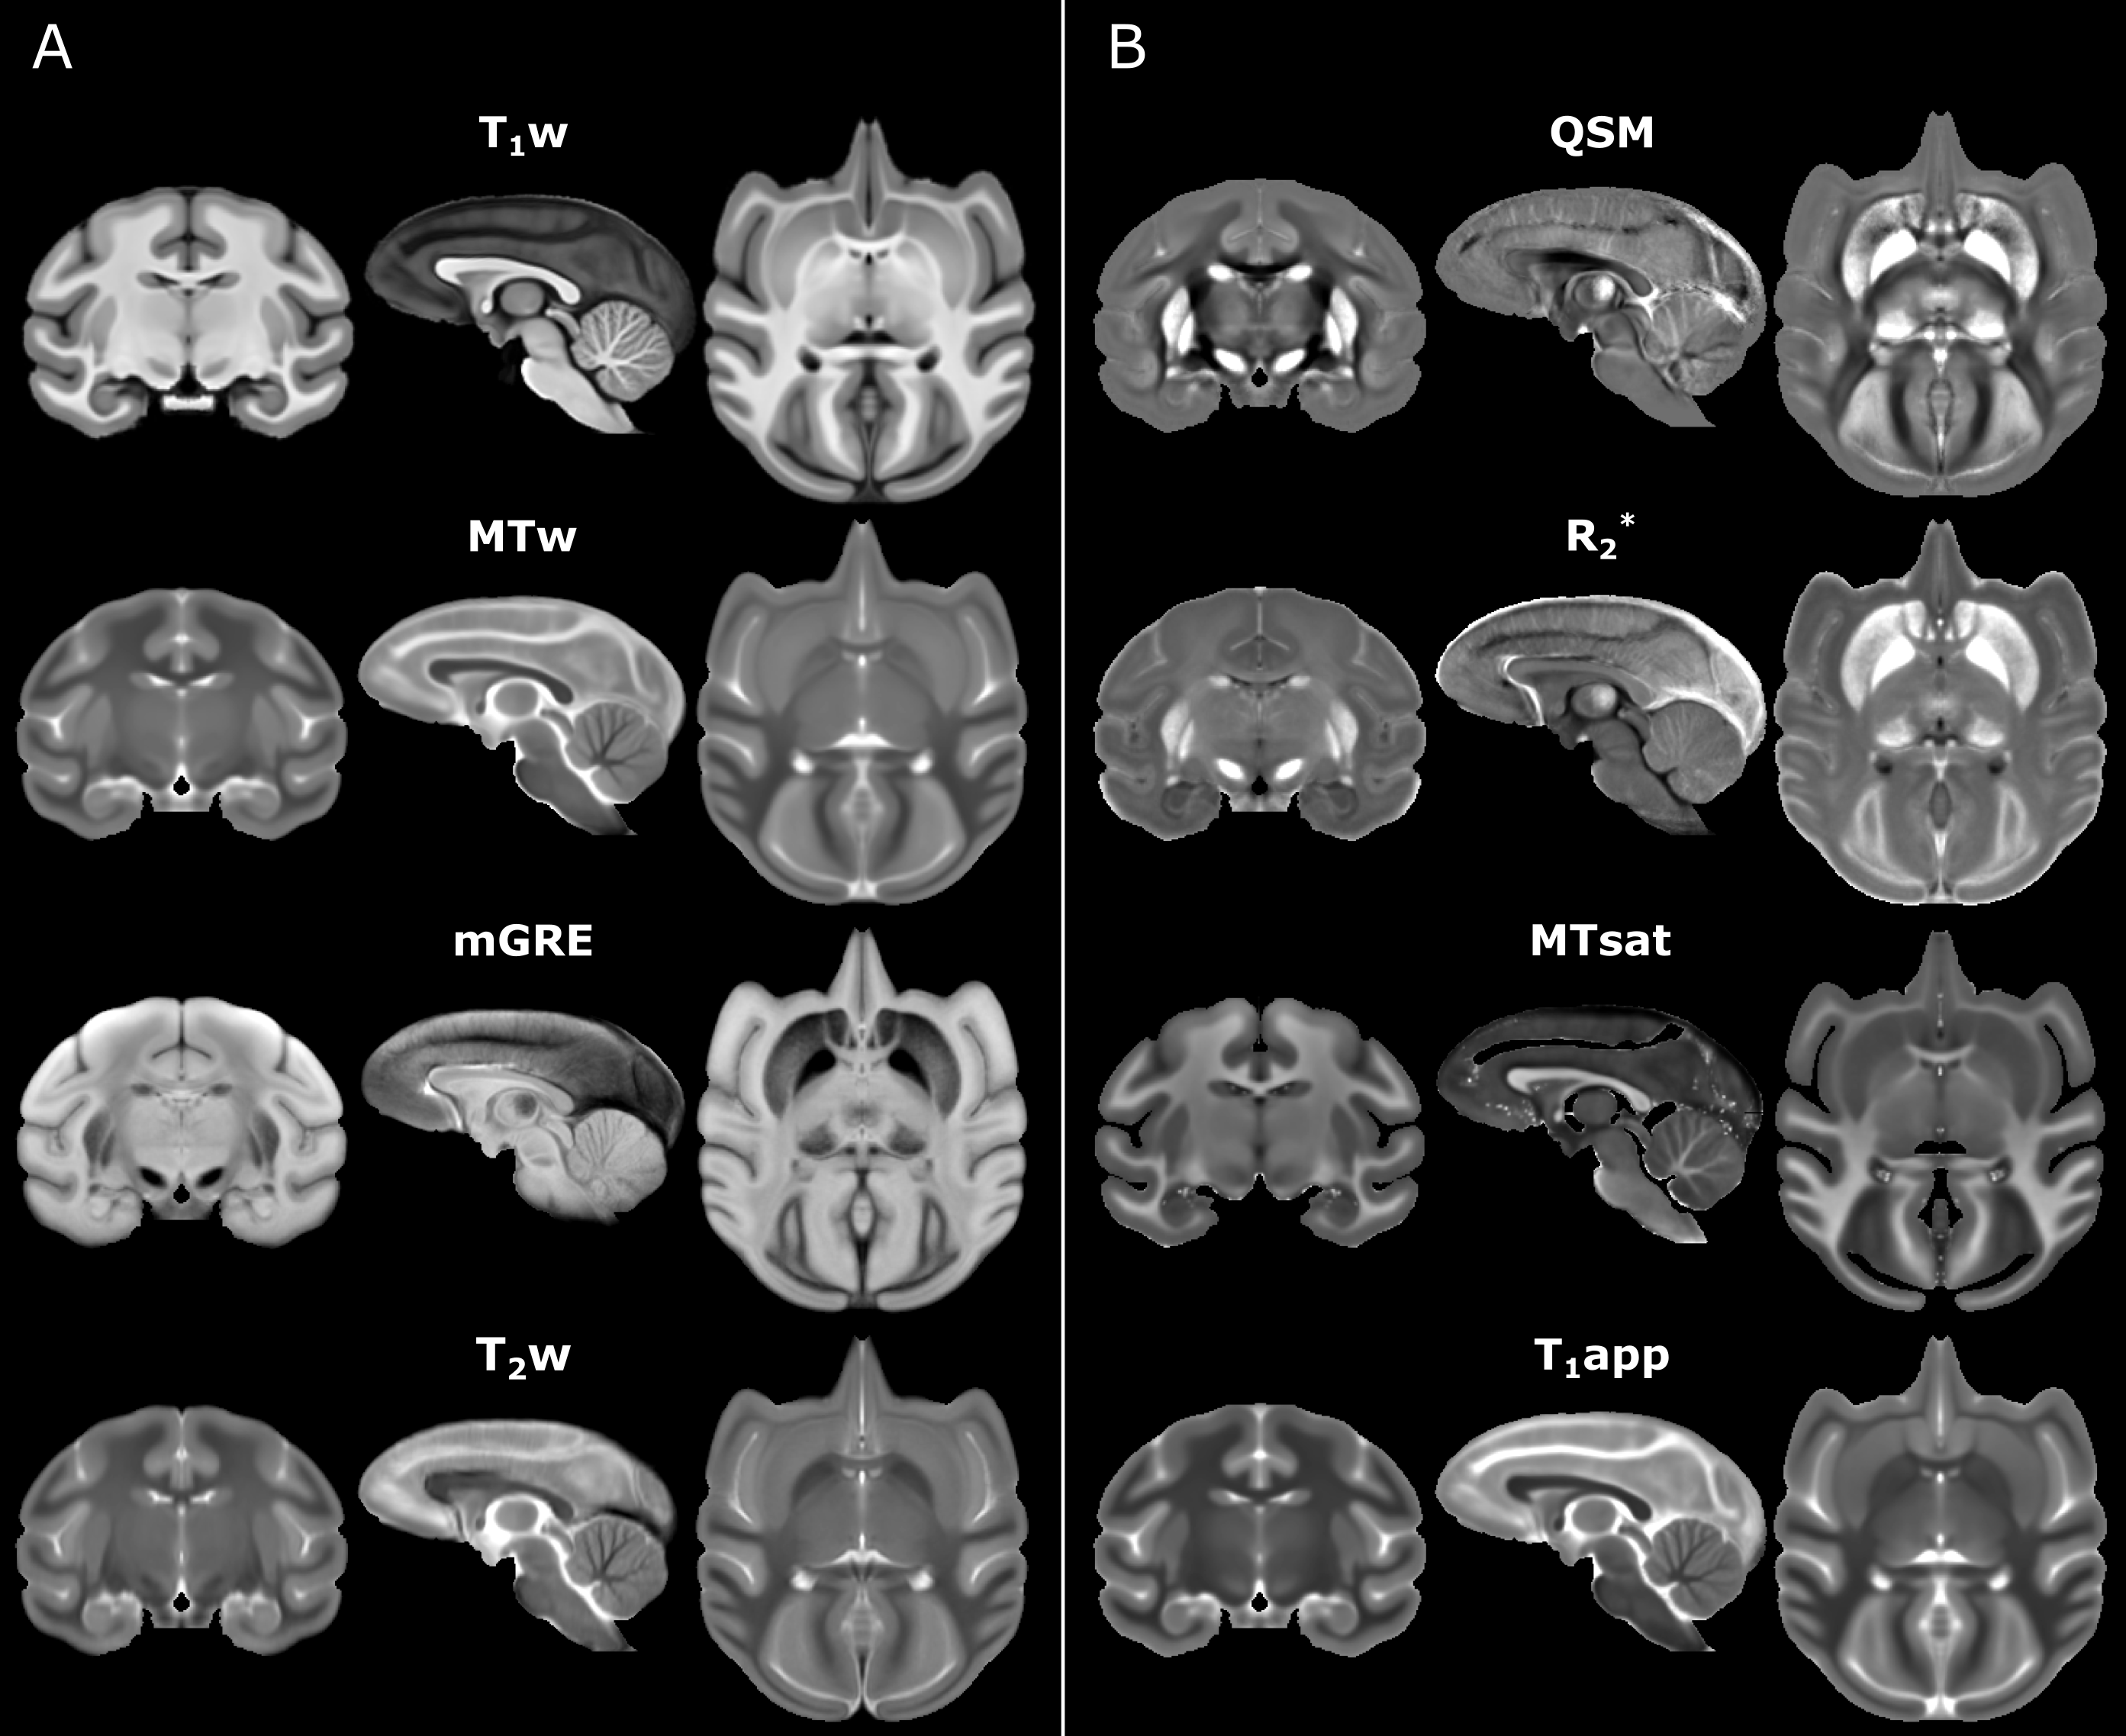
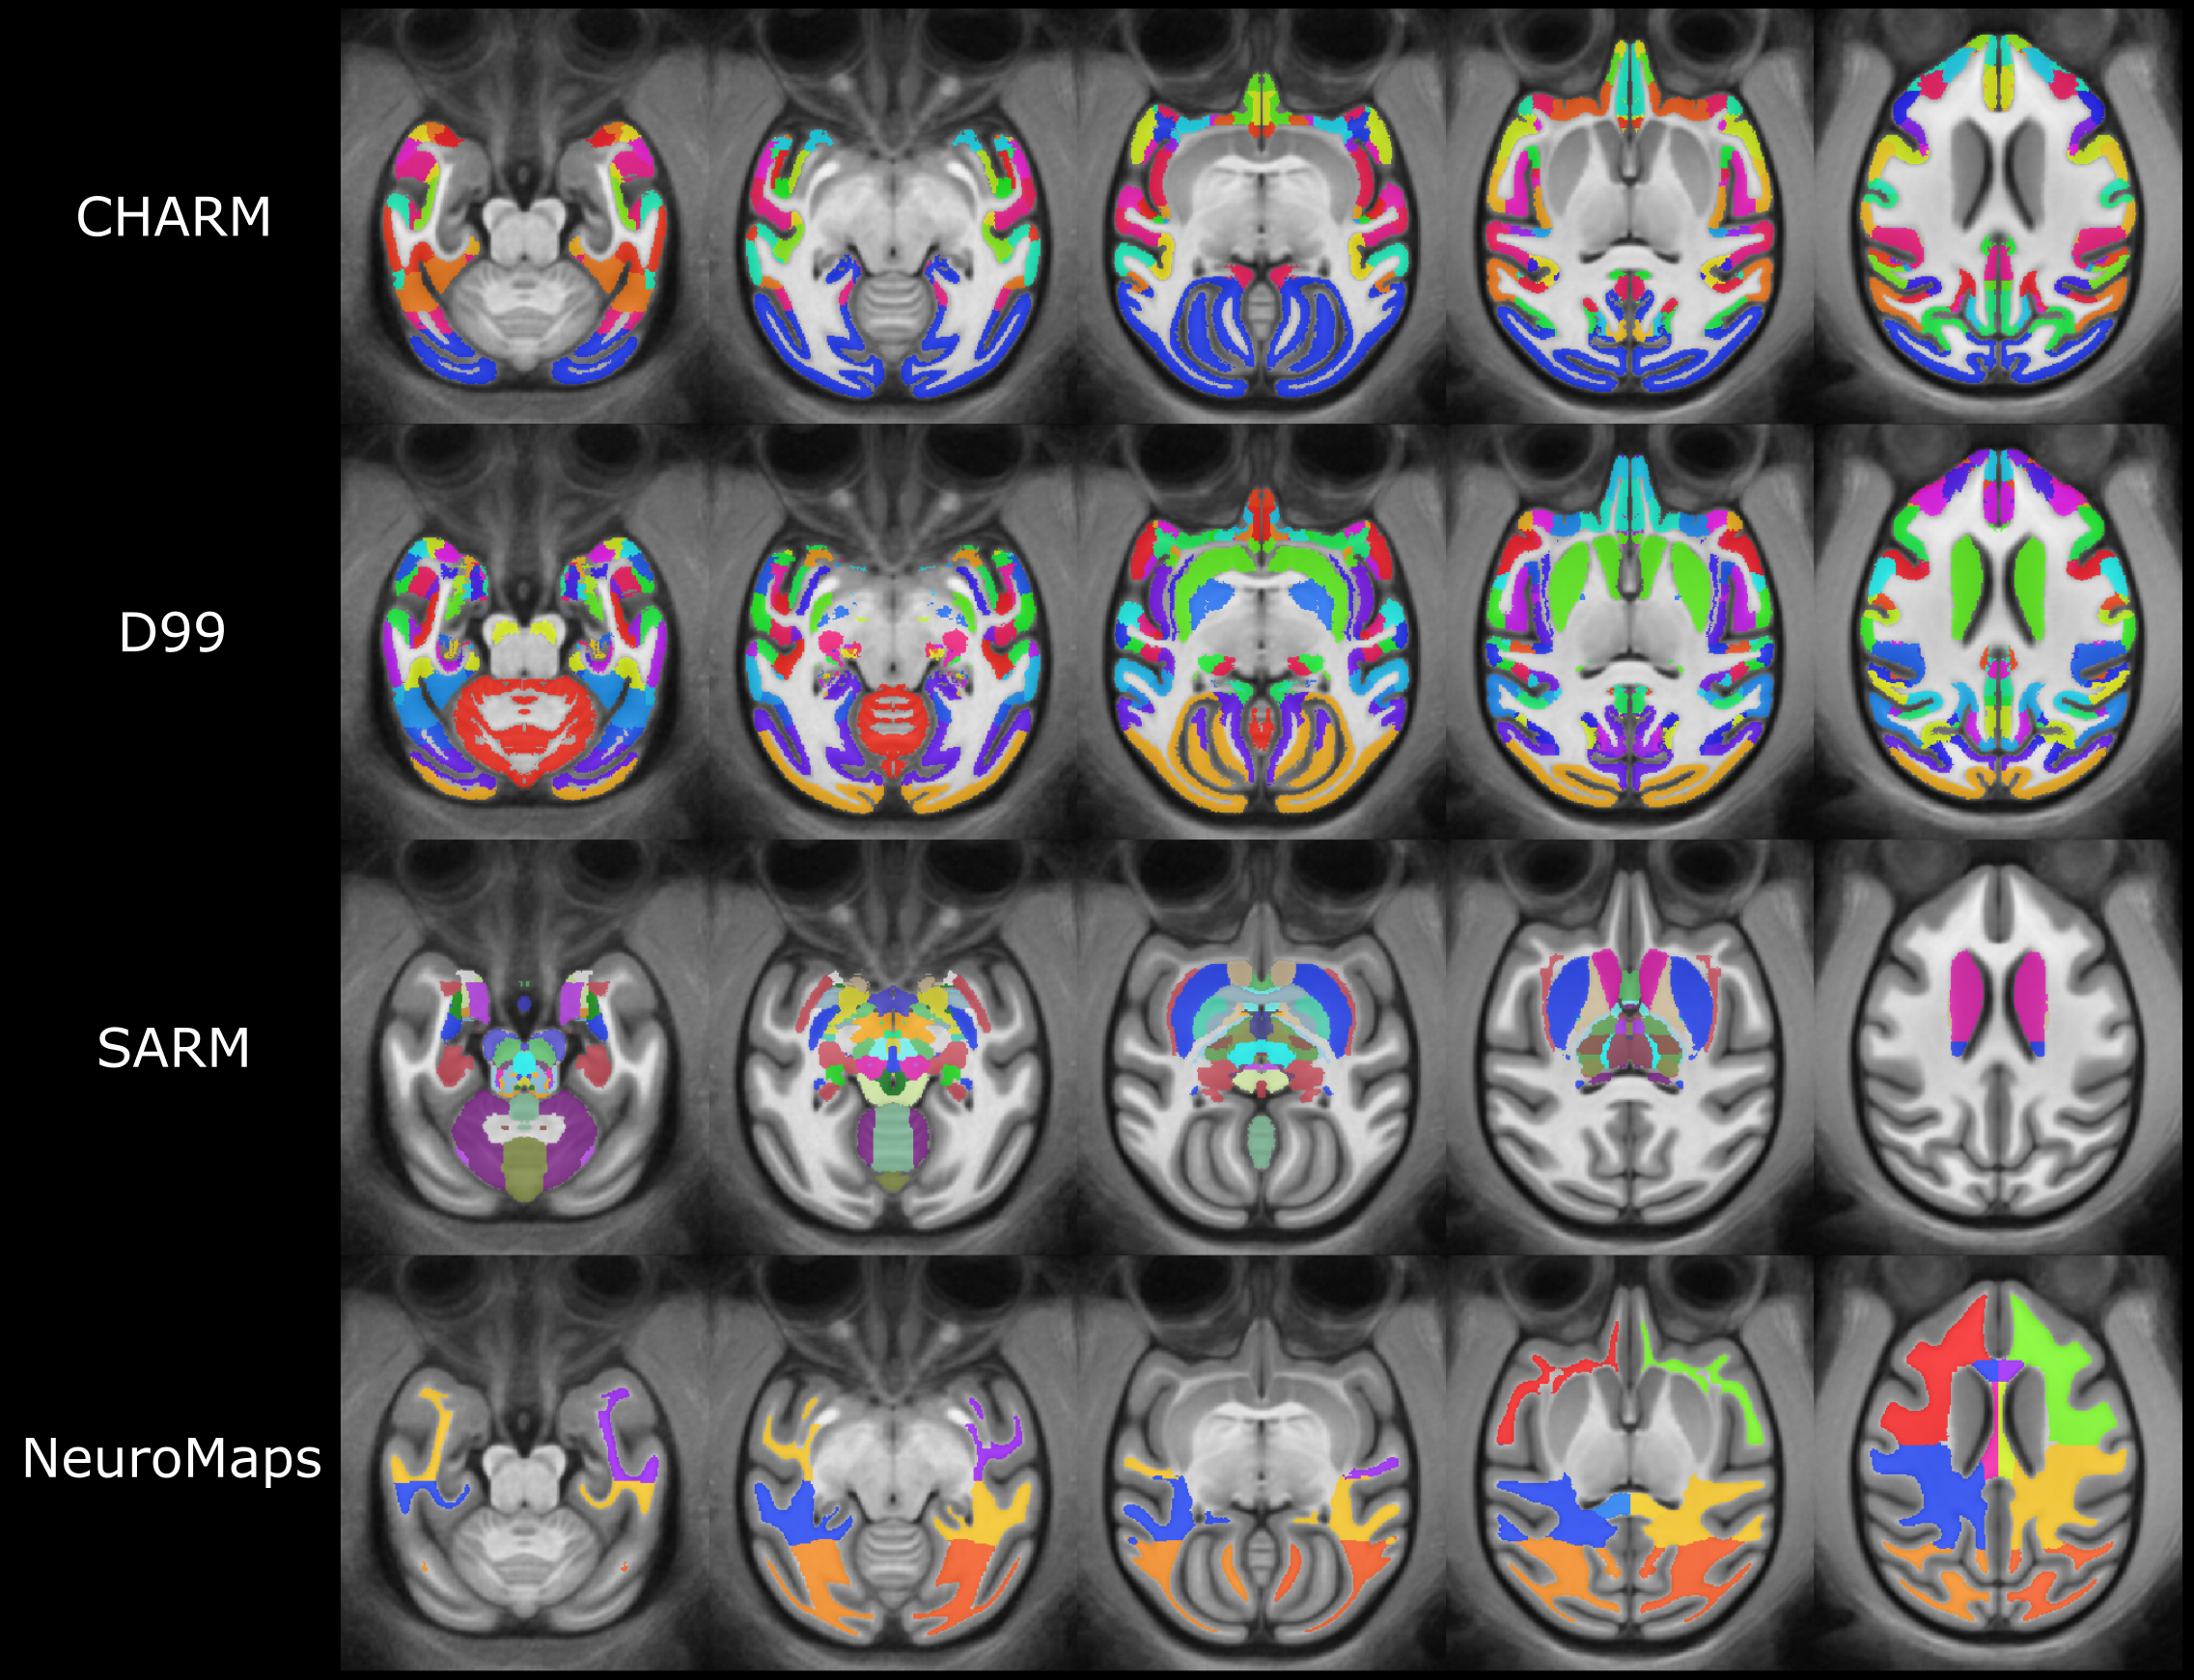
We provide multi-contrast MRI symmetric templates for cynomolgus macaque brain which include weighted images as well as quantitative maps (Figure 1). As shown in Figure 1, each contrast provides special insights into brain anatomy. For instance, the T1w template and the MT saturation map show an excellent gray-and-white matter contrast, while the template of QSM and the R2* map particularly accentuate subcortical gray matter nuclei.Structural labels derived from the rhesus macaque atlases are exemplarily shown in Figure 2 and include detailed hierarchical parcellation (6 levels) for the cortical (CHARM6) and subcortical (SARM4) structures. White matter regions of interest comprise frontal, cerebral, temporal, and occipital white matter and three parts of the corpus callosum, namely genu, body, and splenium (NeuroMaps).
Discussion and Conclusion
We provide a high-resolution multi-contrast MRI template for the cynomolgus macaque brain in stereotaxic space. These templates include both weighted images and quantitative maps. The incorporation of multiple MRI contrasts allowed for better and detailed visualization of brain structures and may be used for further anatomical parcellation and may enhance the performance of algorithms for automatic brain tissue segmentation. The species-specific template dedicated to the cynomolgus macaque brain may help to improve the precision of neurosurgery and other invasive brain intervention and the reproducibility of MRI and electrophysiology studies across laboratories.Acknowledgements
We wish to thank Kristin Kötz for her help in technical assistance.References
1. Acosta-Cabronero, J., et al., 2018. A robust multi-scale approach to quantitative susceptibility mapping. Neuroimage 183, 7–24.
2. Avants, B.B., et al., 2011. A reproducible evaluation of ANTs similarity metric performance in brain image registration. Neuroimage 54, 2033–2044.
3. Frey, S., et al., 2011. An MRI based average macaque monkey stereotaxic atlas and space (MNI monkey space). NeuroImage 55, 1435–1442. 4. Hartig, R., et al., 2020. Subcortical Atlas of the Rhesus Macaque (SARM) for Magnetic Resonance Imaging. bioRxiv 2020.09.16.300053.
5. Helms, G., et al., 2008. High-resolution maps of magnetization transfer with inherent correction for RF inhomogeneity and T1 relaxation obtained from 3D FLASH MRI. Magn Reson Med 60, 1396–1407.
6. Jung, B., et al., 2020. A comprehensive macaque fMRI pipeline and hierarchical atlas. bioRxiv 2020.08.05.237818.
7. (https://github.com/CoBrALab/twolevel_ants_dbm).
8. Messinger, A., et al., 2020. A collaborative resource platform for non-human primate neuroimaging. NeuroImage 117519.
9. Milham, M.P., et al., 2018. An Open Resource for Non-human Primate Imaging. Neuron 100, 61-74.e2.
10. Roelfsema, P.R., et al., 2014. Basic Neuroscience Research with Nonhuman Primates: A Small but Indispensable Component of Biomedical Research. Neuron 82, 1200–1204.
11. Rohlfing, T., et al., 2012. The INIA19 Template and NeuroMaps Atlas for Primate Brain Image Parcellation and Spatial Normalization. Front. Neuroinform.
12. Saleem, K.S., Logothetis, N.K., 2012. A Combined MRI and Histology Atlas of the Rhesus Monkey Brain in Stereotaxic Coordinates. Academic Press.
Figures