1234
3D Isotropic-resolution Non-rigid Motion Compensated Liver T1, T2 and fat fraction mapping1University College London, London, United Kingdom, 2King's College London, London, United Kingdom
Synopsis
Quantitative T1 and T2 mapping has shown promising results in the quantification of liver fibrosis and inflammation, whereas proton density fat fraction mapping has been used to quantify the hepatic lipid content in fatty liver diseases. Conventionally multiple sequential 2D breath-held scans are performed to acquire sequential 2D T1, T2 and fat fraction maps. However, this approach suffers from limited spatial resolution and coverage and potential misregistration errors. In this work, we sought to develop a free-breathing non-rigid motion corrected 3D sequence for simultaneous and co-registered acquisition of joint liver T1, T2 and fat fraction maps for quantitative tissue characterization
Introduction
Quantitative T1 and T2 mapping has shown promising results in the identification and quantification of liver fibrosis and inflammation1, whereas proton density fat fraction mapping has been used to quantify the hepatic lipid content in fatty liver diseases2. Conventionally multiple sequential 2D breath-held scans are performed to acquire 2D T1, T2 and fat fraction maps separately. However, this approach suffers from limited spatial resolution and coverage and potential misregistration errors. In this work, we sought to develop a free-breathing non-rigid motion corrected 3D sequence for simultaneous and co-registered acquisition of joint liver T1, T2 and fat fraction maps for quantitative tissue characterization.Methods
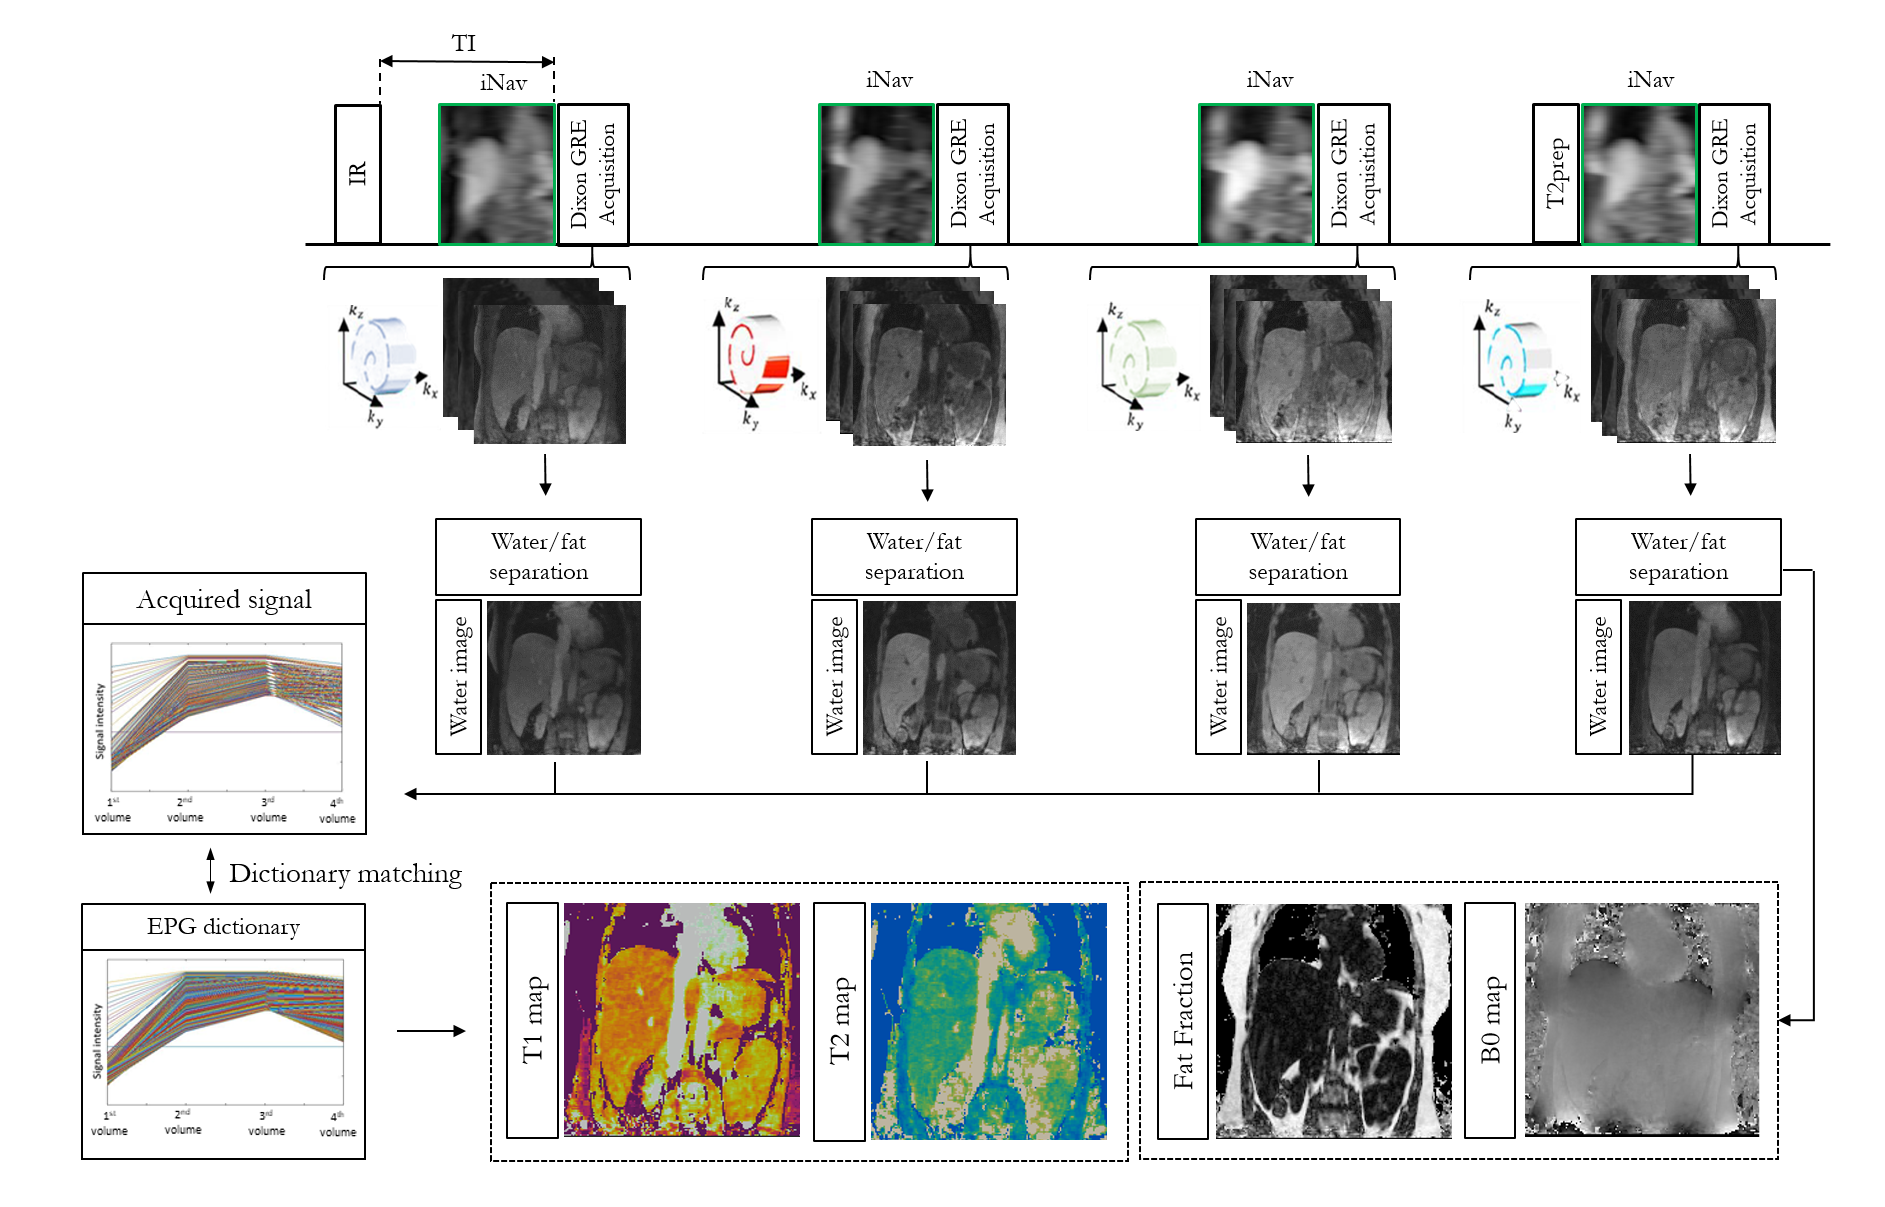
The proposed framework is shown in Figure 1. Four interleaved volumes are acquired with variable density Cartesian trajectory3,4, three-point Dixon GRE readout and 1) IR-preparation, 2 and 3) no-preparation, 4) T2-preparation respectively. 2D low-resolution image based navigators (iNAVs)5 are acquired prior to imaging to estimate and correct for shot-to-shot translational respiratory motion, enabling 100% scan efficiency. A 3D bin-to-bin non-rigid motion corrected multi-contrast patch-based low-rank reconstruction (non-rigid HD-PROST)6 is performed to jointly reconstruct the acquired echoes. A water-fat separation algorithm7 is used to generate water and fat images for each dataset, and the four water images are used to obtain the signal evolution across the four acquired volumes. Extended phase graph (EPG) simulations8, matching the acquisition parameters, are carried out to generate a simulated dictionary and quantitative water T1 and T2 maps are generated by matching each voxel measured signal evolution to the closest dictionary entry9. Fat fraction and M0 maps are obtained from the water-fat separation algorithm. Five healthy subjects were scanned on a 1.5T scanner (Siemens Magnetom Aera) to validate the proposed free-breathing sequence. Sequence parameters included: coronal orientation, Dixon encoded GRE readout, FA = 8 degrees, 14 echoes for iNAV acquisition, isotropic resolution of 2mm3 and ~6min scan time. Three subjects were acquired with in-out-phase dual echo Dixon encoding (TE1/TE2 = 2.38/4.76ms) to test T1 and T2 encoding of the acquisition scheme and the non-rigid motion corrected reconstruction. Two additional subjects were acquired with a 3-point Dixon encoding (TE/ΔTE=2.0/1.36ms) allowing to reconstruct 3D fat fraction and M0 maps in addition to 3D T1 and T2 maps.Results
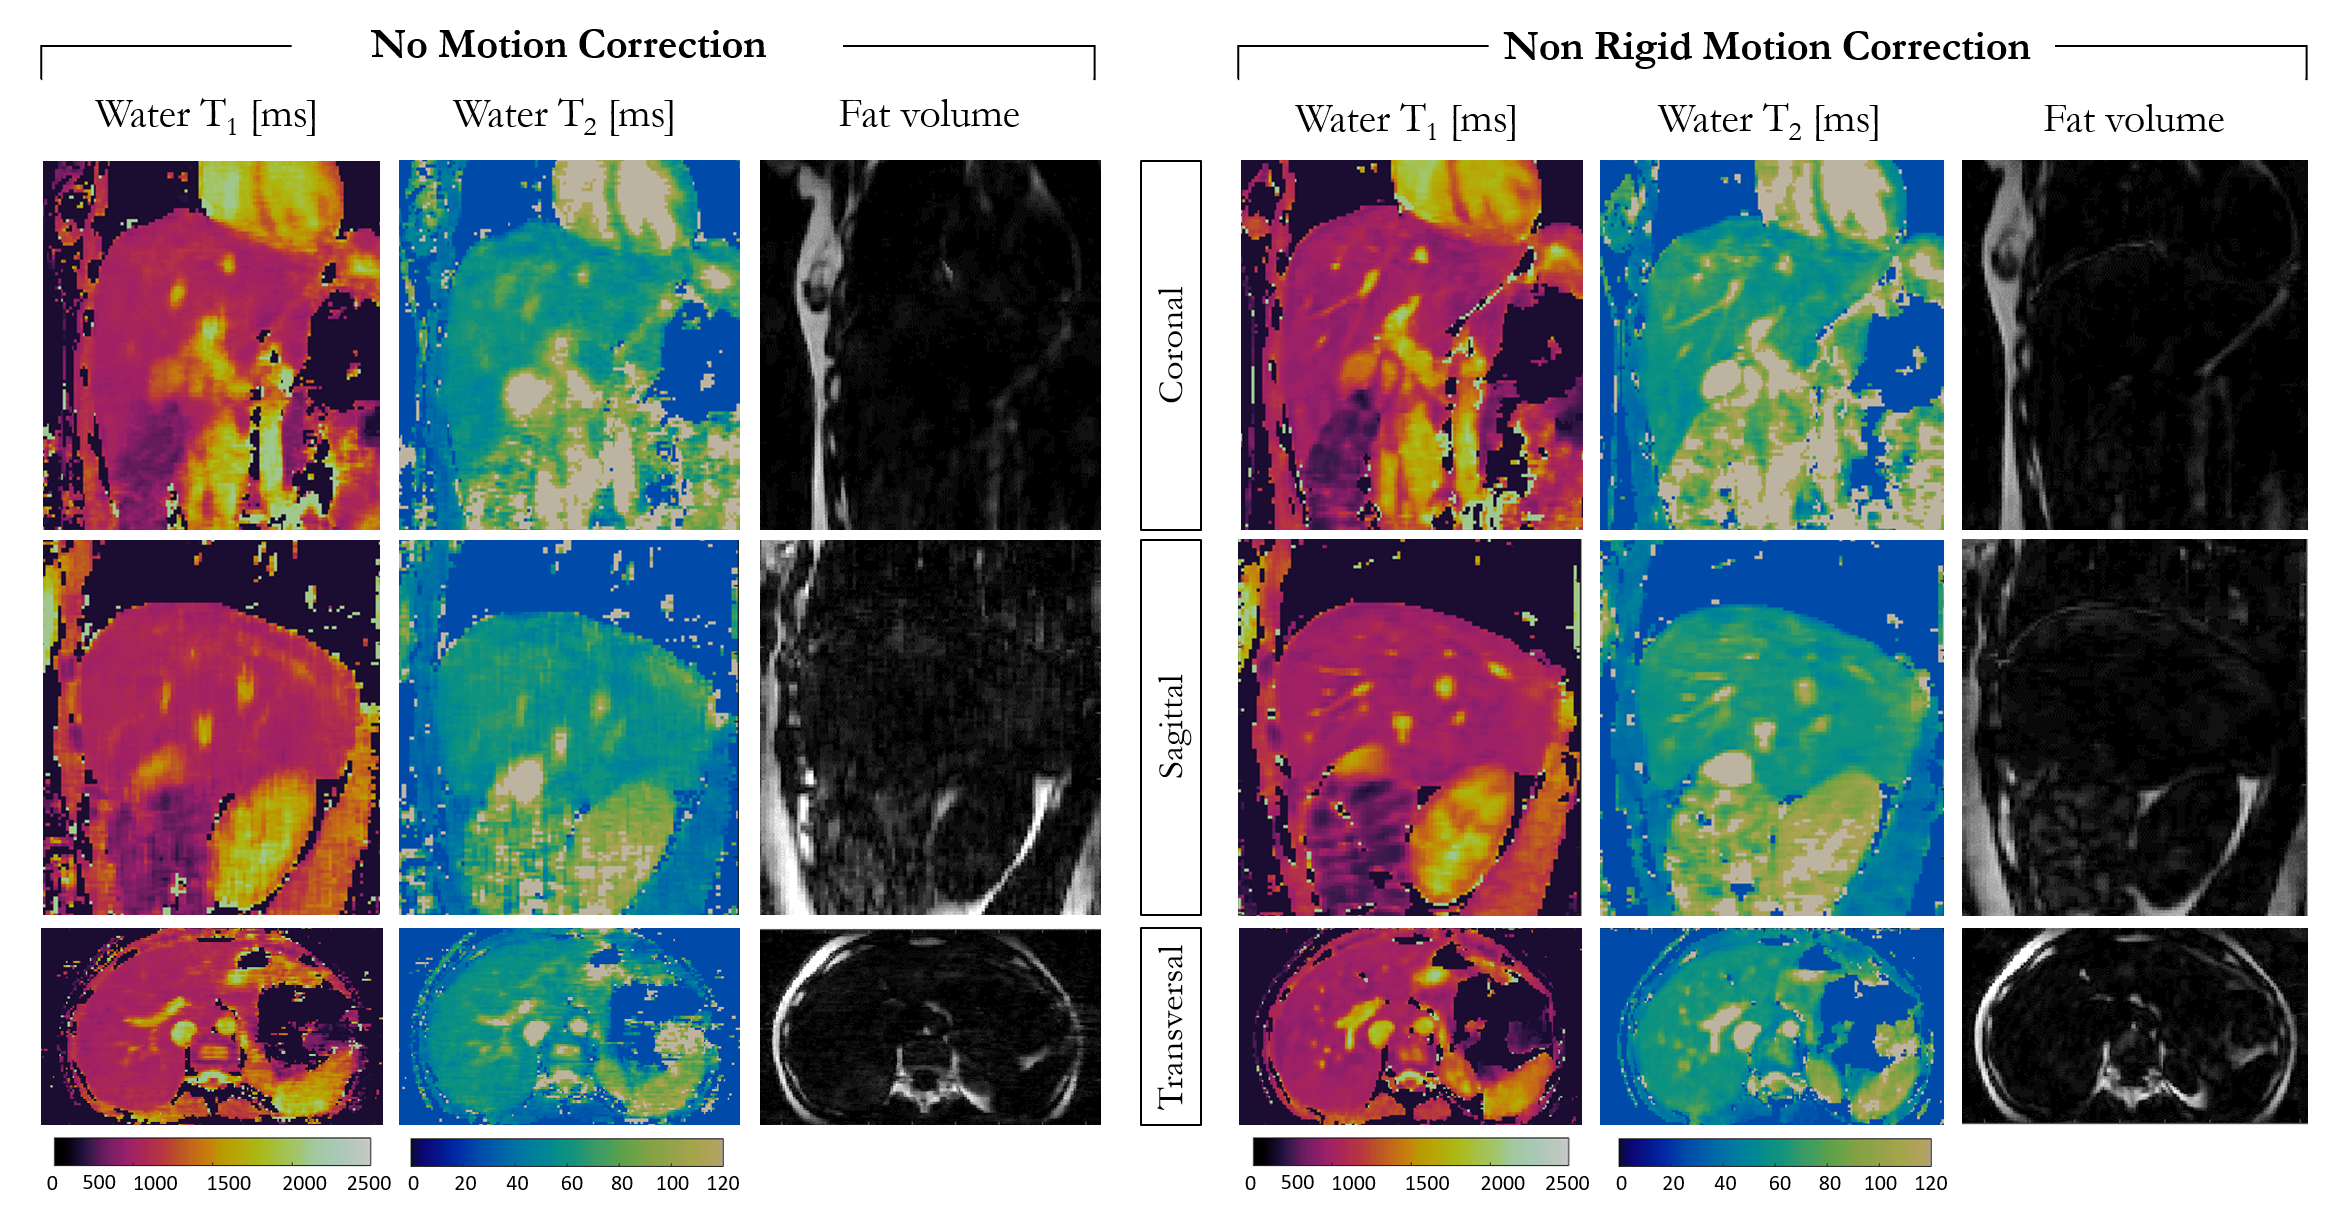
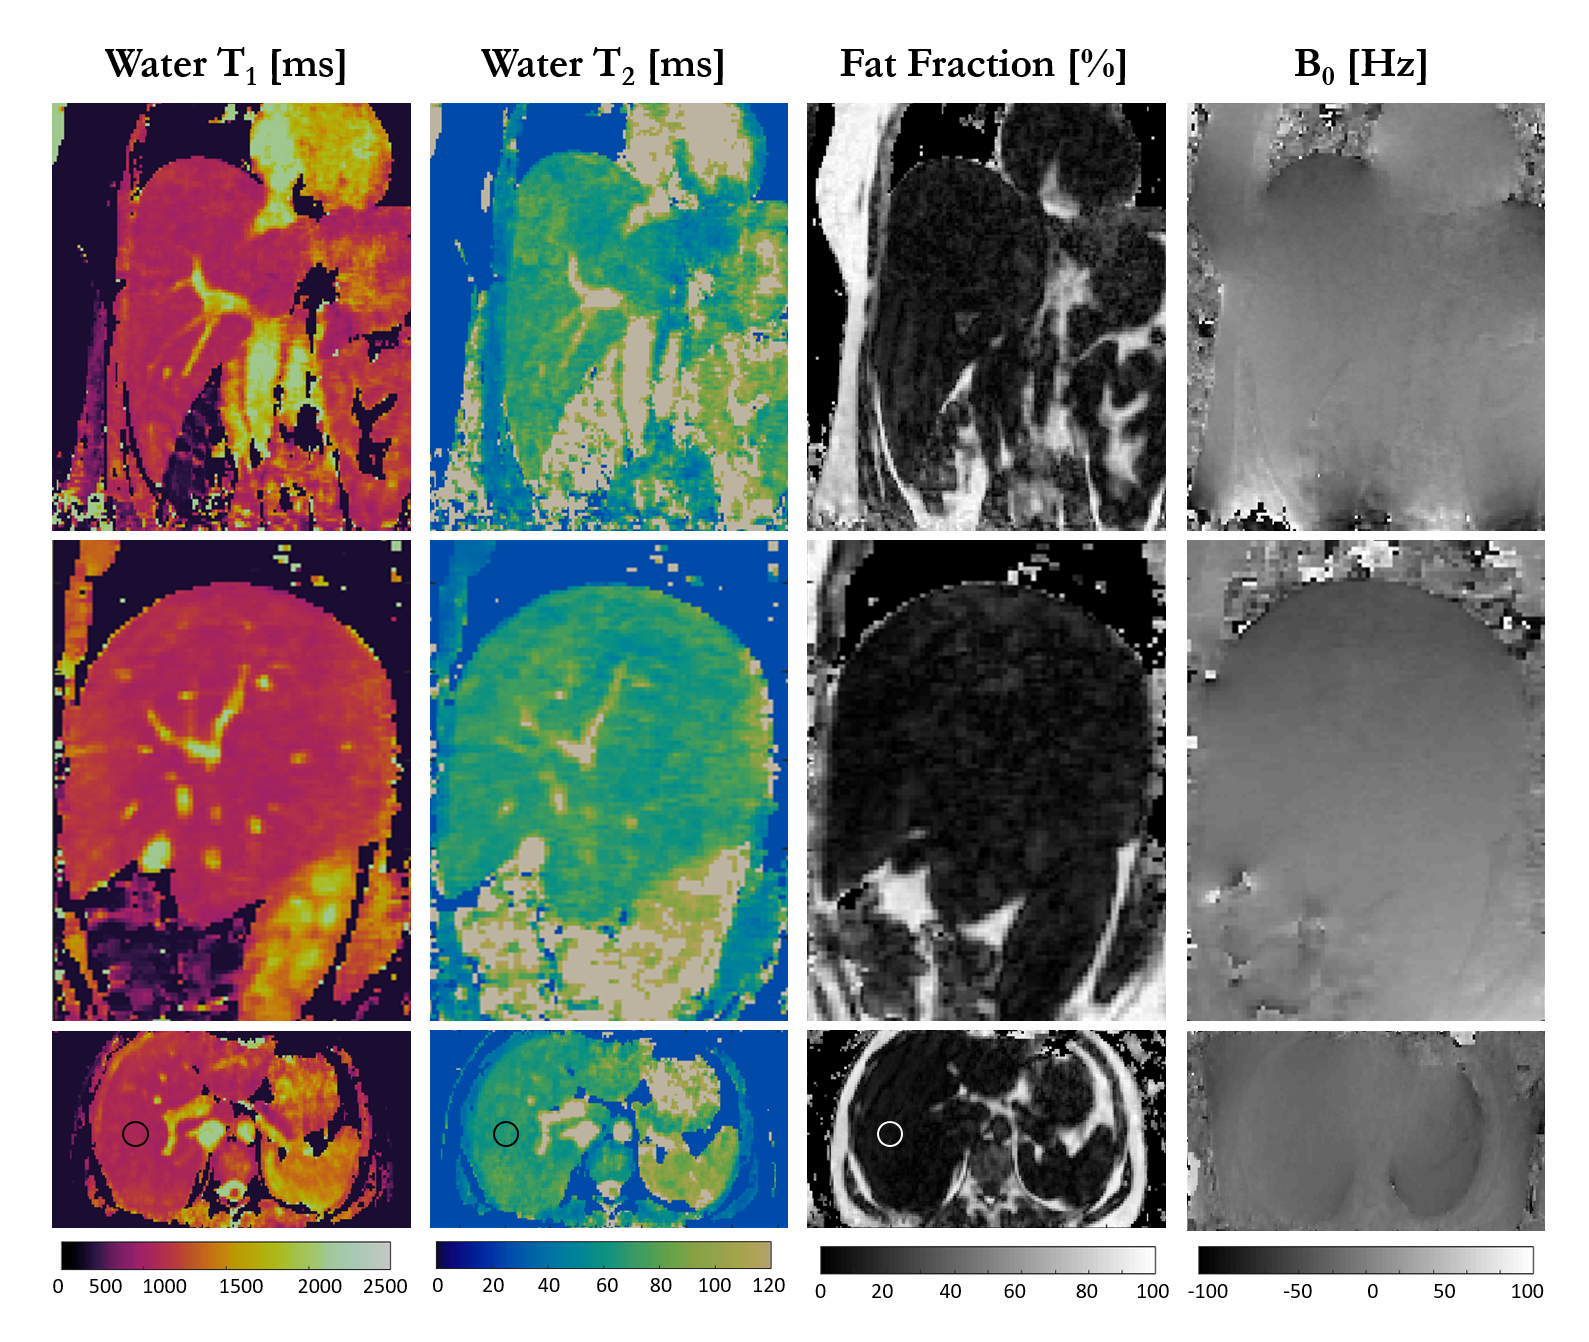
Water T1 and T2 maps and fat volume obtained with and without non-rigid motion correction are shown for one healthy subject in coronal, sagittal and transversal views in Figure 2. Depiction of small vessels and increased sharpness is obtained with non-rigid motion correction in every reformatted view. Good agreement in T1 and T2 values was obtained within a ROI in the liver with and without motion correction (T1MOCO = 601±15ms, T2MOCO = 62±2ms and T1NO_MOCO = 669±32ms, T2NO_MOCO = 56±4ms), although a reduced spatial variability was observed with non-rigid motion correction. T1, T2, fat fraction and M0 maps for one healthy subject acquired with 3-point Dixon are shown in Figure 3 in coronal, sagittal and transversal orientation. T1 = 704±30ms and T2 = 58±3ms were measured within a ROI in the liver and are in good agreement with literature values10. Fat fraction of 3.3±1.7% and 88±3% were measured in the liver and subcutaneous fat respectively.Conclusion
Preliminary results of the proposed non-rigid motion corrected joint T1/T2 and fat fraction mapping sequence showed the feasibility of obtaining free-breathing 3D T1, T2, fat fraction and M0 maps in a clinically feasible scan time of less than 6 minutes. Non-rigid motion correction increased image sharpness and reduced T1 and T2 variability, allowing the acquisition of T1 and T2 maps in agreement with literature values. Future work will include the acquisition of a larger cohort of subjects with 3 point Dixon encoding and comparison with biopsy and standard T1, T2 and fat fraction mapping techniques for clinical validation of the proposed technique.Acknowledgements
This work was supported by the following grants: (1) EPSRC EP/P032311/1, EP/P001009/1 and EP/P007619/1, (2) BHF programme grant RG/20/1/34802, (3) King’s BHF Centre for Research Excellence RE/18/2/34213 (4) Wellcome EPSRC Centre for Medical Engineering (NS/A000049/1).References
1. Haimerl, M. et al. Assessment of clinical signs of liver cirrhosis using T1 mapping on Gd-EOB-DTPA-enhanced 3T MRI. PLoS One 8, e85658–e85658 (2013).
2. Reeder, S. B. & Sirlin, C. B. Quantification of liver fat with magnetic resonance imaging. Magn. Reson. Imaging Clin. N. Am. 18, 337–ix (2010).
3. Prieto, C. et al. Highly efficient respiratory motion compensated free-breathing coronary MRA using golden-step Cartesian acquisition. J. Magn. Reson. Imaging 41, (2015).
4. Bustin, A. et al. Five-minute whole-heart coronary MRA with sub-millimeter isotropic resolution, 100% respiratory scan efficiency, and 3D-PROST reconstruction. Magn. Reson. Med. 0, (2018).
5. Henningsson, M. et al. Whole-heart coronary MR angiography with 2D self-navigated image reconstruction. Magn. Reson. Med. 67, (2012).
6. Bustin, A. et al. 3D whole-heart isotropic sub-millimeter resolution coronary magnetic resonance angiography with non-rigid motion-compensated PROST. J. Cardiovasc. Magn. Reson. 22, 24 (2020).
7. Berglund, J., Johansson, L., Ahlström, H. & Kullberg, J. Three-point dixon method enables whole-body water and fat imaging of obese subjects. Magn. Reson. Med. 63, 1659–1668 (2010).
8. Weigel, M. Extended phase graphs: Dephasing, RF pulses, and echoes - pure and simple. J. Magn. Reson. Imaging 41, 266–295 (2015).
9. Jubert, O. et al. Multi-parametric liver tissue characterization using MR , and fat fraction mapping fingerprinting : Simultaneous T 1 , T 2 , T ∗. 2625–2635 (2020). doi:10.1002/mrm.28311
10. de Bazelaire, C. M. J., Duhamel, G. D., Rofsky, N. M. & Alsop, D. C. MR Imaging Relaxation Times of Abdominal and Pelvic Tissues Measured in Vivo at 3.0 T: Preliminary Results. Radiology 230, 652–659 (2004).
Figures