1233
Three-dimensional whole-brain simultaneous quantitative mapping of T1, T2, T2*, and susceptibility with MR Multitasking1Biomedical Imaging Research Institute, Cedars Sinai Medical Center, Los Angeles, CA, United States, 2Department of Bioengineering, University of California, Los Angeles, Los Angeles, CA, United States, 3Magnetic Resonance Innovations, Inc., Bingham Farms, MI, United States, 4Department of Radiation Oncology, Keck School of Medicine, University of Southern California, Los Angeles, CA, United States, 5Department of Radiology, University of Southern California, Los Angeles, CA, United States, 6Department of Neurology, Cedars Sinai Medical Center, Los Angeles, CA, United States, 7Department of Radiology, Wayne State University School of Medicine, Detroit, MI, United States, 8The MRI Institute for Biomedical Research, Bingham Farms, MI, United States
Synopsis
A new approach for simultaneous quantitative mapping of T1, T2, T2*, and susceptibility was developed. This technique employs hybrid T2 preparation/inversion pulse modules followed by fully flow-compensated multi-echo FLASH readouts. Our method reconstructs images with different T2 preparation times, echo times, and inversion times in the MR Multitasking framework and use them for parameter quantification. Results of both visual comparison and statistical analysis showed that our proposed method agreed well with reference methods while being more time efficient.
Introduction
MR imaging offers various image contrasts primarily weighted by proton density (PD), longitudinal relaxation time (T1) or transverse relaxation times (T2, T2*). Quantification of these parameters can reveal important information about tissue composition. For example, T1 is correlated with myelin concentration1 and axon diameter2. T1 and T2 values have been used for lesion identification in multiple sclerosis patients3. Both susceptibility and R2* are related to iron deposition in the human brain4 as a result of aging5 and neurodegenerative diseases6-8. Recently multiparametric mapping has been shown to offer better diagnostic performance9,10. However, conventional ways for multi-parametric quantification require separate scans, which are time-consuming and may suffer from inter-scan misregistration. In this work, we developed a new approach to efficient and simultaneous quantitative mapping of T1, T2, T2* and susceptibility based on MR Multitasking framework.Methods
Sequence diagramThe sequence diagram is shown in Fig. 1a. Hybrid T2 preparation/inversion pulse modules preparation times were followed by multi-echo FLASH readouts. The readout modules acquired k-space lines at different combinations of T2 preparation time ($$$\tau=0,30,55,80ms$$$), inversion time ($$$t_{TI}=0-2880ms$$$), and echo time ($$$t_{TE}=5,10,16ms$$$). Two interleaved subsets of data were acquired for the multitasking framework: imaging data and navigator data, as shown in Fig 1c. To reduce flow-induced phase error, full flow compensation along all directions and for all echoes were implemented based on previous literature11, as shown in Fig. 1b.
Imaging model
The underlying image series can be written as a 6-dimensional low rank tensor $$$x\left(\boldsymbol{r}, \tau, t_{T I}, t_{T E}\right)$$$ with three spatial dimensions indexed by $$$\boldsymbol{r}=[x, y, z]$$$, and 3 temporal dimensions $$$\tau$$$, $$$t_{TI}$$$, and $$$t_{TE}$$$. The image can be reconstructed using a low rank tensor model12 :
$$\mathrm{x}_{(1)}=\mathrm{U}_{\mathrm{r}} \Phi$$
Where subscript (1) denotes mode-1 unfolding of the tensor, $$$U_r$$$ are spatial coefficients and $$$\Phi=\mathrm{G}_{(1)} \otimes U_{\tau} \otimes U_{T I} \otimes U_{T E}$$$ is a temporal factor consisting of a core tensor $$$G_{(1)}$$$ and corresponding basis. The temporal factor $$$\Phi$$$ can be determined from Bloch-constrained low-rank tensor completion of navigator data12, after which we recover $$$U_r$$$ by solving the following optimization problem:
$$\widehat{\mathbf{U}}_{r}=\arg \min _{\mathbf{U}_{\mathbf{r}}}\left\|\mathbf{d}_{\mathrm{img}}-\Omega(\mathbf{E} \mathbf{U} \Phi)\right\|_{2}^{2}+\lambda R\left(\mathbf{U}_{\mathbf{r}}\right)$$
where $$$d_{img}$$$ are the imaging data, $$$\Omega$$$ is an undersampling operator, $$$E$$$ combines multi-channel encoding, and $$$R\left(\mathbf{U}_{\mathbf{r}}\right)$$$ is a total variation regularizer.
Parameter quantification
The voxel-wise relaxation parameters are quantified using the following signal model:
$$S=M_{z 0} \frac{1-e^{-T_{\mathrm{R}} / T_{1}}}{1-e^{-T_{\mathrm{R}} / T_{1}} \cos \alpha}\left[1+\left(B e^{-\tau / T_{2}}-1\right)\left(e^{-T_{\mathrm{R}} / T_{1}} \cos \alpha\right)^{n}\right] e^{-t_{T E} / T_{2}^{*}} e^{j \Delta B_{0} t_{T E}} \sin \alpha$$
where $$$M_{z 0}$$$ absorbs the equilibrium magnetization, $$$B$$$ represents effective inversion efficiency, $$$\Delta B_{0}$$$ describes the static field inhomogenity, $$$T_R$$$ is the FLASH readout repetition time and $$$n$$$ represents readout index. QSM (quantitative susceptibility mapping) was computed using brain-extracted multi-echo images from the last FLASH readout module by removing background field13 and solving dipole inversion problem14.
MR experiments
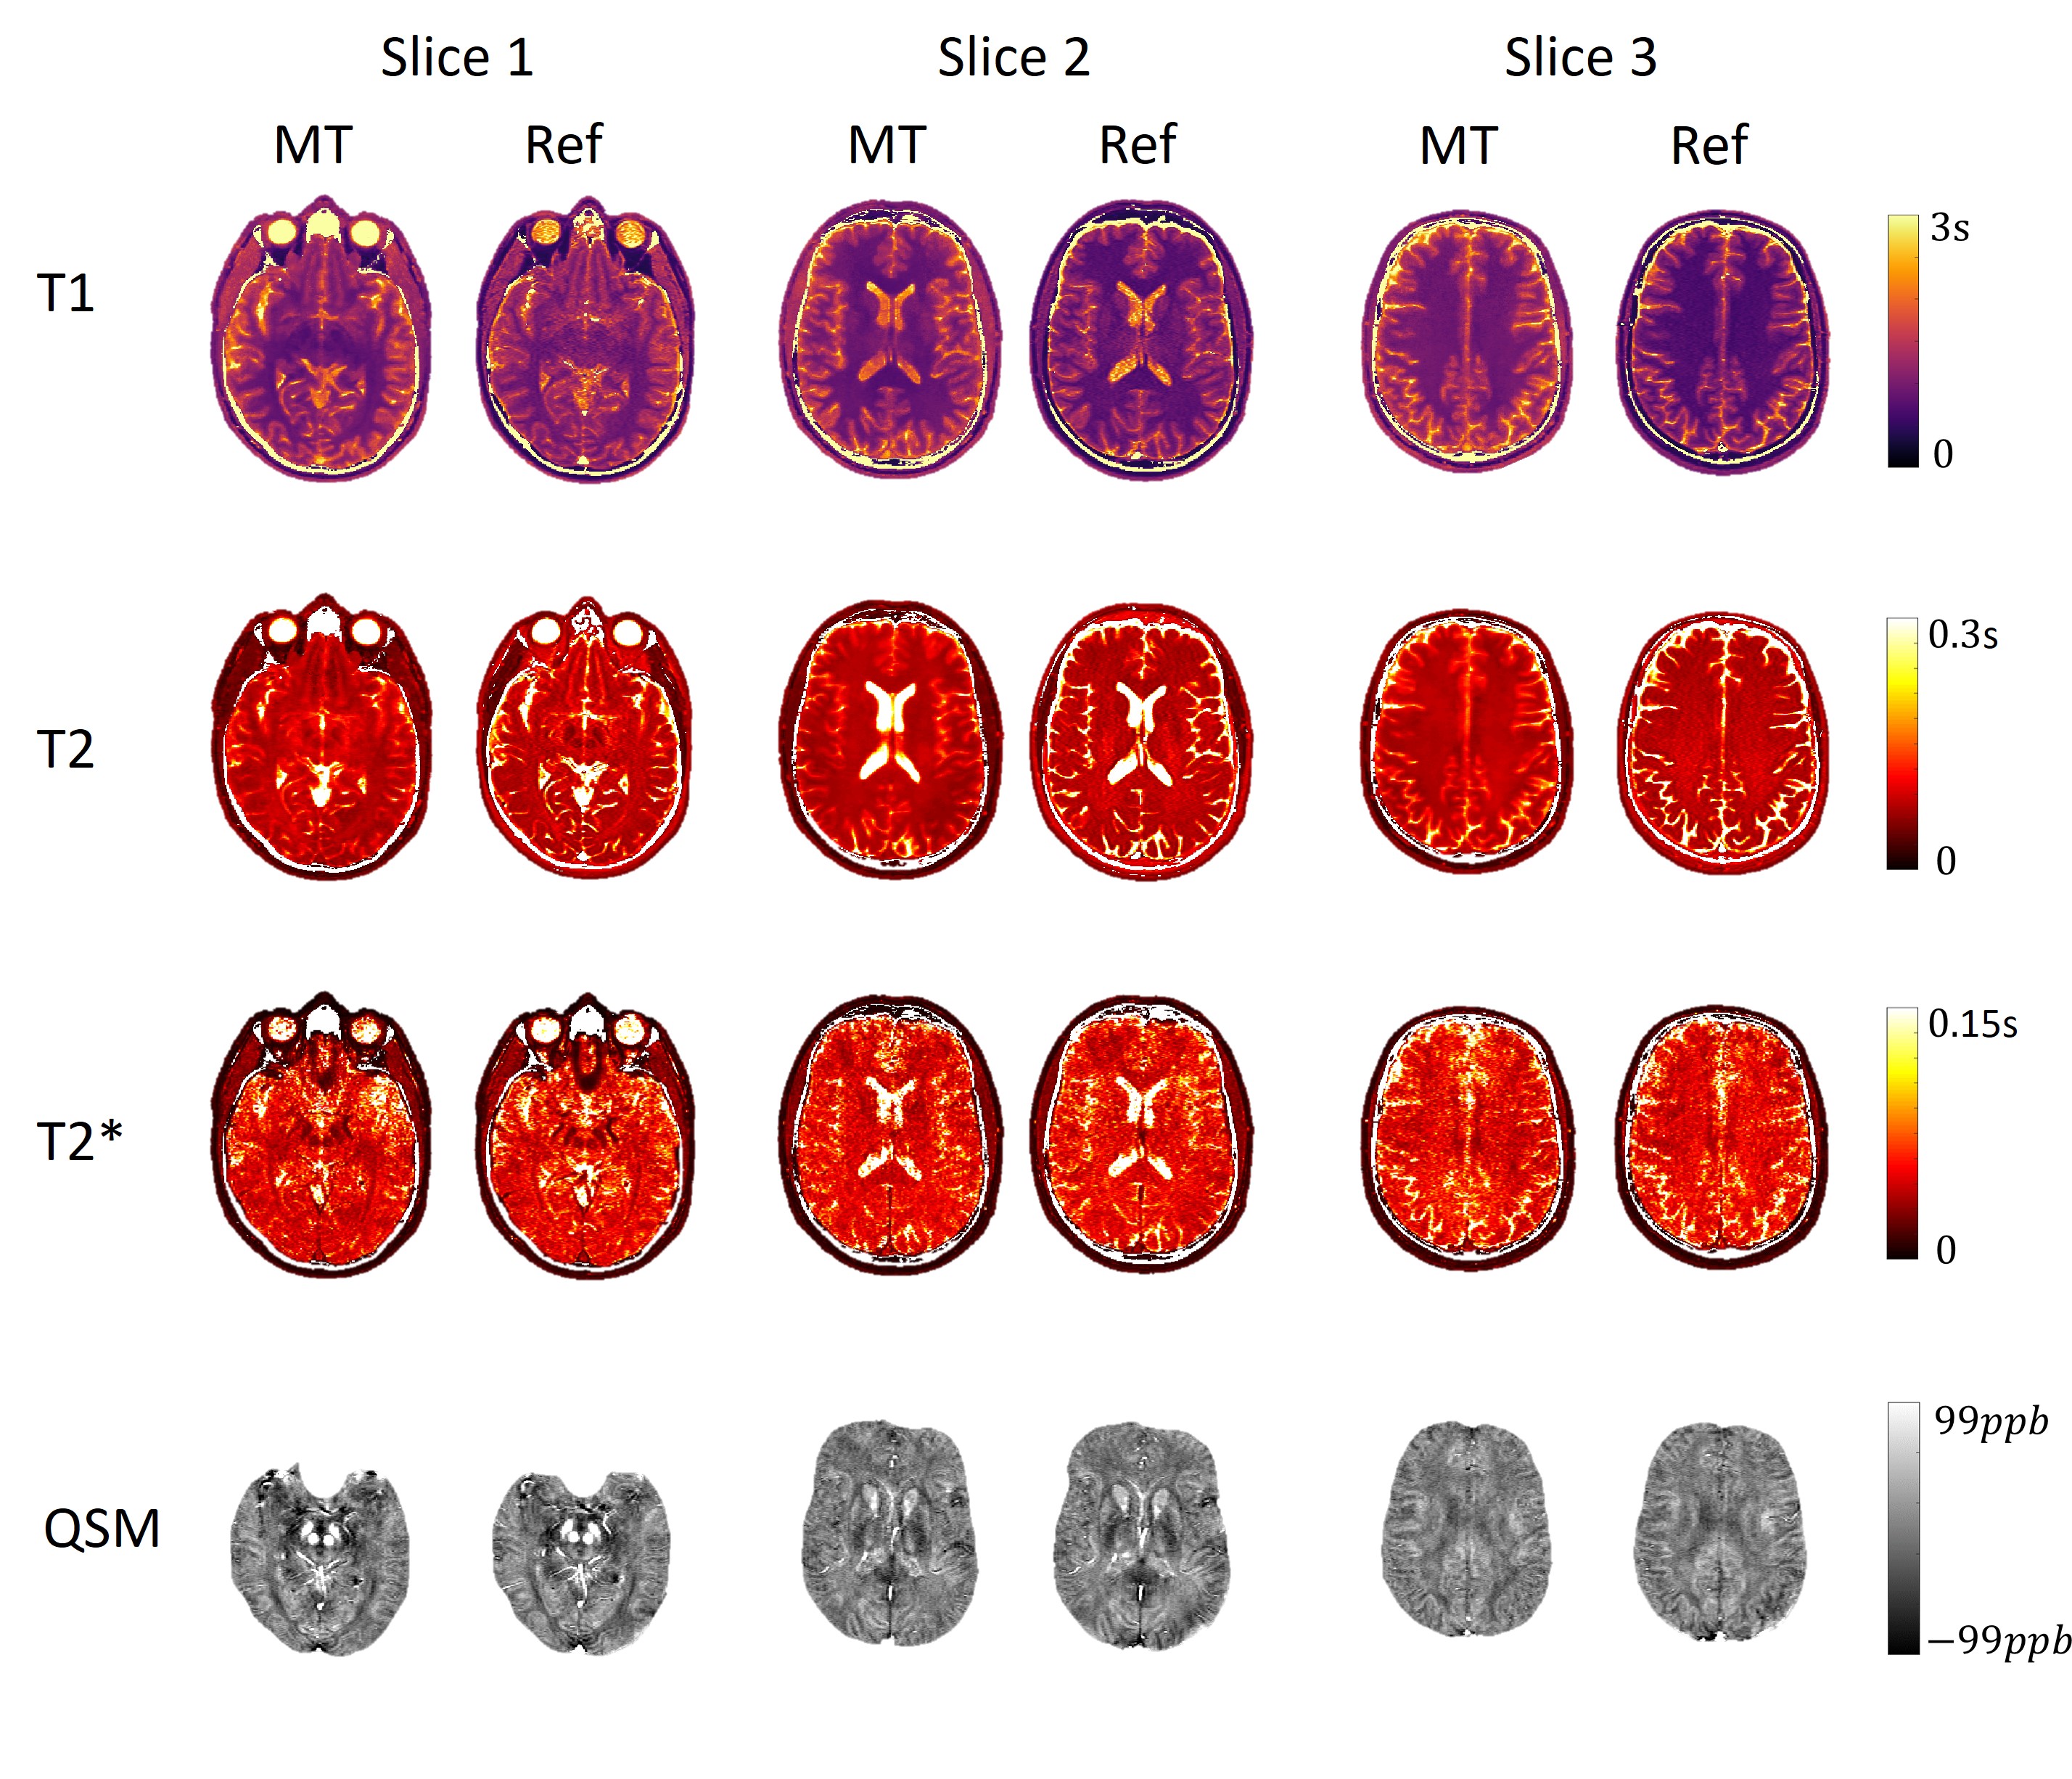
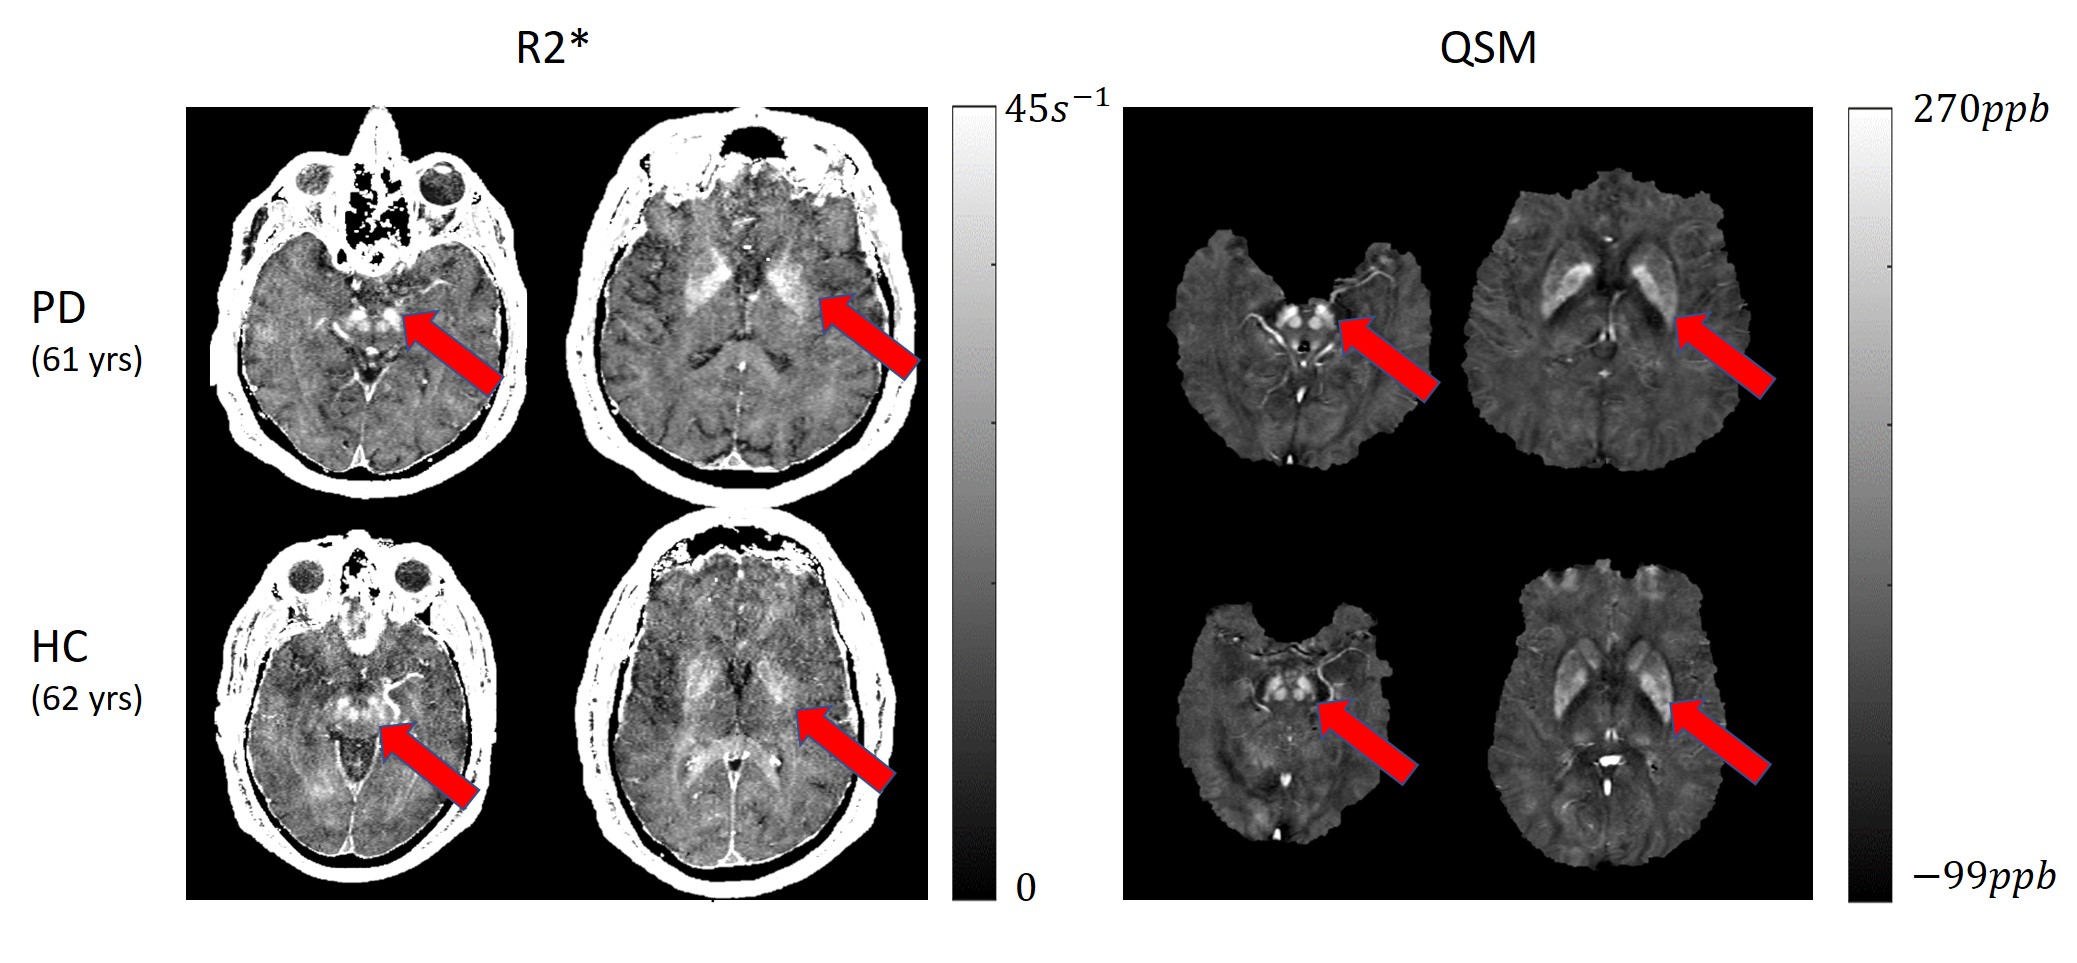
Ten healthy volunteers and one Parkinson disease (PD) patient were scanned on a 3T scanner (Biograph mMR, Siemens). The data was acquired with FOV$$$=276 \times 207 \times 144 \mathrm{~mm}^{3}$$$ and voxel size$$$=1.4 \times 0.7 \times 2.0 \mathrm{~mm}^{3}$$$. The scan time was 9.13 min for 72 slices. Reference maps were collected for comparison: T1 maps (from IR-TSE, 24 slices), T2 maps (from ME-SE, 40 slices), and T2*/QSM maps (from ME-GRE, 72 slices), which took ~20 min.
Image analysis
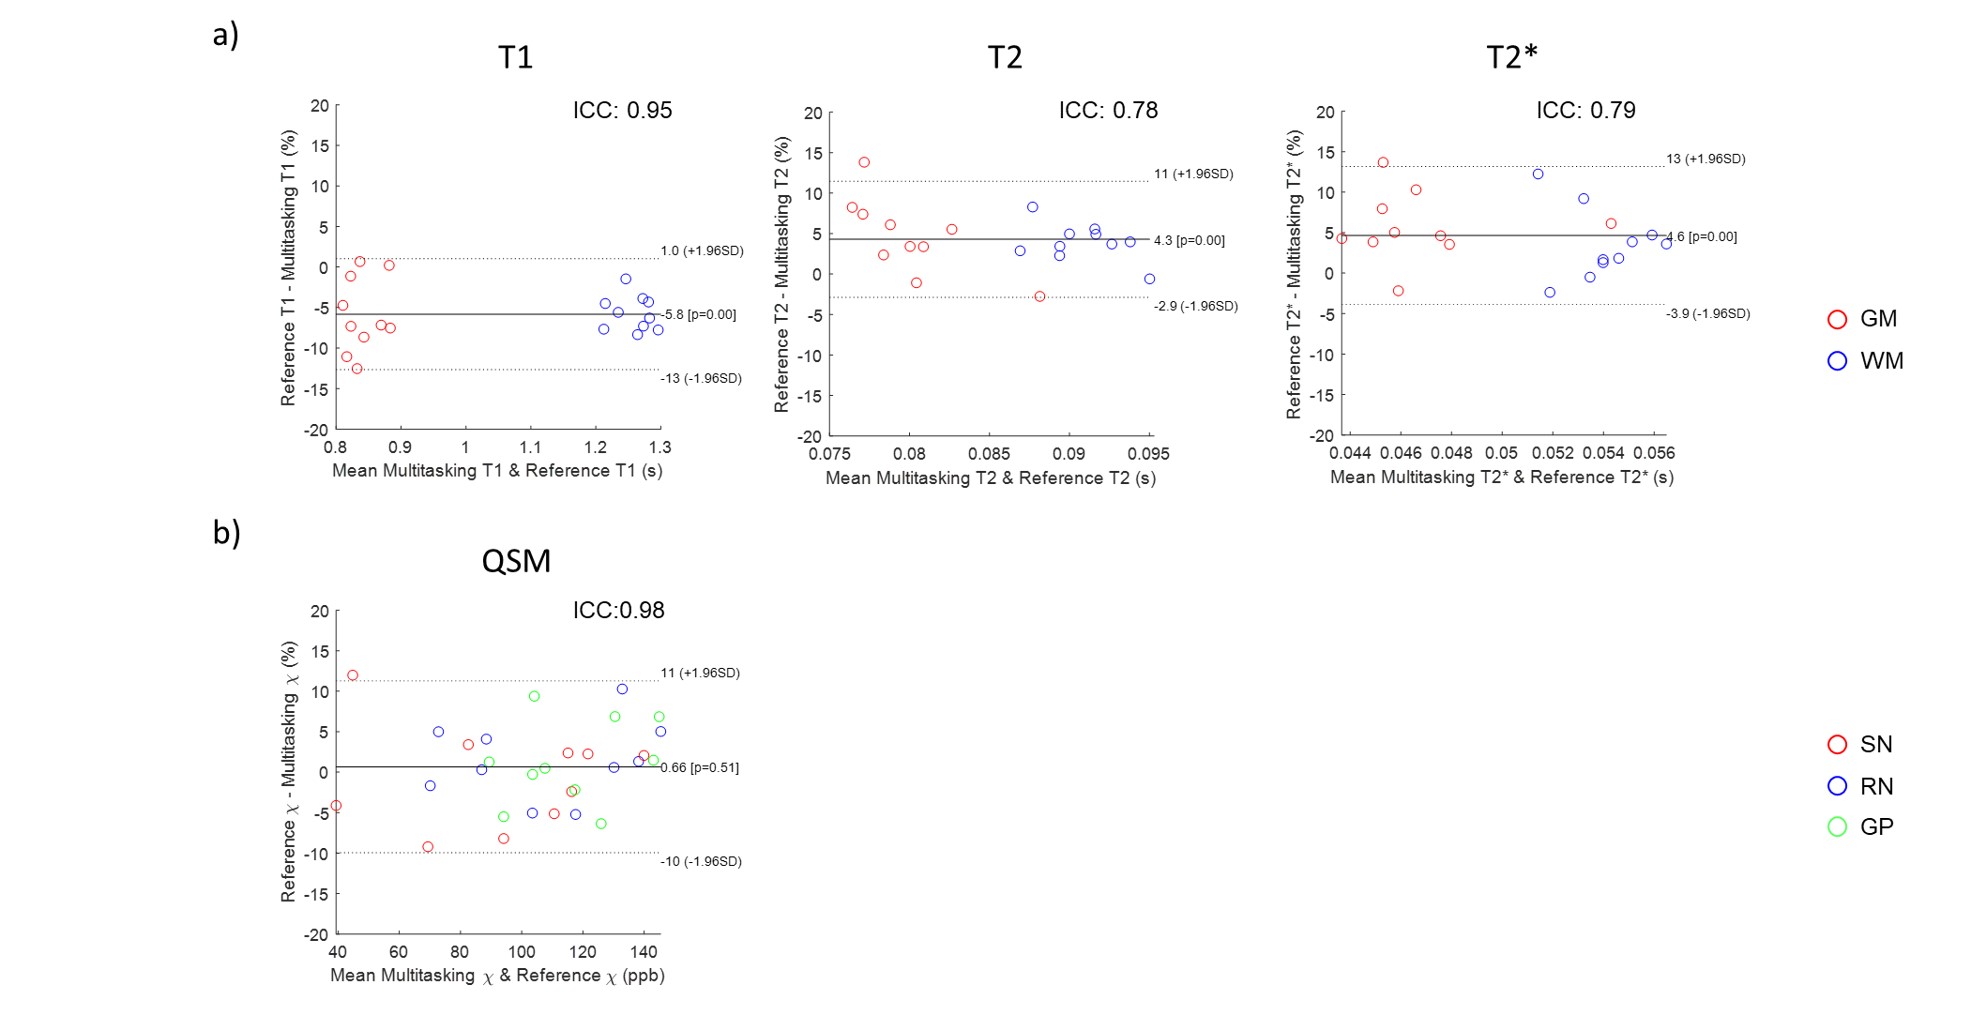
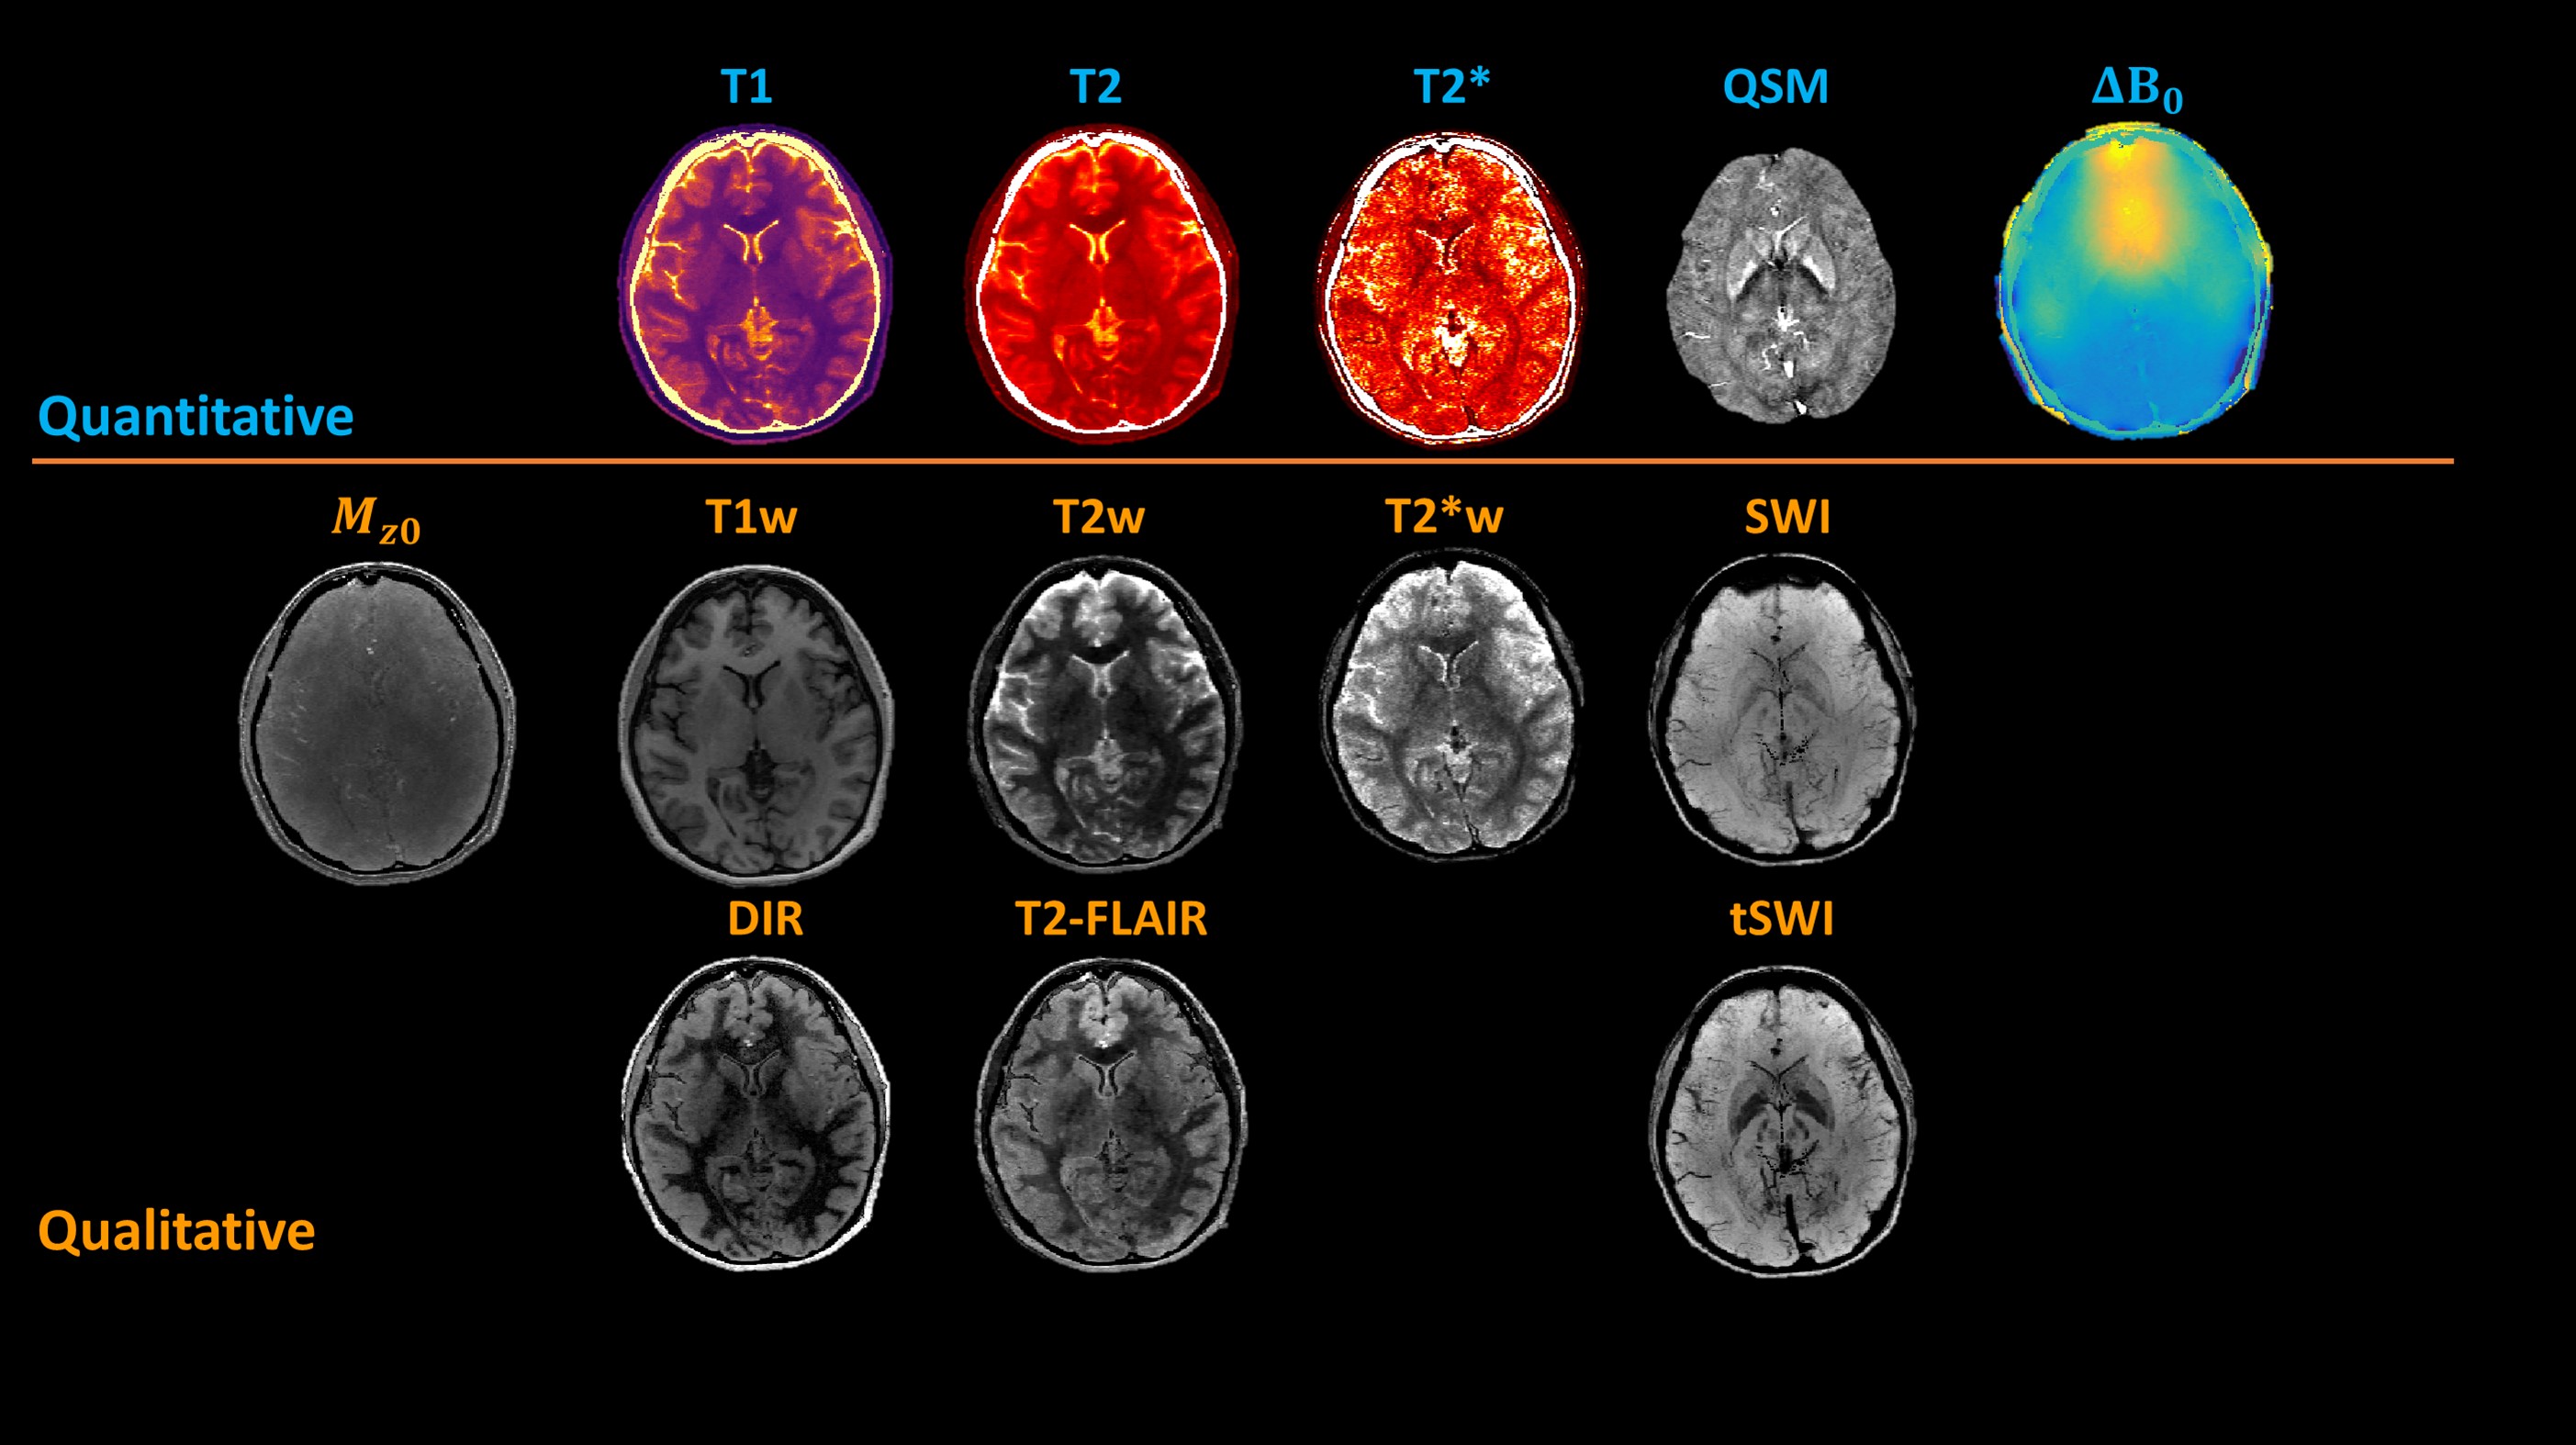
Multitasking maps were compared qualitatively and quantitatively against the reference maps. Mean T1/T2/T2* values were calculated from cortical gray matter (GM) and white matter (WM) regions and mean susceptibility values were calculated from subcortical regions including substantia nigra (SN), red nucleus (RN), and globus pallidus (GP). Bland-Altman analysis and intra-class correlation coefficient (ICC) were used for assessment. Using all parameters, different contrast-weighted images were synthesized, including T1, double inversion recovery (DIR), T2, FLAIR, T2*, and minimum intensity projections (mIPs) of SWI/true SWI (tSWI). The Multitasking R2* and QSM maps of the PD patient were compared with an age and gender-matched healthy volunteer.
Results
Of all three slices in Fig. 2, Multitasking maps showed similar tissue contrast and features to reference maps. Bland - Altman plots in Fig. 3 showed small biases between Multitasking and reference measurements for T1 (+6%, p<0.001), T2 (-4%, p=0.002), and T2* (-5%, p=0.008) with no bias for QSM measurements. Nevertheless, parameter values from Multitasking are in agreement with literature15-21 and ICCs are above 0.75, indicating excellent consistency between Multitasking and reference methods22. Contrast-weighted images synthesized from Multitasking parametric maps are shown in Fig. 4. They show high quality and good contrast. Higher paramagnetic susceptibility and R2* were found in SN and pallidum regions of the patient, as shown in Fig. 5.Discussion and Conclusion
In this work, we developed an efficient simultaneous T1, T2, T2*, and susceptibility mapping technique based on the MR Multitasking framework. The proposed method yielded consistent results with the references based on qualitative and statistical analysis and demonstrated its clinical feasibility. The proposed method was less time-consuming than the conventional techniques and wouldn’t suffer from inter-scan misregistration. Similar to previous Multitasking work25, the approach here can still compensate or remove motion throughout the scan, thus allowing more robust clinical applications. Scan time may be further reduced with Deep Learning and more clinical validations would be performed.Acknowledgements
This work was supported by the National Institutes of Health (Grant/Award No. 1R01EB028146).References
1. Stüber C, Morawski M, Schäfer A, et al. Myelin and iron concentration in the human brain: a quantitative study of MRI contrast. Neuroimage. 2014;93 Pt 1:95-106.
2. Harkins KD, Xu J, Dula AN, et al. The microstructural correlates of T1 in white matter. Magn Reson Med. 2016;75(3):1341-1345.
3. Stevenson VL, Parker GJ, Barker GJ, et al. Variations in T1 and T2 relaxation times of normal appearing white matter and lesions in multiple sclerosis. J Neurol Sci. 2000;178(2):81-87.
4. Deistung A, Schäfer A, Schweser F, et al. High-Resolution MR Imaging of the Human Brainstem In vivo at 7 Tesla. Front Hum Neurosci. 2013;7:710.
5. Hallgren B, Sourander P. The effect of age on the non-haemin iron in the human brain. J Neurochem. 1958;3(1):41-51.
6. Reichenbach JR. The future of susceptibility contrast for assessment of anatomy and function. Neuroimage. 2012;62(2):1311-1315.
7. Rouault TA. Iron metabolism in the CNS: implications for neurodegenerative diseases. Nat Rev Neurosci. 2013;14(8):551-564.
8. Zecca L, Youdim MBH, Riederer P, Connor JR, Crichton RR. Iron, brain ageing and neurodegenerative disorders. Nat Rev Neurosci. 2004;5(11):863-873.
9. Turkbey B, Mani H, Shah V, et al. Multiparametric 3T prostate magnetic resonance imaging to detect cancer: histopathological correlation using prostatectomy specimens processed in customized magnetic resonance imaging based molds. J Urol. 2011;186(5):1818-1824.
10. Ro S-R, Asbach P, Siebert E, Bertelmann E, Hamm B, Erb-Eigner K. Characterization of orbital masses by multiparametric MRI. Eur J Radiol. 2016;85(2):324-336.
11. Xu B, Liu T, Spincemaille P, Prince M, Wang Y. Flow compensated quantitative susceptibility mapping for venous oxygenation imaging: Venous Oxygenation Quantification Using QSM. Magn Reson Med. 2014;72(2):438-445.
12. Christodoulou AG, Shaw JL, Nguyen C, et al. Magnetic resonance multitasking for motion-resolved quantitative cardiovascular imaging. Nat Biomed Eng. 2018;2(4):215-226.
13. Schweser F, Deistung A, Lehr BW, Reichenbach JR. Quantitative imaging of intrinsic magnetic tissue properties using MRI signal phase: an approach to in vivo brain iron metabolism? Neuroimage. 2011;54(4):2789-2807.
14. Haacke EM, Tang J, Neelavalli J, Cheng YCN. Susceptibility mapping as a means to visualize veins and quantify oxygen saturation. J Magn Reson Imaging. 2010;32(3):663-676. 15. Wansapura JP, Holland SK, Dunn RS, Ball WS Jr. NMR relaxation times in the human brain at 3.0 tesla. J Magn Reson Imaging. 1999;9(4):531-538.
16. Stanisz GJ, Odrobina EE, Pun J, et al. T1, T2 relaxation and magnetization transfer in tissue at 3T. Magn Reson Med. 2005;54(3):507-512.
17. Weiskopf N, Suckling J, Williams G, et al. Quantitative multi-parameter mapping of R1, PD*, MT, and R2* at 3T: a multi-center validation. Front Neurosci. 2013;7. doi:10.3389/fnins.2013.00095
18. Lim IAL, Faria AV, Li X, et al. Human brain atlas for automated region of interest selection in quantitative susceptibility mapping: application to determine iron content in deep gray matter structures. Neuroimage. 2013;82:449-469.
19. Chai C, Yan S, Chu Z, et al. Quantitative measurement of brain iron deposition in patients with haemodialysis using susceptibility mapping. Metab Brain Dis. 2015;30(2):563-571.
20. He N, Ling H, Ding B, et al. Region-specific disturbed iron distribution in early idiopathic Parkinson’s disease measured by quantitative susceptibility mapping: Magnetic Susceptibility Analysis in Early PD. Hum Brain Mapp. 2015;36(11):4407-4420.
21. Barbosa JHO, Santos AC, Tumas V, et al. Quantifying brain iron deposition in patients with Parkinson’s disease using quantitative susceptibility mapping, R2 and R2. Magn Reson Imaging. 2015;33(5):559-565.
22. Cicchetti DV. Guidelines, criteria, and rules of thumb for evaluating normed and standardized assessment instruments in psychology. Psychol Assess. 1994;6(4):284-290.
23. Liu S, Mok K, Neelavalli J, et al. Improved MR venography using quantitative susceptibility-weighted imaging: True Susceptibility-Weighted Imaging. J Magn Reson Imaging. 2014;40(3):698-708.
24. Murakami Y, Kakeda S, Watanabe K, et al. Usefulness of quantitative susceptibility mapping for the diagnosis of Parkinson disease. AJNR Am J Neuroradiol. 2015;36(6):1102-1108.
25. Ma S, Nguyen CT, Han F, et al. Three-dimensional simultaneous brain T1 , T2 , and ADC mapping with MR Multitasking. Magn Reson Med. 2020;84(1):72-88.
Figures
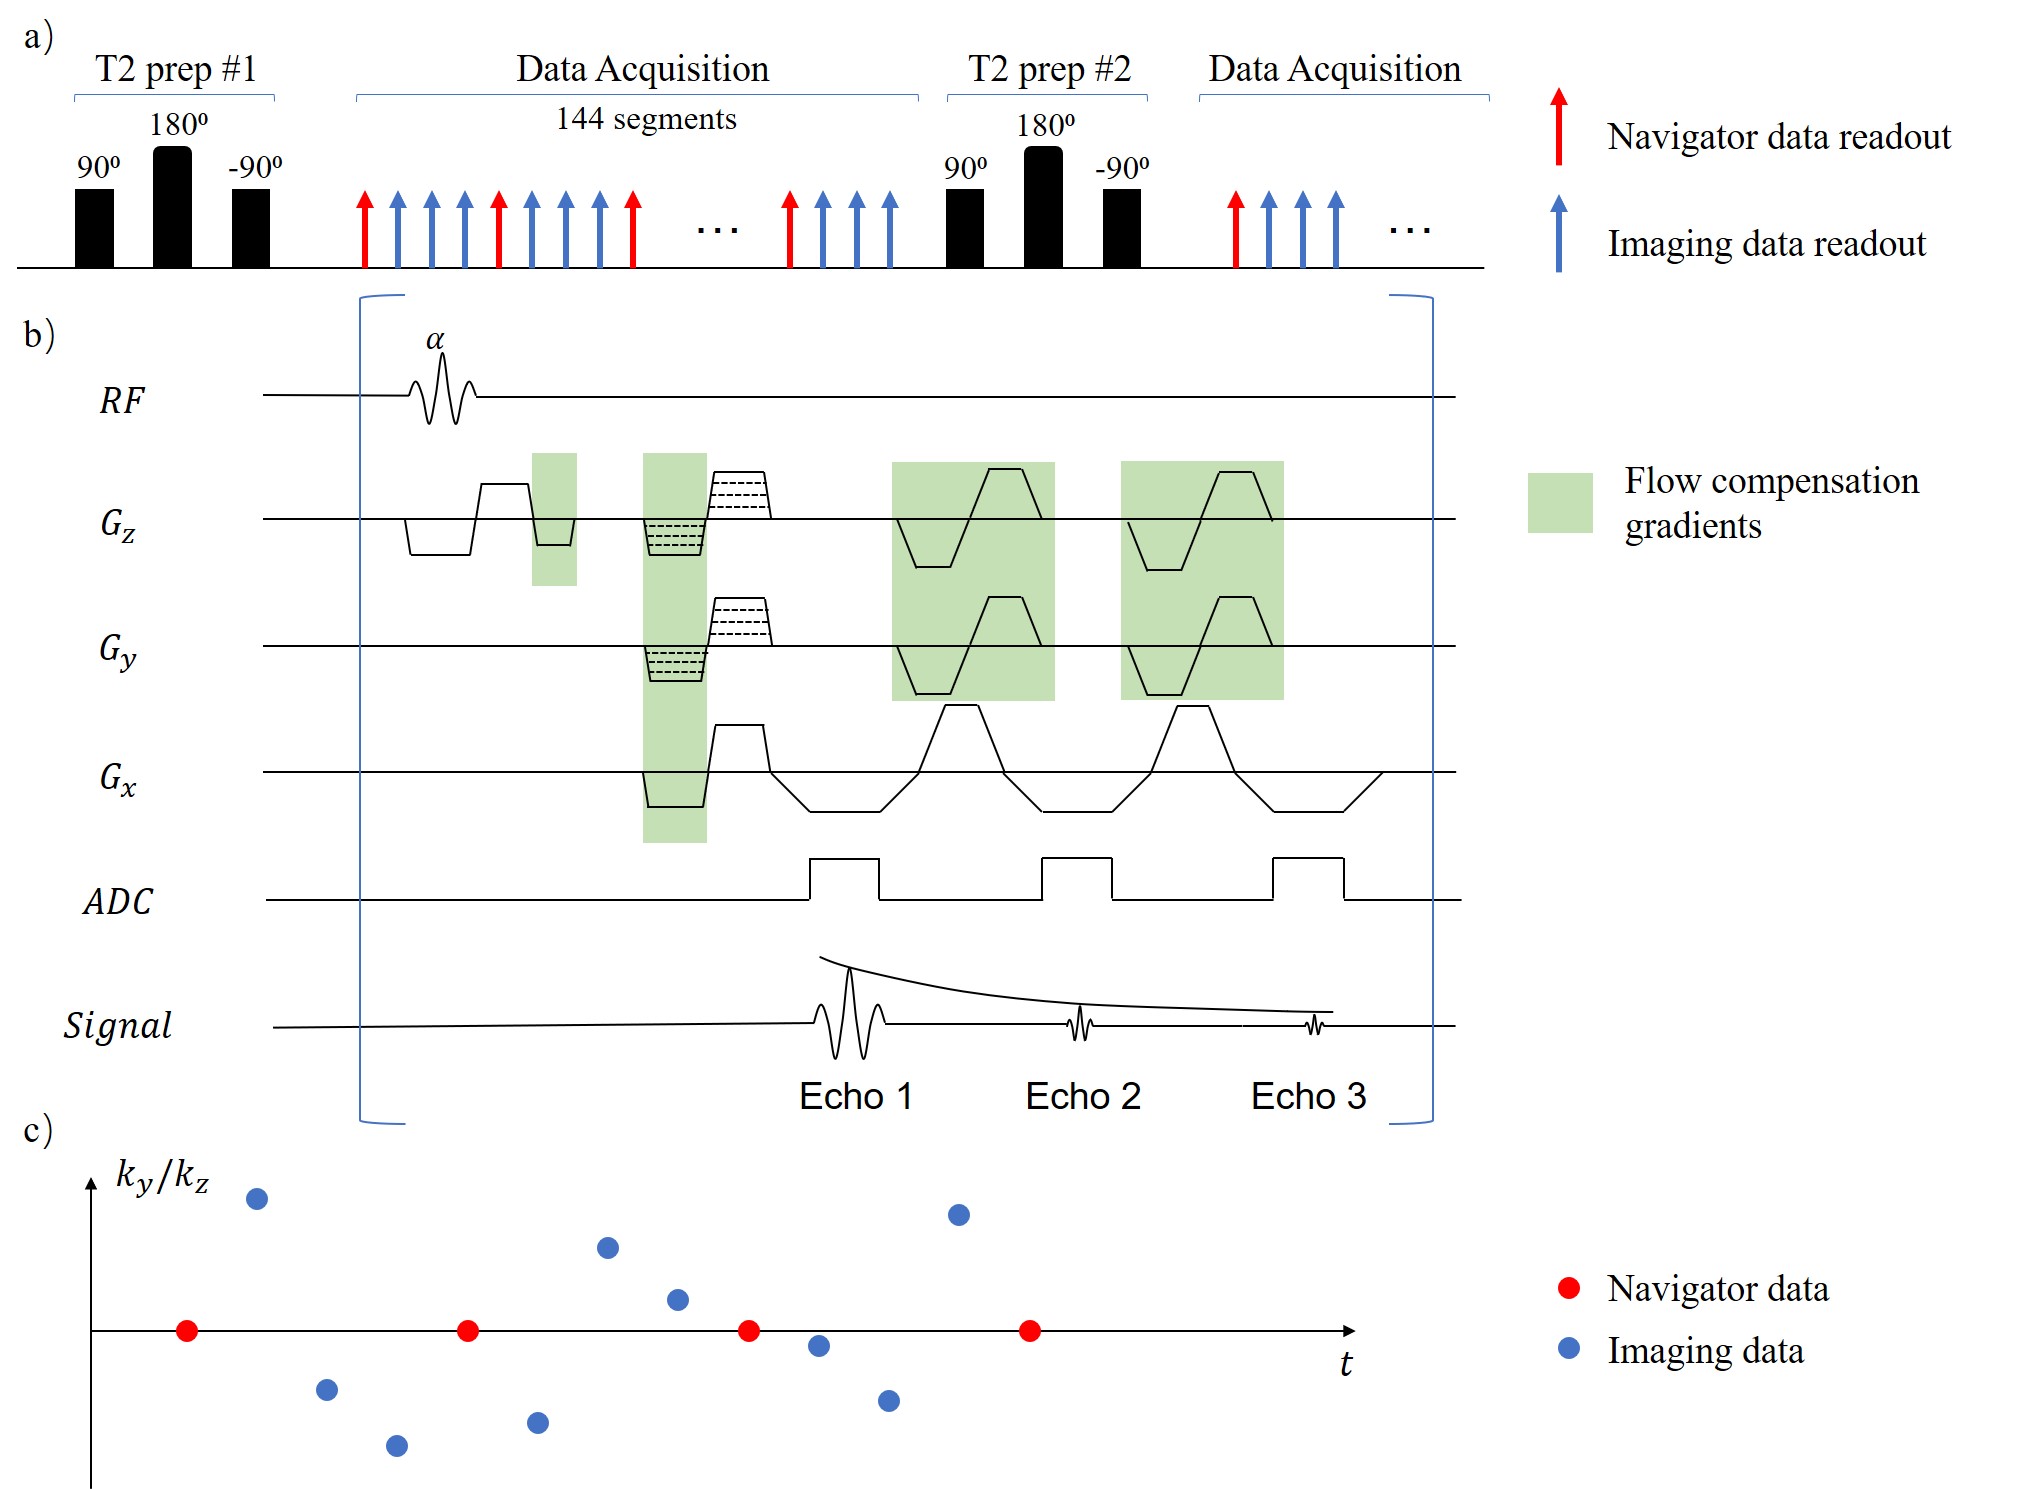
Figure 1. a) Sequence diagram. Hybrid IR/T2IR preparations were followed by multi-echo FLASH readouts. The navigator data was acquired every 4 readouts.
b) Illustration of the readout module. After each 𝛼 pulse, a total of 3 echoes, each of them fully flow compensated along all directions, were collected in a monopolar way. In the phase/partition encoding direction, bipolar gradient pairs are added for later echoes.
c) Simplified illustration of k-space sampling pattern. Cartesian acquisition with random Gaussian distribution was used along $$$k_y$$$ and $$$k_z$$$ directions.