1232
Quantitative myelin-sensitive MRIs exhibit differential sensitivity to multiple sclerosis pathology in distinct brain lesions and regions1Neurologic Clinic and Policlinic, Departments of Medicine, Clinical Research and Biomedical Engineering, University Hospital Basel and University of Basel, Basel, Switzerland, 2Translational Imaging in Neurology (ThINk) Basel, Department of Biomedical Engineering, University Hospital Basel and University of Basel, Basel, Switzerland, 3Research Center for Clinical Neuroimmunology and Neuroscience (RC2NB) Basel, University Hospital Basel and University of Basel, Basel, Switzerland, 4Hoffmann-La Roche Ltd., Basel, Switzerland, 5Department of Radiology, Weill Cornell Medical College, New York, NY, United States, 6Signal Processing Laboratory (LTS5), Ecole Polytechnique Fédérale de Lausanne (EPFL), Laussane, Switzerland, 7Radiology Department, Center for Biomedical Imaging (CIBM), Lausanne University and University Hospital, Laussane, Switzerland, 8Translational Neuroradiology Section, National Institute of Neurological Disorders and Stroke, NIH, 10 Center Drive MSC 1400, Building 10 Room 5C103, Bethesda, MD, United States, 9Department of Neurology, Cedars-Sinai Medical Center, Los Angeles, CA, United States, 10Pharmaceutical Research and Early Development, Roche Innovation Center Basel, F. Hoffmann-La Roche Ltd., Basel, Switzerland
Synopsis
The differential sensitivity of myelin-sensitive advanced MRIs (aMRIs) to the pathology in various brain lesions and regions in multiple sclerosis (MS) is currently debated. This study aimed to address this issue using myelin water fraction maps (MWF), quantitative susceptibility mapping (QSM) and T1 relaxometry (qT1). Our results show that (i) qT1 is the most sensitive in differentiating white matter and cortical MS lesions from normal-appearing tissue (ii) QSM is best differentiating lesions with various extent of damage (lesions with vs without paramagnetic rim & periventricular vs juxta-cortical lesions) and (iii) MWF outperforms the other aMRI methods in identifying occult normal appearing pathology.
INTRODUCTION
Myelin alteration takes place in various neurological conditions, especially in multiple sclerosis(MS). The relative sensitivity of advanced magnetic resonance imaging(aMRI) to myelin damage in MS is not yet clear.Myelin water imaging (MWI) quantifies the water between myelin layers by distinguishing multiple water components in multi-compartment T2 relaxometry data (Granziera et al., 2020; Laule et al., 2006; Nguyen et al., 2016), which have been validated postmortem (Moore et al., 2000). Quantitative susceptibility mapping(QSM) quantifies the magnetic susceptibility (Liu et al., 2012) and is sensitive to iron and myelin content (Granziera et al., 2020). Quantitative T1 mapping(qT1) quantifies T1 relaxation times(T1-RT) that are sensitive to the tissue macro and micro-molecular components including myelin (MacKay et al., 2009).
Neuropathological studies showed different levels of myelin damage in MS at specific brain locations. The peri-plaque(PP) tissue surrounding MS lesions shows less myelin damage than the lesion itself (Lieury et al., 2014). Furthermore, peri-ventricular(PV) lesions exhibit more myelin damage compared with juxta-cortical(JC) lesions (Patrikios et al., 2006) and lesions featuring a paramagnetic iron rim(PRL) exhibit more myelin reduction than lesions without rim(Other Lesions) (Dal-Bianco et al., 2017). In this work, we studied a large cohort of MS patients and healthy controls (HC) and compared the relative sensitivity of MWI, qT1 and QSM: (1)to differentiate MS lesions from the surrounding normal appearing(NA) tissue (2)to differentiate lesions with higher extent of damage from the ones with lower damaged(PV vs JC and PRL vs other lesions) and (3)to quantify diffuse NA pathology.
METHODS
Ninety-one MS patients (62 RRMS and 29 PMS) and 72 HC underwent aMRI in a 3T whole-body MR system (Prisma, Siemens Healthcare, Germany) using a 64-channel head coil. The MRI protocol included: (i) 3D FLAIR (TR/TE/TI/resolution=5000/386/1800 ms, 1 mm3), MP2RAGE for qT1 (TR/TI1/ TI2/resolution=5000/700/2500 ms, 1 mm3); (ii) MWI (spiral TR/TE/resolution = 7.5/0.5 ms/1.25x1.25x5 mm3) for MWF (Nguyen et al., 2016) ; (iii) 3D-EPI for QSM (TR/TE/resolution=64 ms/35 ms/0.67x0.67x0.67 mm3)(Liu et al., 2012; Sati et al., 2014). Lesions were automatically segmented (La Rosa et al., 2020) and manually corrected. NA and two-voxel PP layer masks were then automatically extracted. PRL were identified on QSM maps. PV and JC lesions were defined as WM lesions located within 3mm from the boundary between WM and grey matter (GM) and WM and ventricles, respectively. Further, we performed logistic regression on 300’000 voxels, equally divided in WMLs and surrounding PP-WM voxels, to estimate the sensitivity, specificity and area under the curve (AUC) of aMRIs in differentiating voxels in WMLs vs PP-WM. A voxel-wise comparison of aMRIs maps was performed using Threshold-Free Cluster Enhancement (TFCE) clustering (Jenkinson et al., 2012)(P<0.01). Using a volume-to-surface mapping algorithm and resampling of NAGM into inflated cortex, we performed a vertex-wise linear model analysis (P<0.01). Statistical analysis was performed by using Mann-Whitney test and Kruskal-Wallis test for two-group and multiple comparisons (p<0.05 was considered as significant).RESULTS
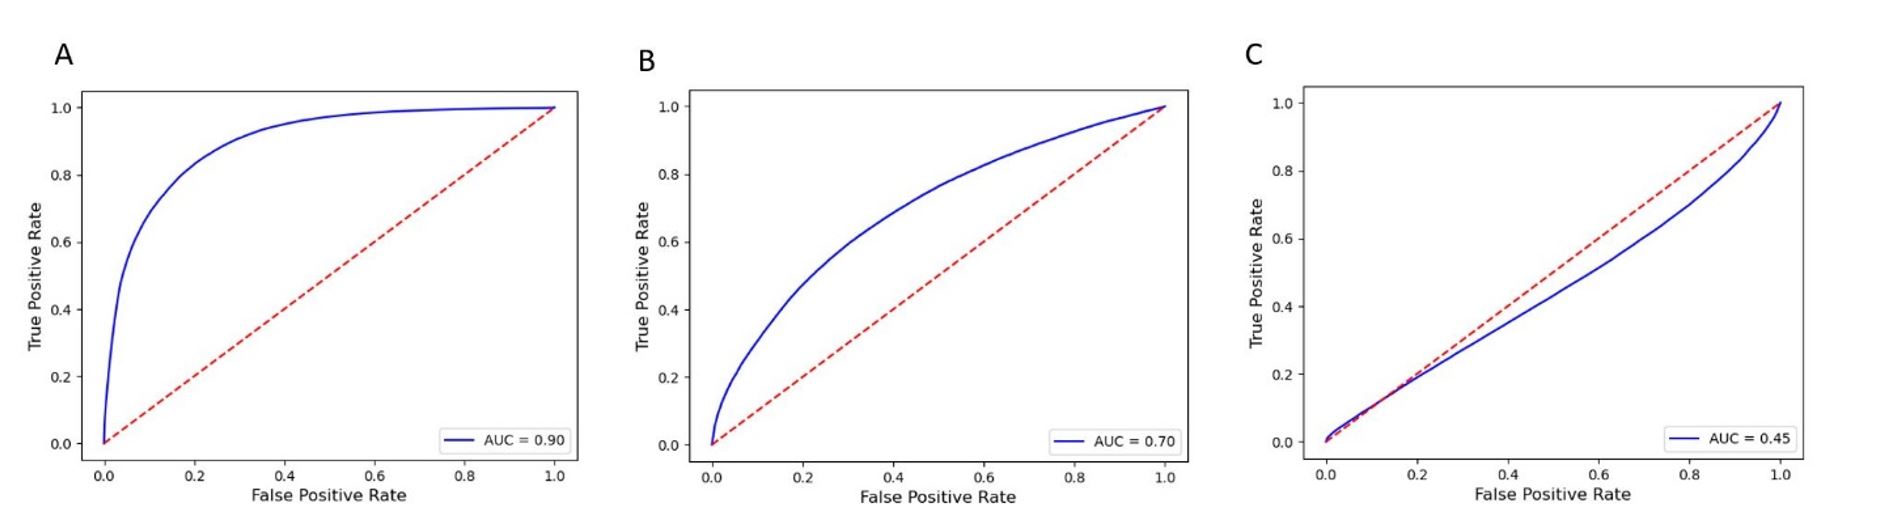
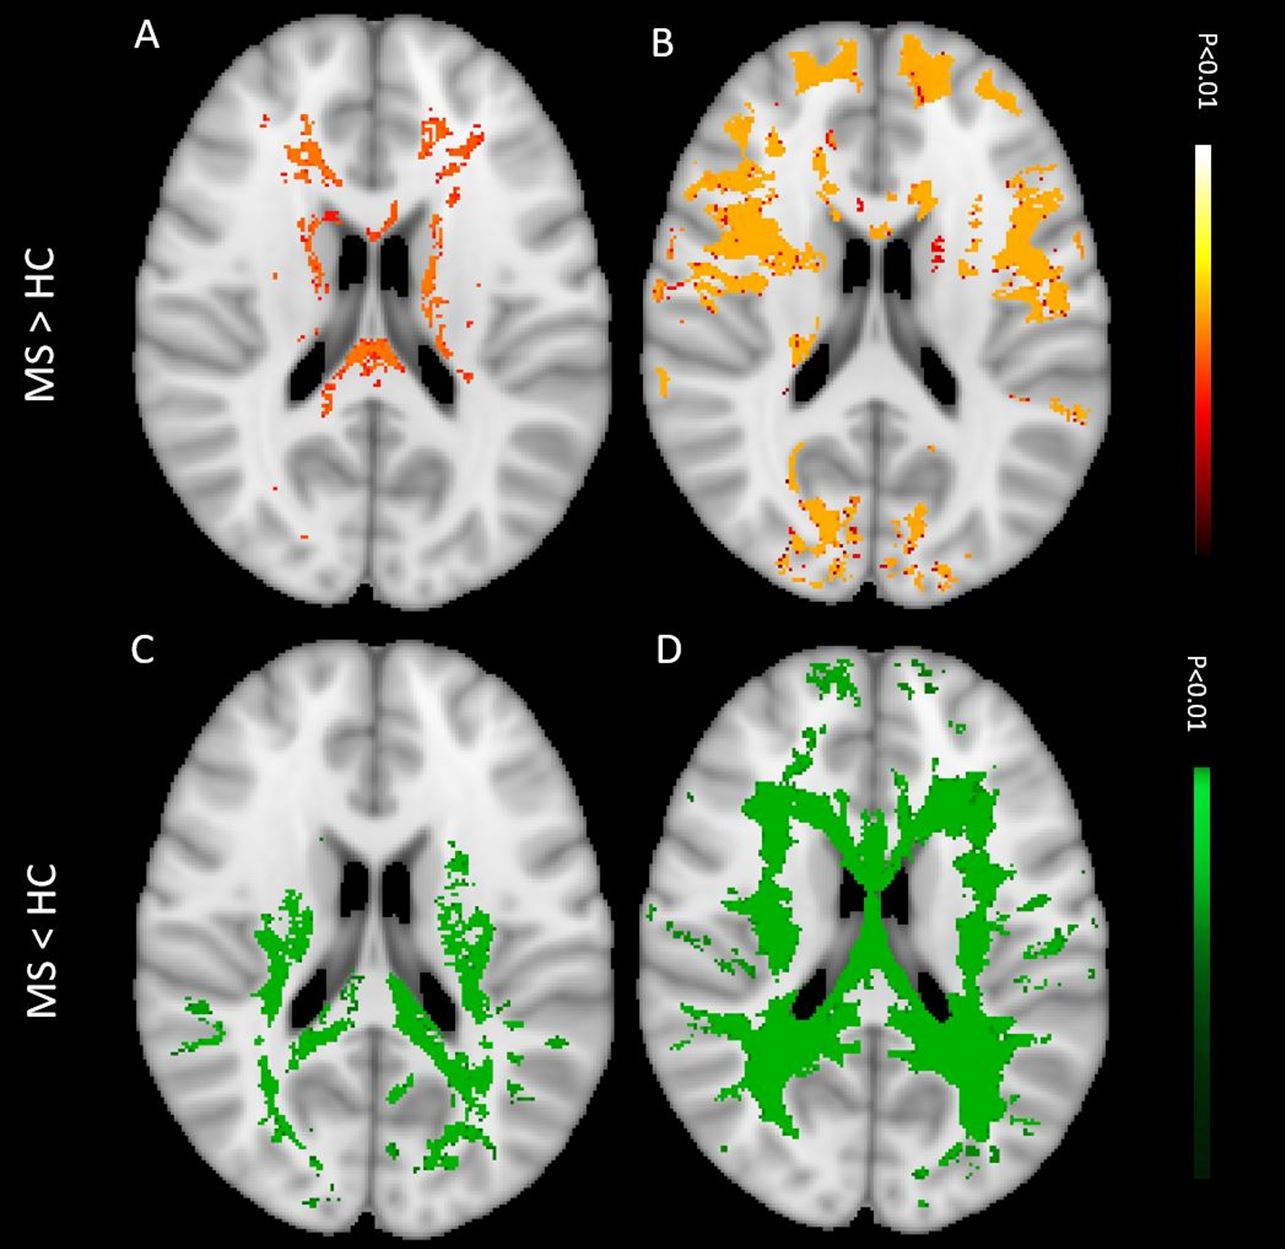
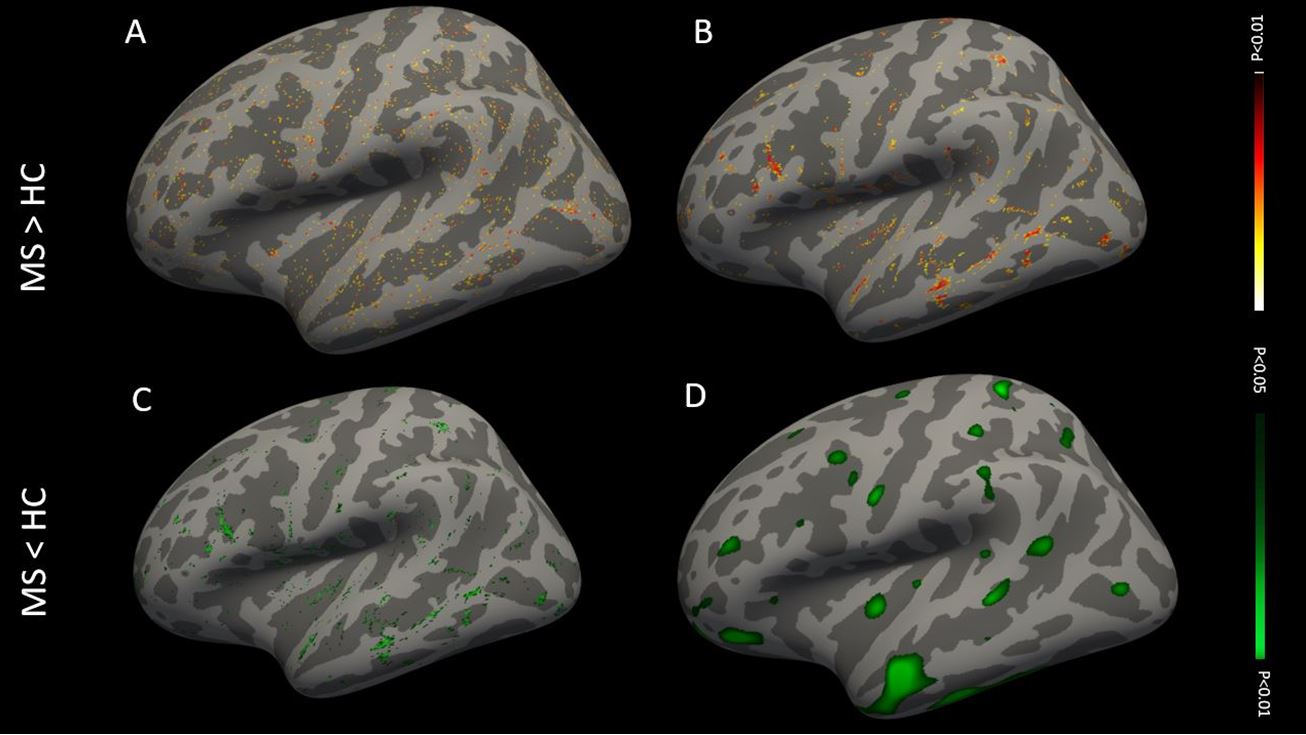
We analyzed 2091 MS WMLs (mean/patient ± SD= 54 ± 42). The logistic regression analysis for “WMLs vs PP-WM” showed that qT1 had the highest AUC: 0.90 (sensitivity: 0.75, specificity: 0.86), followed by MWF (AUC: 0.70, sensitivity: 0.61, specificity: 0.68) and QSM (AUC: 0.45, sensitivity: 0.65, specificity: 0.24) (Figure 1). qT1 was the most sensitive in differentiating WML vs PP-WM and CL vs PP-GM (Mean Delta WMLs/PPWM: qT1: 0.38, QSM: 0.33, MWF: 0.09; all P<0.0001; mean Delta CLs/PPGM: qT1: 0.20, MWF: -0.30, QSM: 0.01; all P<0.0001). QSM best differentiated PV vs JC lesions, followed by qT1 and MWF (Mean Delta PV/JC: QSM: 1.88, qT1: 0.18, MWF: -0.02; all P<0.0001). Likewise, QSM best differentiated PRL vs Other lesions, followed by MWF and qT1 (Mean Delta PRL/Other lesions: QSM: 3.22, MWF: 0.15, qT1: 0.04; all P<0.0001). The voxel-wise TFCE analysis showed alteration in MWF, QSM and qT1 in 56.84%, 49.11% and 6.67% NAWM voxels in MS patients compared to WM of controls (p<0.01, Figure 2). The vertex-wise surface-based analysis showed alterations in large clusters in MWF and scattered clusters in QSM and qT1 in NAGM voxels compared to GM in controls (p<0.01, Figure 3).DISCUSSION
Our findings show that there is a differential sensitivity of qT1, MWF and QSM to MS pathology according to the brain region: T1 was most sensitive in differentiating WMLs/CLs from PP tissue, QSM in differentiating PRL vs other lesions and PV vs JC lesions and MWF in quantifying the occult pathology in NA. These findings may partly be explained by the fact that qT1 and QSM are known to be sensitive to other phenomena beside demyelination (e.g. axonal damage, tissue destruction and iron deposition), which often occur late in the course of lesion formation. Accordingly, the iron accumulation at the edge of PRL may contribute to the QSM ability to differentiate PRL vs other lesions (Dal-Bianco et al., 2017; Absinta et al., 2018). MWF appeared to be most sensitive to subtle alterations in the NA, as reported in previous neuropathology works (Kutzelnigg et al., 2005; Cui et al., 2017; Lassmann, 2018; Rahmanzadeh et al., 2018).CONCLUSION
We provide new knowledge about the differential sensitivity of three different myelin-sensitive aMRI techniques to MS pathology in MS patients. Further work will aim at integrating Magnetization Transfer MRI in this comparative analysis.Acknowledgements
We thank all the patients and healthy subjects for taking part in this study and Marguerite Limberg for her work in enrolling patients into the study.References
Absinta M, Sati P, Fechner A, Schindler MK, Nair G, Reich DS. Identification of Chronic Active Multiple Sclerosis Lesions on 3T MRI. AJNR Am J Neuroradiol 2018; 39(7): 1233-8.
Cui QL, Khan D, Rone M, V TSR, Johnson RM, Lin YH, et al. Sublethal oligodendrocyte injury: A reversible condition in multiple sclerosis? Ann Neurol 2017; 81(6): 811-24.
Dal-Bianco A, Grabner G, Kronnerwetter C, Weber M, Hoftberger R, Berger T, et al. Slow expansion of multiple sclerosis iron rim lesions: pathology and 7 T magnetic resonance imaging. Acta Neuropathol 2017; 133(1): 25-42.
Jenkinson M, Beckmann CF, Behrens TE, Woolrich MW, Smith SM. Fsl. Neuroimage 2012; 62(2): 782-90. Kutzelnigg A, Lucchinetti CF, Stadelmann C, Bruck W, Rauschka H, Bergmann M, et al. Cortical demyelination and diffuse white matter injury in multiple sclerosis. Brain 2005; 128(Pt 11): 2705-12.
La Rosa F, Abdulkadir A, Fartaria MJ, Rahmanzadeh R, Lu PJ, Galbusera R, et al. Multiple sclerosis cortical and WM lesion segmentation at 3T MRI: a deep learning method based on FLAIR and MP2RAGE. Neuroimage Clin 2020; 27: 102335.
Lassmann H. Pathogenic Mechanisms Associated With Different Clinical Courses of Multiple Sclerosis. Front Immunol 2018; 9: 3116.
Laule C, Leung E, Lis DK, Traboulsee AL, Paty DW, MacKay AL, et al. Myelin water imaging in multiple sclerosis: quantitative correlations with histopathology. Mult Scler 2006; 12(6): 747-53.
Lieury A, Chanal M, Androdias G, Reynolds R, Cavagna S, Giraudon P, et al. Tissue remodeling in periplaque regions of multiple sclerosis spinal cord lesions. Glia 2014; 62(10): 1645-58.
Liu T, Xu W, Spincemaille P, Avestimehr AS, Wang Y. Accuracy of the morphology enabled dipole inversion (MEDI) algorithm for quantitative susceptibility mapping in MRI. IEEE Trans Med Imaging 2012; 31(3): 816-24.
MacKay AL, Vavasour IM, Rauscher A, Kolind SH, Madler B, Moore GR, et al. MR relaxation in multiple sclerosis. Neuroimaging Clin N Am 2009; 19(1): 1-26.
Moore GR, Leung E, MacKay AL, Vavasour IM, Whittall KP, Cover KS, et al. A pathology-MRI study of the short-T2 component in formalin-fixed multiple sclerosis brain. Neurology 2000; 55(10): 1506-10.
Nguyen TD, Deh K, Monohan E, Pandya S, Spincemaille P, Raj A, et al. Feasibility and reproducibility of whole brain myelin water mapping in 4 minutes using fast acquisition with spiral trajectory and adiabatic T2prep (FAST-T2) at 3T. Magn Reson Med 2016; 76(2): 456-65.
Patrikios P, Stadelmann C, Kutzelnigg A, Rauschka H, Schmidbauer M, Laursen H, et al. Remyelination is extensive in a subset of multiple sclerosis patients. Brain 2006; 129(Pt 12): 3165-72.
Rahmanzadeh R, Sahraian MA, Rahmanzade R, Rodriguez M. Demyelination with preferential MAG loss: A complex message from MS paraffin blocks. J Neurol Sci 2018; 385: 126-30.
Sati P, Thomasson DM, Li N, Pham DL, Biassou NM, Reich DS, et al. Rapid, high-resolution, whole-brain, susceptibility-based MRI of multiple sclerosis. Mult Scler 2014; 20(11): 1464-70.
Figures