1230
Correlating patterns in tumor cytoarchitecture with multiparametric MR signal in preclinical models of sarcoma1Radiology, Duke University, Durham, NC, United States, 2Radiation Oncology, Duke University, Durham, NC, United States, 3Pathology, Duke University, Durham, NC, United States
Synopsis
Identification of MR imaging biomarkers for solid tumors requires a reliable means of correlating multiparametric MR and pathological data. We have constructed a platform for registration of multi-scale preclinical imaging libraries that utilizes MR histology and cytometric feature mapping for correlative studies. With this platform we have identified a selection of cytometric features in murine sarcomas which demonstrate correlative trends with ex vivo and in vivo MR, including ADC and T2*.
Background
Although MR is routinely used in the clinic, oncologists rely on pathological analyses as a gold standard when planning care. A histology-based interpretation of MR could provide radiologists with a more complete understanding of tumors, particularly in instances where tissue biopsy is limited spatially or temporally. Understanding the relationship between tissue histology and MR requires robust registration of MR and pathological data. However, registration faces multiple challenges, including discrepancies in dimensionality, resolution, and signal source1,2.Methods
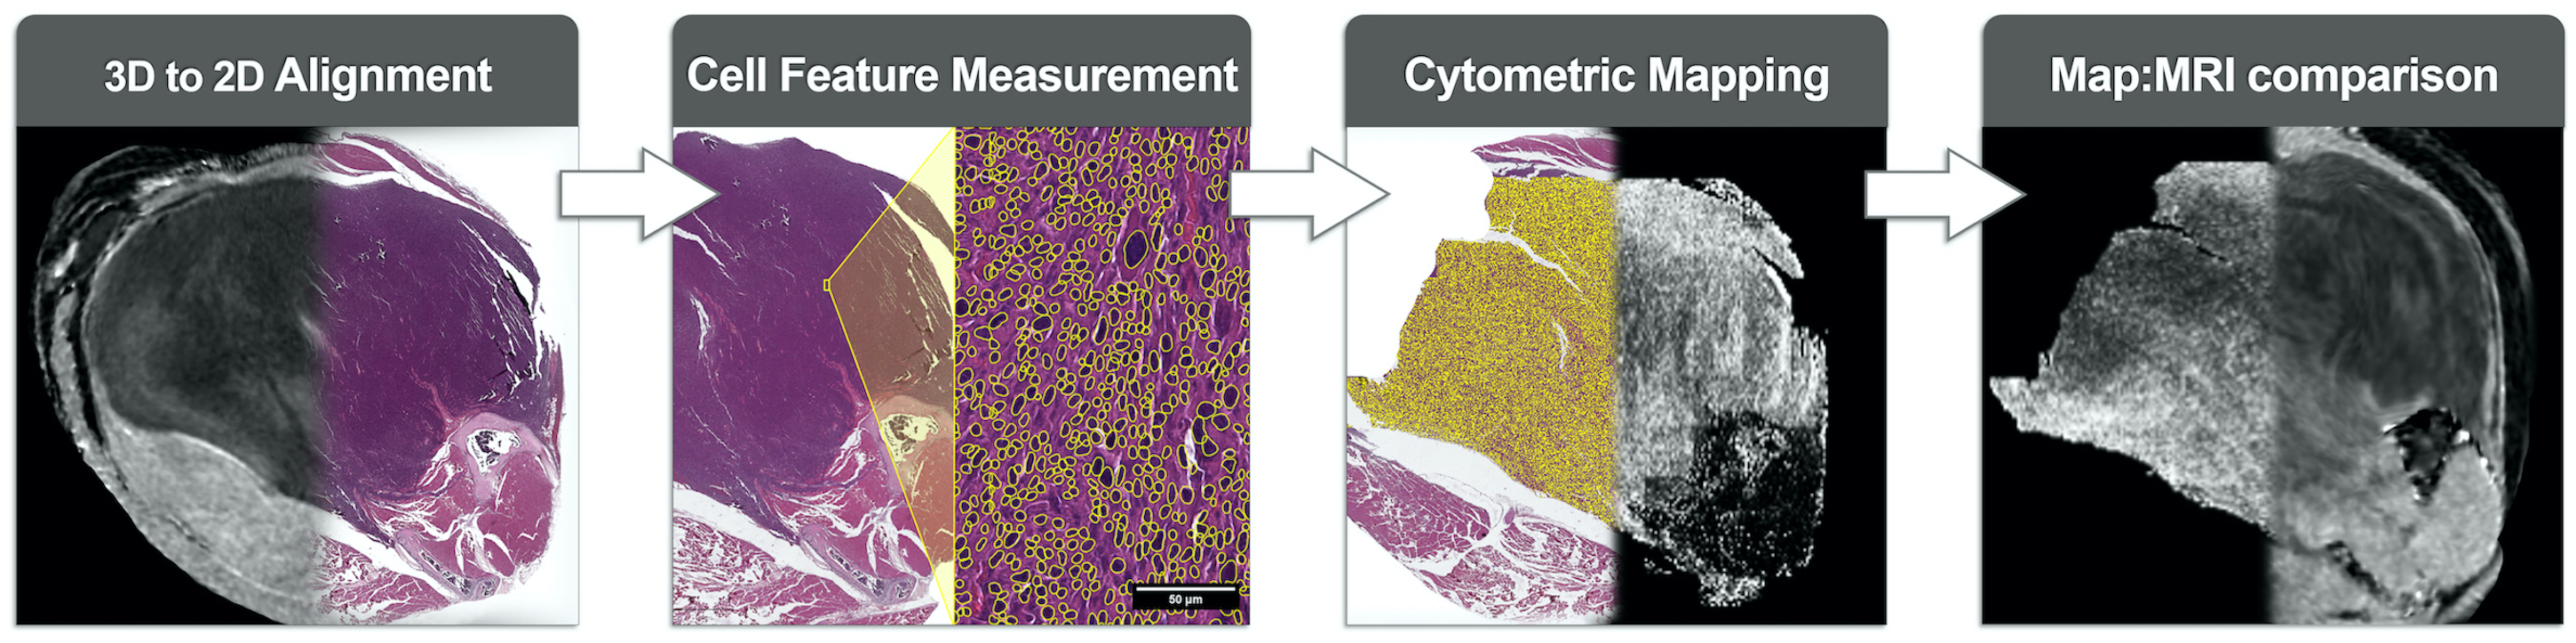
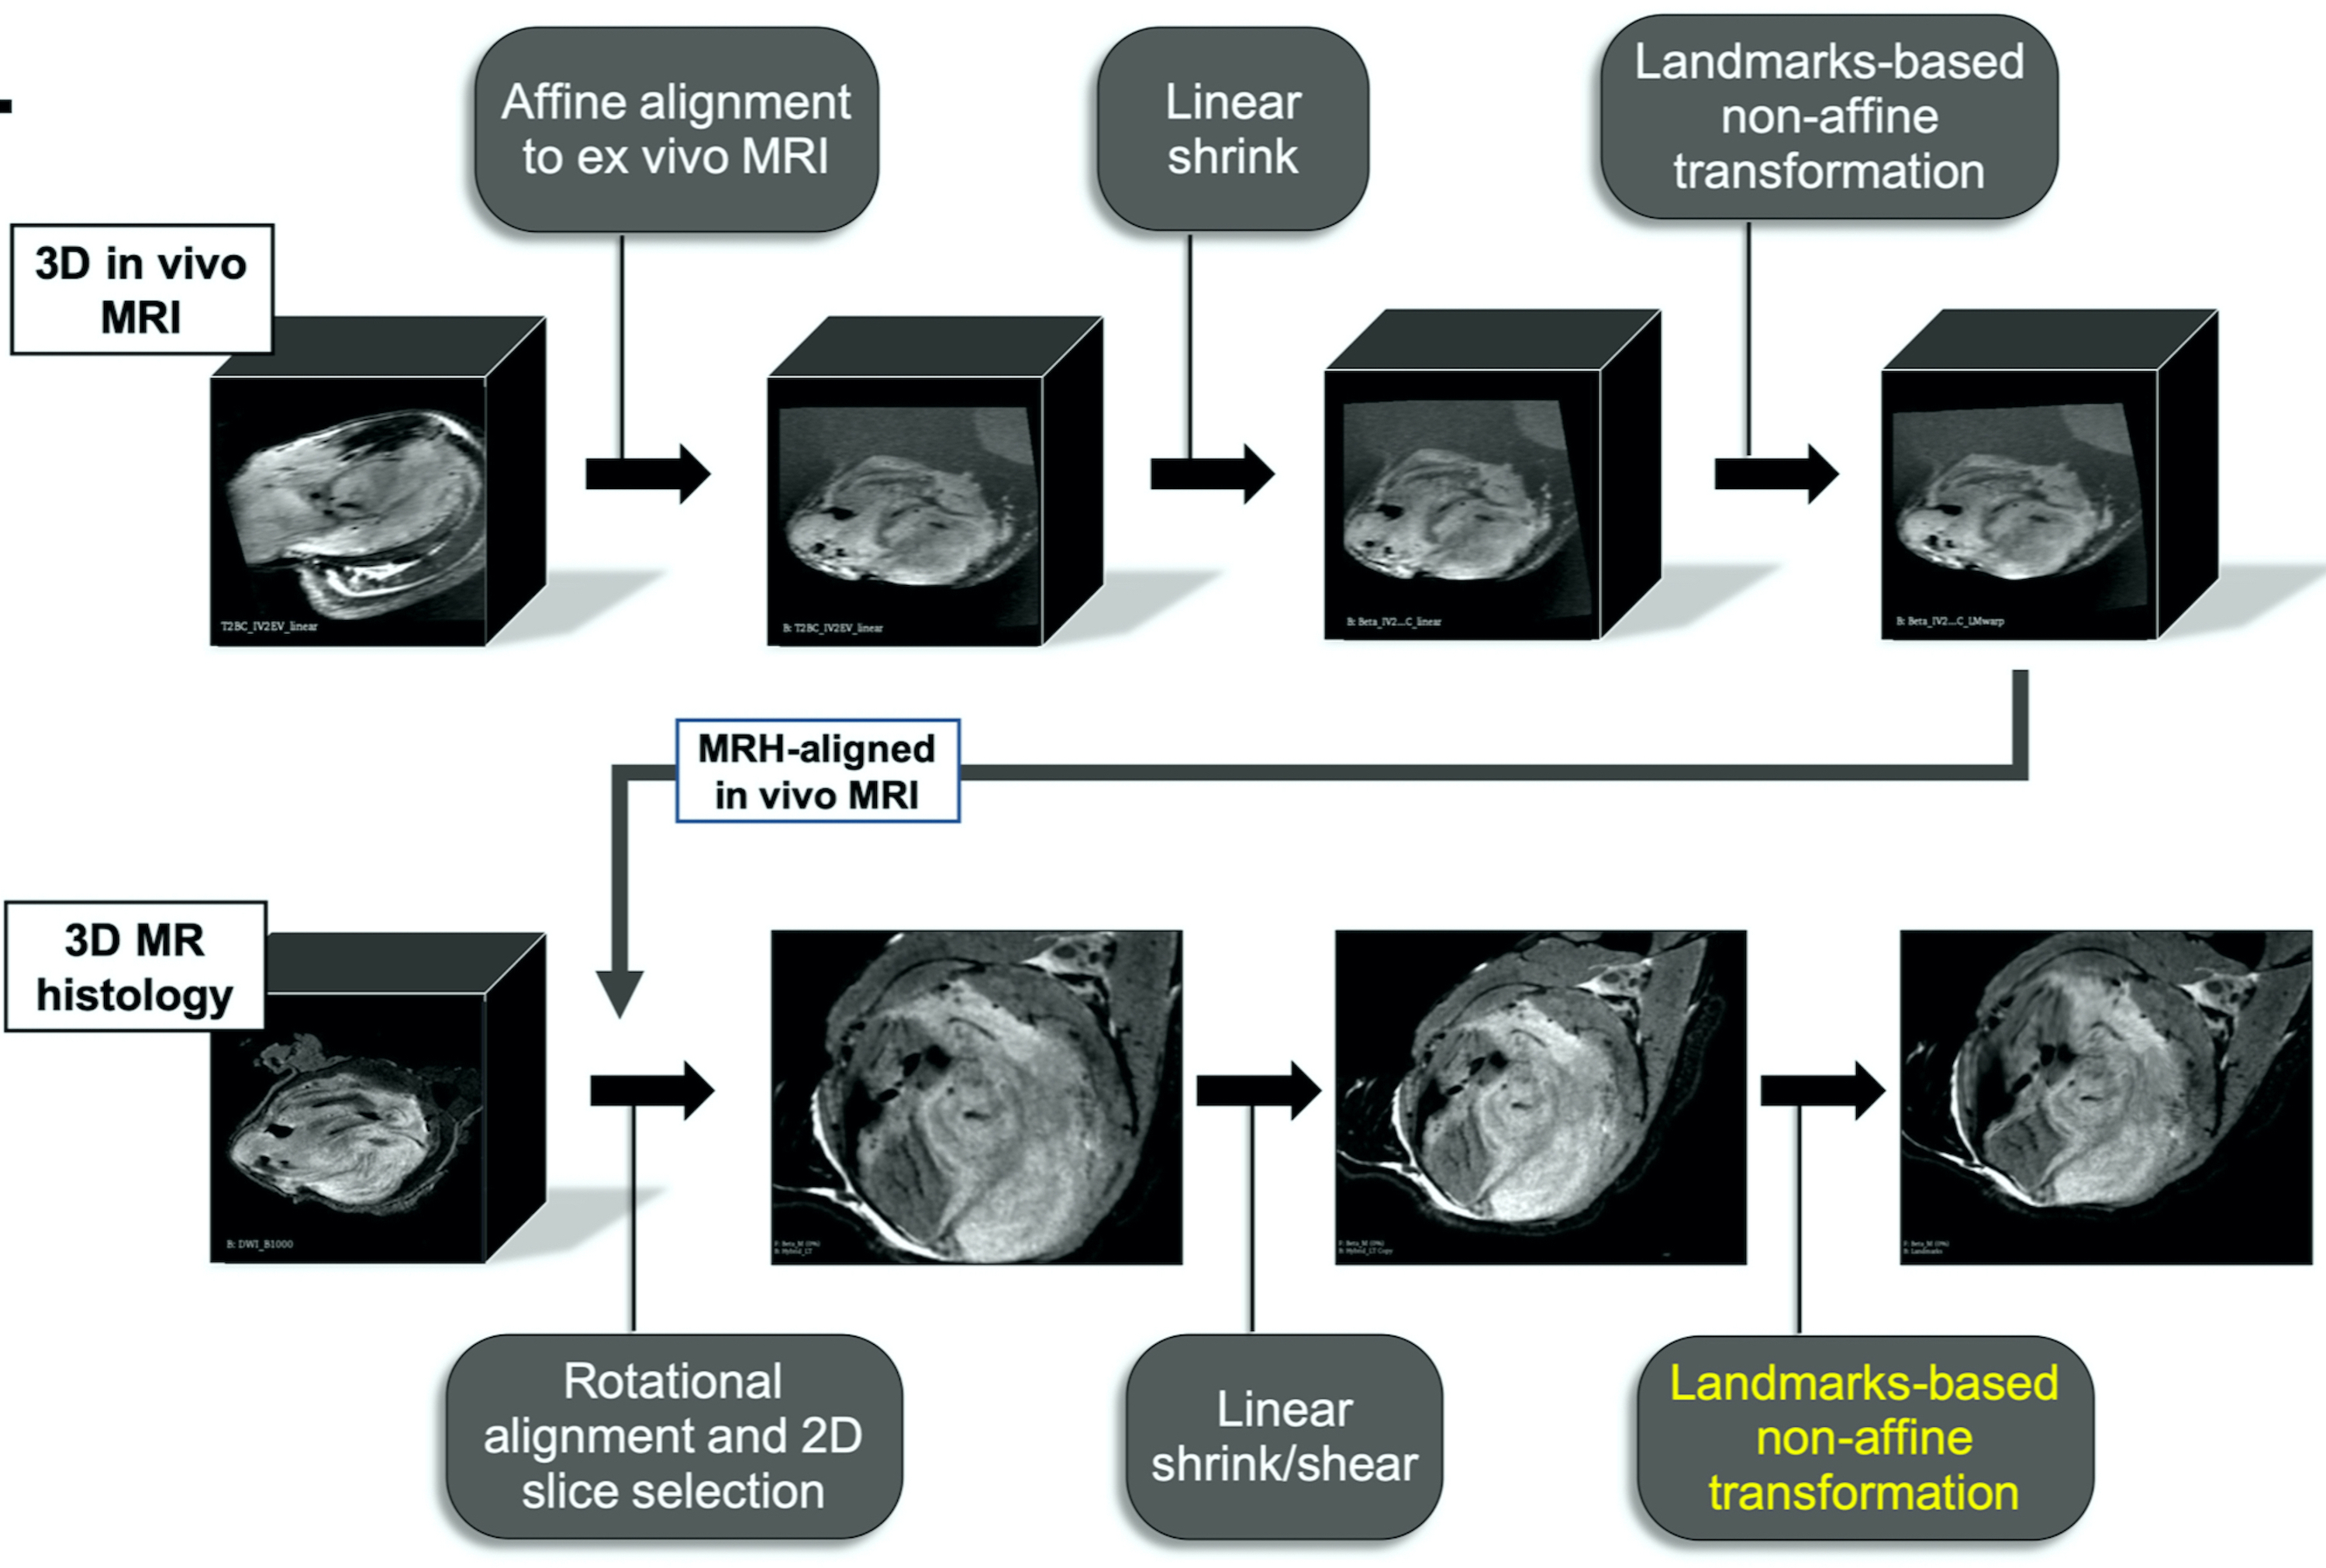
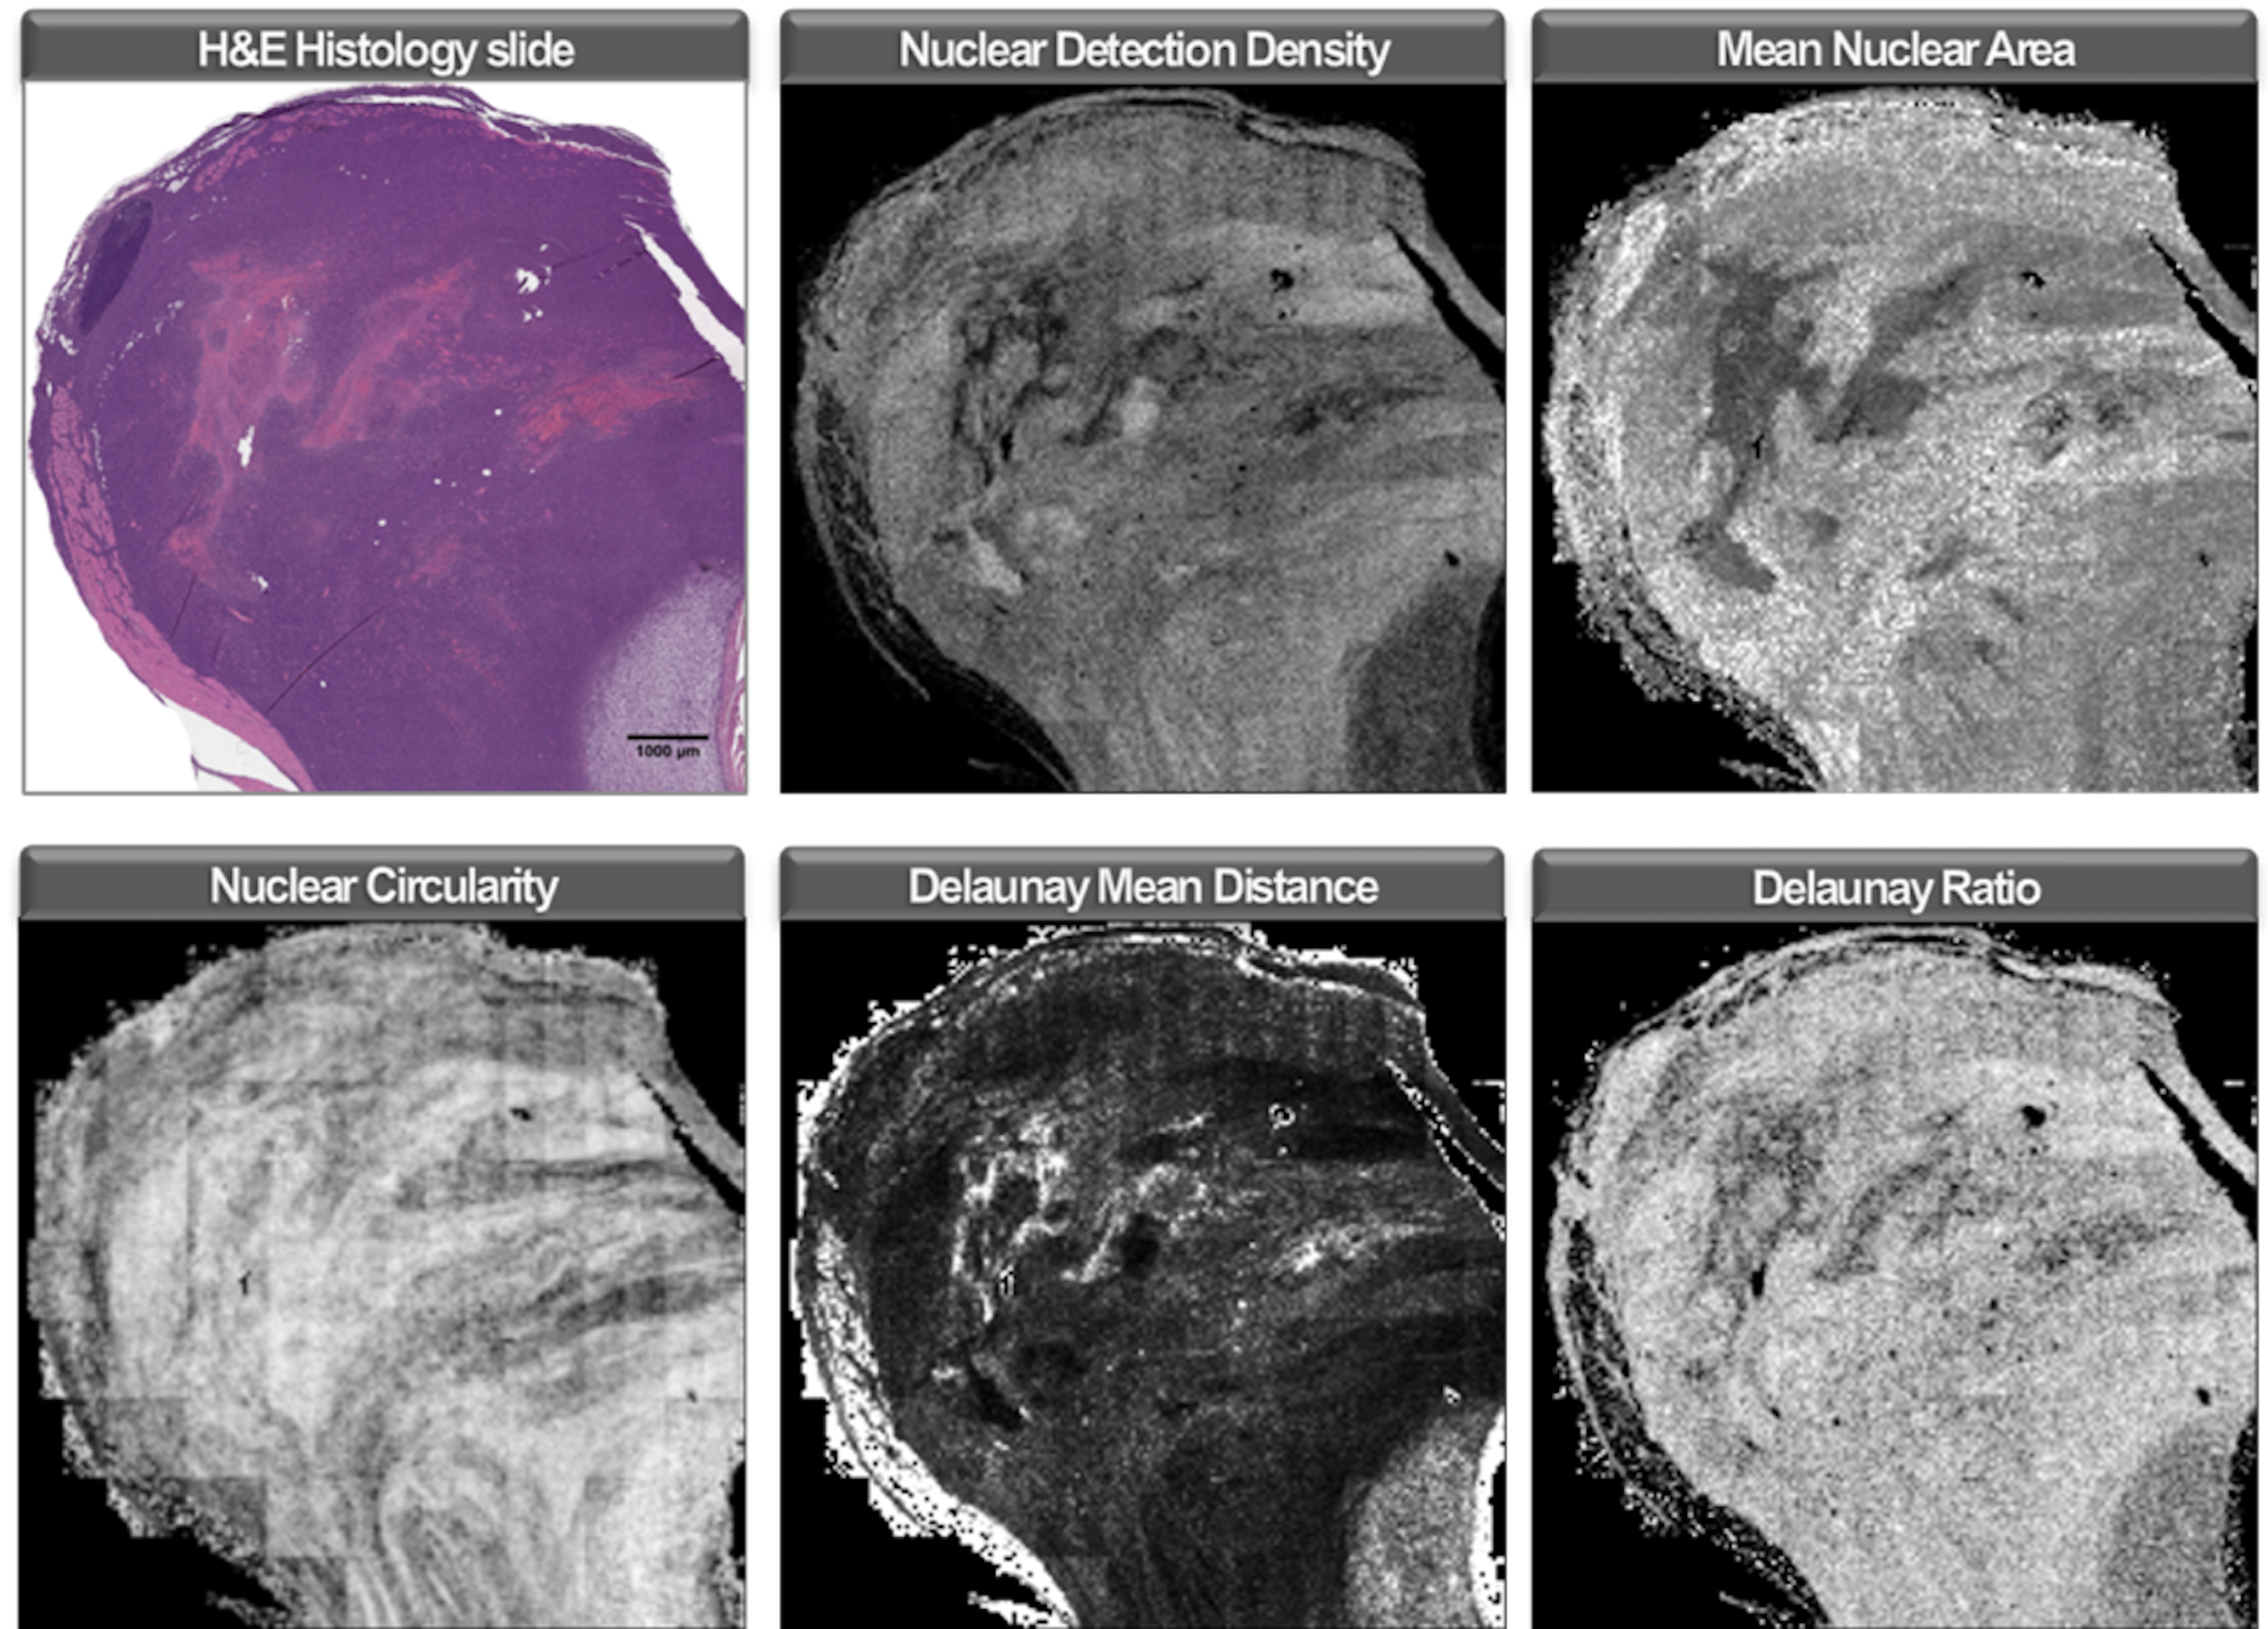
We have constructed a preclinical platform for registration and analysis of computationally burdensome imaging libraries which incorporates ImageJ, FIJI, 3D Slicer, and QuPath. We have performed a pilot study in mouse models of undifferentiated pleiomorphic sarcoma3 that include histology sections and multiparametric MR (Figure 1). MR images of the tumor-bearing hind limb (n=10) were acquired in vivo at 7T with a 4-element surface coil, including T1, T2, a diffusion weighted (DW) series (b = 0, 100, 300, 500), and a multi-gradient recalled echo (MGRE) sequence (TE = 4, 19, 34, 49 ms). Subsequently, ex vivo MR histology (MRH)4 of fixed tissue was acquired, including a DW series (b = 0, 500, 1000, 1500, 2000) and an MGRE sequence (TE = 3.2, 9.3, 15.5, 21.6). ADC and T2* images were calculated from DW and MGRE images, respectively. Paraffin embedded cross-sections were stained with H&E and digitized (40X). Registration of in vivo MR, MRH, and pathology images was performed using a multi-step protocol of affine, shrink, and deformable landmarks-based transformations (Figure 2). Binarized tumor masks from native images were used to assess registration success by calculating Dice scores (DSC)5, and registered samples achieving DSC < 0.8 were excluded as registration failures (n=1 slide). Quantitative maps of cytometric features were derived from a multi-step nuclear segmentation across whole histology slides (>600,000 nuclei/slide). Maps of approximately 50 cytometric features (Figure 3) were compared to registered MR slices with automated signal binning and ROI measurement. Feature values were compared to tumor ADC and T2* and plotted as a function of each. Linear regressions were performed on group data and p < 0.05 described significantly non-zero slopes. Pearson scores (r) were calculated to assess possible correlations between histology features and MR signal, and goodness of fit was described with R2.Results
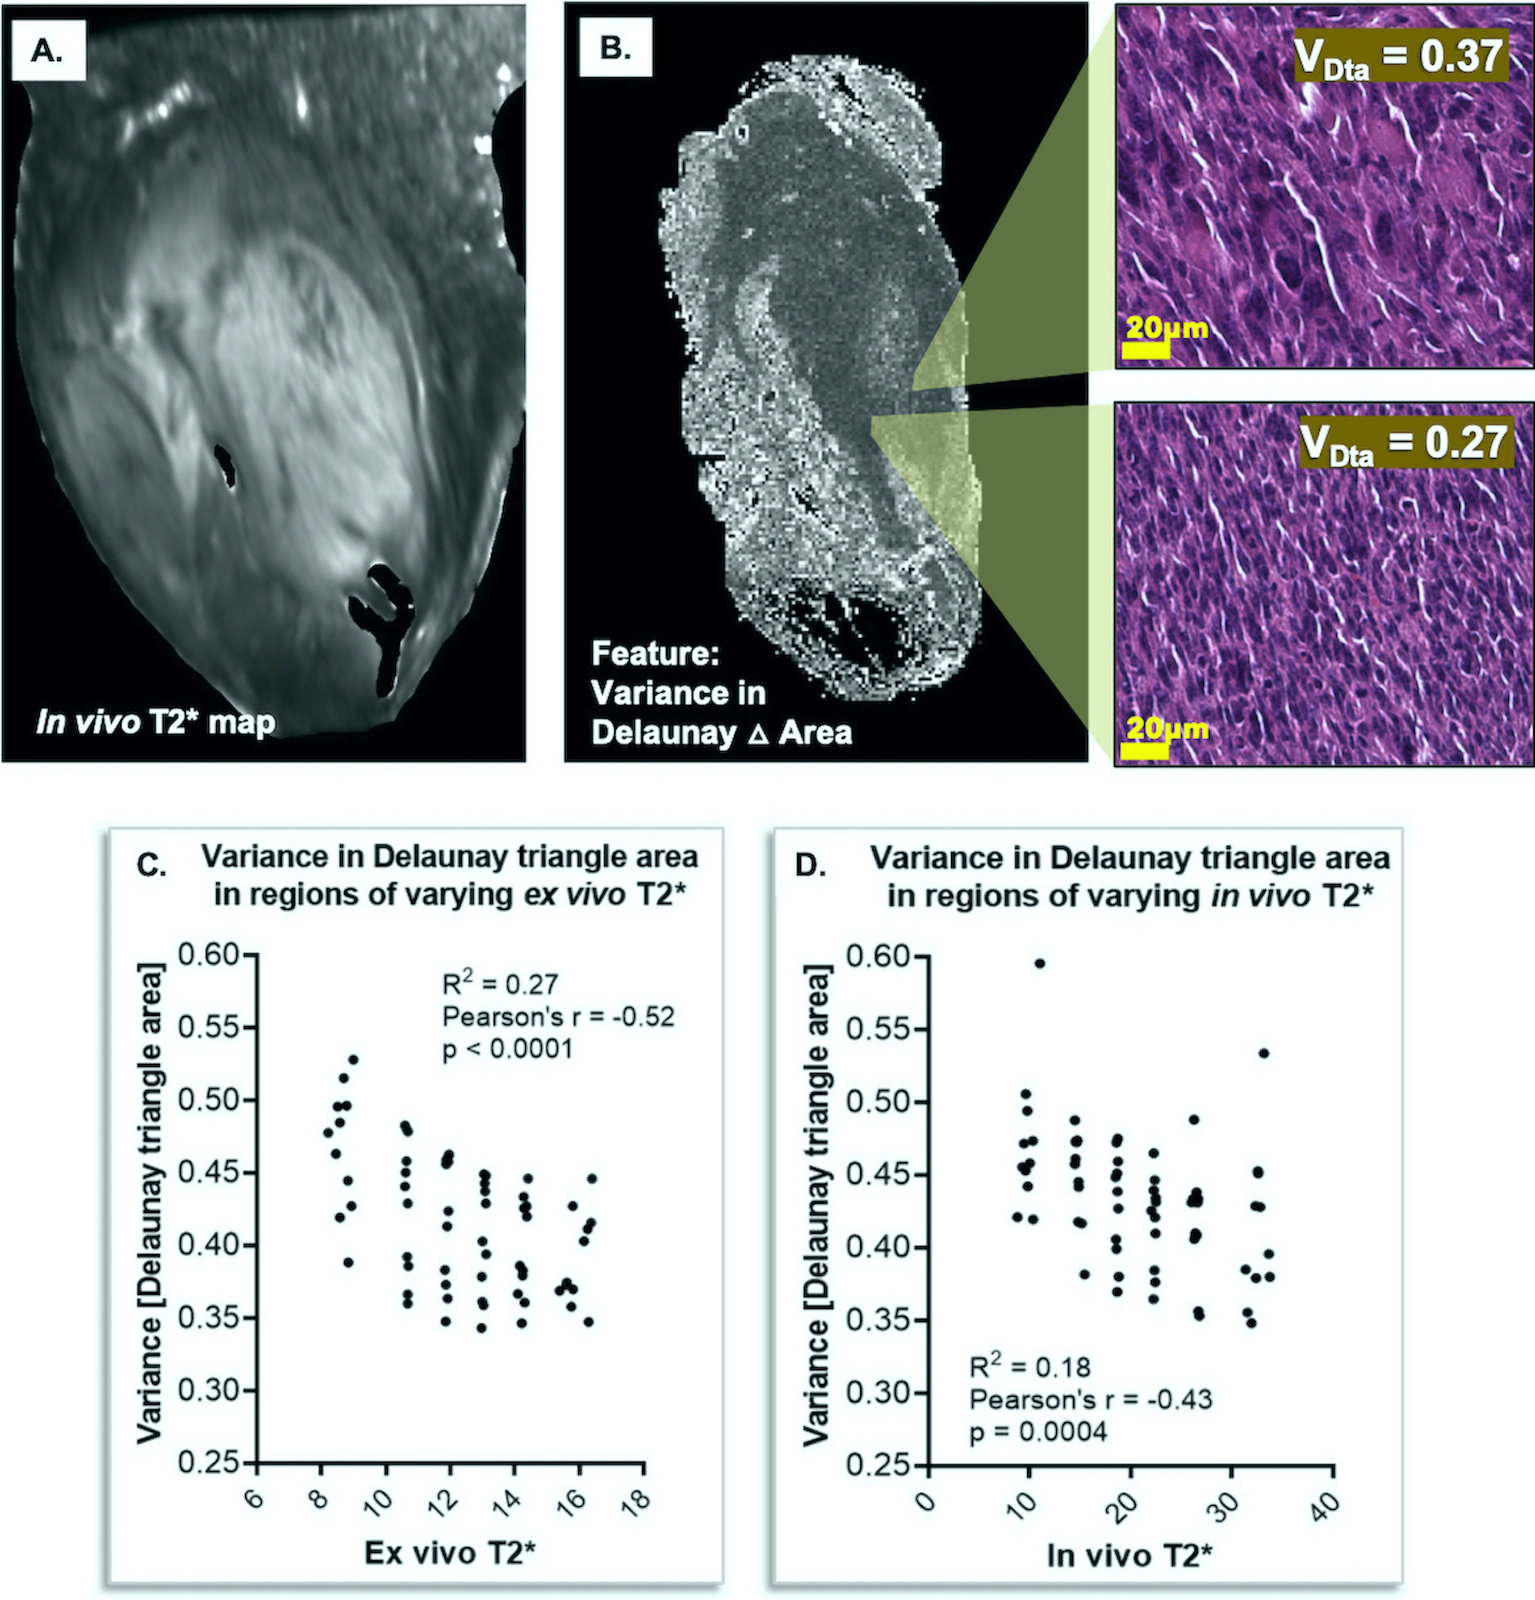
Registration of 3D MR images to 2D pathology slides demonstrated reliable registration, with a mean ex vivo DSC of 0.91, and mean in vivo DSC of 0.88. When comparing cytometric features with ADC, there were no significantly non-zero relationships identified with in vivo or ex vivo images. Detection count (cell density) showed a slightly non-zero trend with ex vivo ADC (r = -0.22; R2 = 0.05; p = 0.07), but this was not significant. Moreover, opposing trends between ADC and detection count were noted between samples. No trends were observed among in vivo ADC data, due in part to noise bias at greater distances from the surface coil. In stark contrast, T2* demonstrated significant linear relationships with multiple cytometric features that were maintained in both ex vivo and in vivo MR. Correlations were frequently observed between T2* and Delaunay triangulation metrics comparing cell-to-cell distances and organization. In particular, measures of local variance in Delaunay distances among cell neighbors correlated with T2*. Variance in Delaunay triangle area correlated with T2* both ex vivo (r = -0.52; R2 = 0.27; p < 0.0001) and in vivo (r = -0.43; R2 = 0.18; p = 0.0004) (Figure 4). Variance in Delaunay distance also correlated ex vivo (r = -0.49; R2 = 0.24; p < 0.0001) and in vivo (r = -0.39; R2 = 0.15; p = 0.0012). Delaunay ratio, comparing anisotropy of cell-to-cell distances, also correlated with T2* ex vivo (r = -0.43; R2 = 0.18; p = 0.0004) and in vivo (r = -0.26; R2 = 0.07; p = 0.0361). Other features that correlated to T2* to a lesser extent, either in vivo or ex vivo, included nuclear area, nuclear circularity, mean Delaunay distance and triangle area, and detection counts.Conclusions
Utilizing the constructed platform, we were able to reliably register multiparametric preclinical imaging libraries. We provided early evidence for relationships between T2* and a variety of cytometric features in sarcomas, which may be indicative of the pleiomorphic nature of these tumors. Expanded studies are required to validate and better interpret these findings. By creating strategies for pathology-based assessment of potential tumor MR biomarkers, we hope to empower radiologists with the pathologist’s perspective.Acknowledgements
All small animal imaging work was performed at the Duke Center for In Vivo Microscopy. The authors thank Yan Ma (Duke University) for her assistance in tissue preparation and staining. The authors also thank Tyler Jacks (MIT) for providing the LSL-KrasG12D mice and Anton Berns (Netherlands Cancer Institute) for providing the p53fl/fl mice.References
1. Meyer C, Ma B, Kunju LP, Davenport M, Piert M. Challenges in accurate registration of 3-D medical imaging and histopathology in primary prostate cancer. Eur J Nucl Med Mol Imaging. 2013;40 Suppl 1:S72-8. doi: 10.1007/s00259-013-2382-2. PubMed PMID: 23503575; PubMed Central PMCID: PMCPMC3689866.
2. McGrath DM, Lee J, Foltz WD, Samavati N, Jewett MA, van der Kwast T, et al. Technical Note: Method to correlate whole-specimen histopathology of radical prostatectomy with diagnostic MR imaging. Med Phys. 2016;43(3):1065-72. doi: 10.1118/1.4941016. PubMed PMID: 26936694; PubMed Central PMCID: PMCPMC4744234.
3. Lee CL, Mowery YM, Daniel AR, Zhang D, Sibley AB, Delaney JR, et al. Mutational landscape in genetically engineered, carcinogen-induced, and radiation- induced mouse sarcoma. JCI Insight. 2019;4(13). doi: 10.1172/jci.insight.128698. PubMed PMID: 31112524; PubMed Central PMCID: PMCPMC6629293.
4. Johnson GA, Cofer GP, Fubara B, Gewalt SL, Hedlund LW, Maronpot RR. Magnetic resonance histology for morphologic phenotyping. J Magn Reson Imaging. 2002;16(4):423-9. doi: 10.1002/jmri.10175. PubMed PMID: 12353257.
5. Zou KH, Warfield SK, Bharatha A, Tempany CM, Kaus MR, Haker SJ, et al. Statistical validation of image segmentation quality based on a spatial overlap index. Acad Radiol. 2004;11(2):178-89. doi: 10.1016/s1076-6332(03)00671-8. PubMed PMID: 14974593; PubMed Central PMCID: PMCPMC1415224.
Figures