1229
Deuterium MRI brain mapping of absence seizure medication: ethosuximide illustration1Section Biomedical Imaging, MOIN CC, Kiel University, Kiel, Germany, 2Otto Diels Institute for Organic Chemistry, Kiel University, Kiel, Germany, 3Fachhochschule Südwestfalen, Fachbereich Elektrotechnik und Informationstechnik, Lüdenscheid, Germany, 4Institute of Physiology, Kiel University, Kiel, Germany
Synopsis
The mechanisms of action of many common antiepileptics are currently not fully understood. These drugs have a narrow therapeutic window with some severe side effects. Here, we are setting up a pipeline to study the distribution of CNS-targeting drugs non-invasively with MRI, using deuterium (2H) labelling and deuterium magnetic resonance spectroscopy.
Introduction
Efficient pharmacological treatment of neurological and psychiatric disorders is often hindered by poor drug penetration of the blood-brain barrier (BBB) after systemic application. Accordingly, current research explores delivery routes that can bypass the BBB. To comprehend the efficacy and temporal dynamics of drug action between different delivery routes, it is crucial to understand the dynamics of drug distribution within the brain. Magnetic resonance imaging (MRI) and spectroscopy (MRS) are powerful, non-invasive diagnostic techniques. MRS allows non-invasive insights into biochemistry and biodistribution of small molecules. It is severely hampered, however, by some intrinsic obstacles: the signals of small metabolites at ≈ 1-10mM are much smaller and often “buried” under the signals of fat and water ([1H] = 111M). Here, we are developing an alternative MRS approach: deuterium metabolic imaging (DMI or 2H-MRS).1 DMI enables speedy signal accumulation due to the fast relaxation of deuterium, also, it is less susceptible to B0-inhomogeneities compared to 1H, and is practically free of background signal (high contrast). The natural abundance (or mole fraction) of 2H, however, is no more than 0.011%, such that the concentration of 2H in pure water amounts to ≈ 12mM only. Water is the only detectable 2H-background signal and its concentration (and hence signal) is comparable with the concentration of administrated medication and now dedicated signal suppression is required. To explore the feasibility of 2H-MRS approach for the tracking of drug distributions over time, we here used the deuterium labelled anti-epileptic drug ethosuximide (ETX).Methods
NMR (Figure 1,2). High-resolution (non-localized) 1H and 2H NMR spectra of ETX and deuterated ETX (ETX-D4,4’) in aqueous solution ([D2O]:[H2O]=1:9) were acquired at 400MHz (9.4T, WB Bruker Avance NEO NMR, 5mm tubes, 10mm BBO probe). T1 relaxation times were measured using the inversion recovery method.MRI (Figure 4,5). Turbo RARE sequence with FOV 20mm x 20mm x 1mm and resolution 256x256 and localized 2H PRESS-MRS were measured for the phantom sample on the same MR-system using a 25mm dual tune 1H/2H resonator (Bruker). Rodent in vivo experiments are planned for Q1-2/2021.
Synthesize (Figure 1). Pure ETX-D4,4’ with 95% deuteration fraction was obtained in a rapid microwave-assisted deuterium exchange of ETX in methanol-D4 with potassium tert-butoxide. We achieved over 90% deuteration in the first round and 95% after repetition with fresh methanol-D4. After an acidic workup, tert-butanol and methanol was evacuated.
Results and discussion
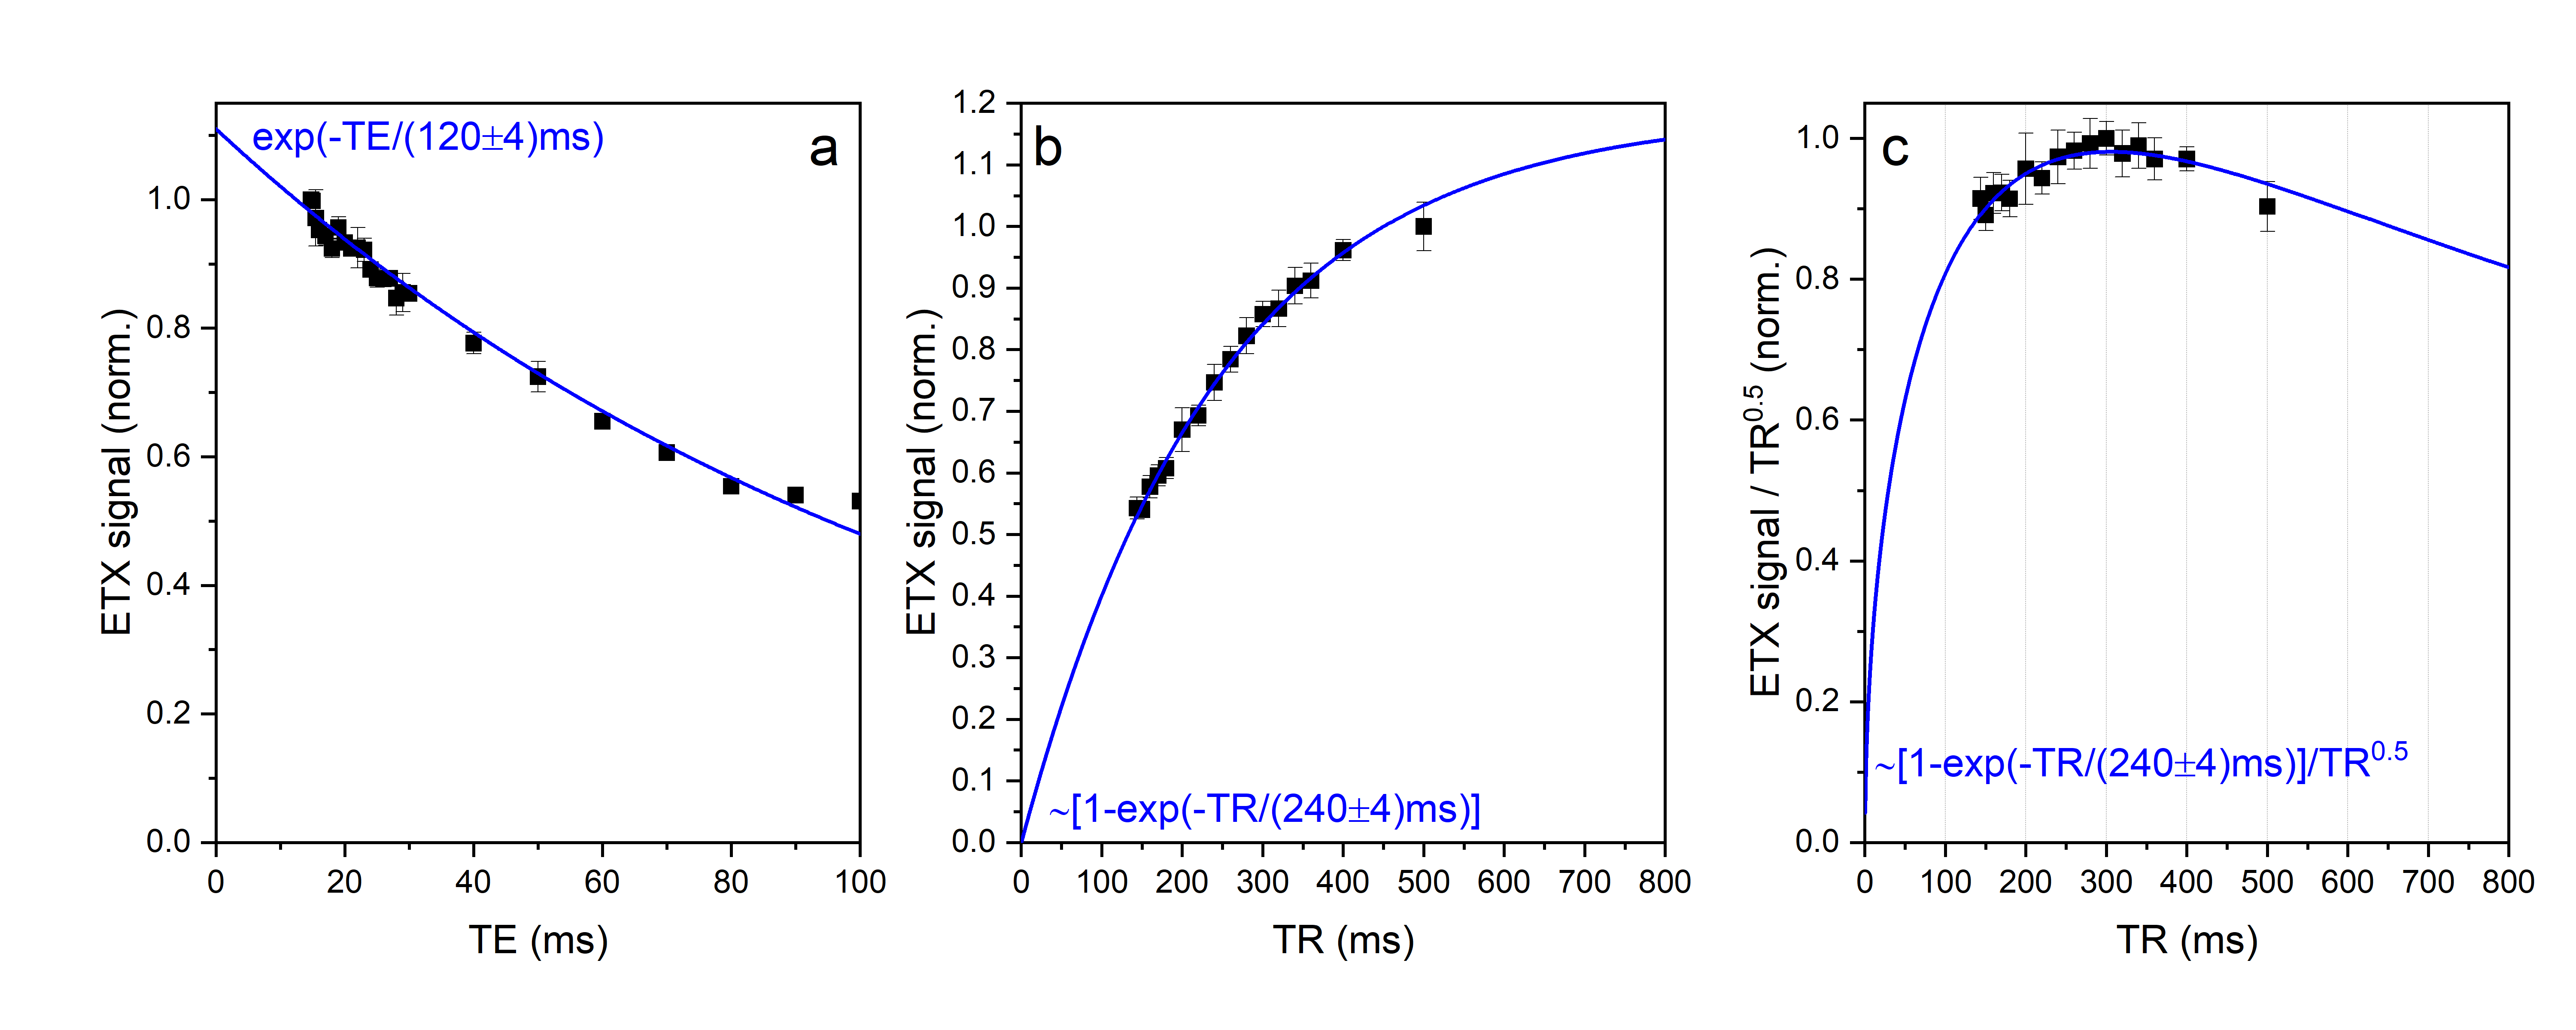
2H relaxation. Although deuterium is a quadrupole nucleus, its relaxation times were found to be not much shorter than the corresponding relaxation times of protons (Figure 2): T1 of ETX was about 0.25s for D4,4’ and 2.1 s for H4,4’ (in the same conditions). Note that T2 relaxation time was also not much different since the linewidth was < 2Hz, allowing to estimate that their T2 > 0.15s. Thus, the relaxation times of deuterium are well suited for the rapid accumulation of the signal. Furthermore, at the same time, relaxation is slow enough for single voxel spectroscopy such as PRESS or STEAM2 or chemical shift imaging (CSI).Optimal TR for 2H-MRS. The MR signal as a function of TR and TE in spin-echo experiments can be estimated with (1-exp(-TR/T1)) exp(-TE/T2). From here it follows that TE should be as small as possible while TR on the contrary long. However, the experimental time is limited (i) and SNR increases only as a square root of a number of scans, NS1/2, (ii). Thus, there is an optimal TR that provides the highest SNR for the given experimental time. This optimal TR is ~1.25*T1 (Figure 3c). We measured ETX-D4,4’ with 2H-PRESS as a function of TE and TR (Figure 4). The results revealed the optimal parameters for TR ~ 300ms (Figure 4c), that is close to the theoretically predicted values.
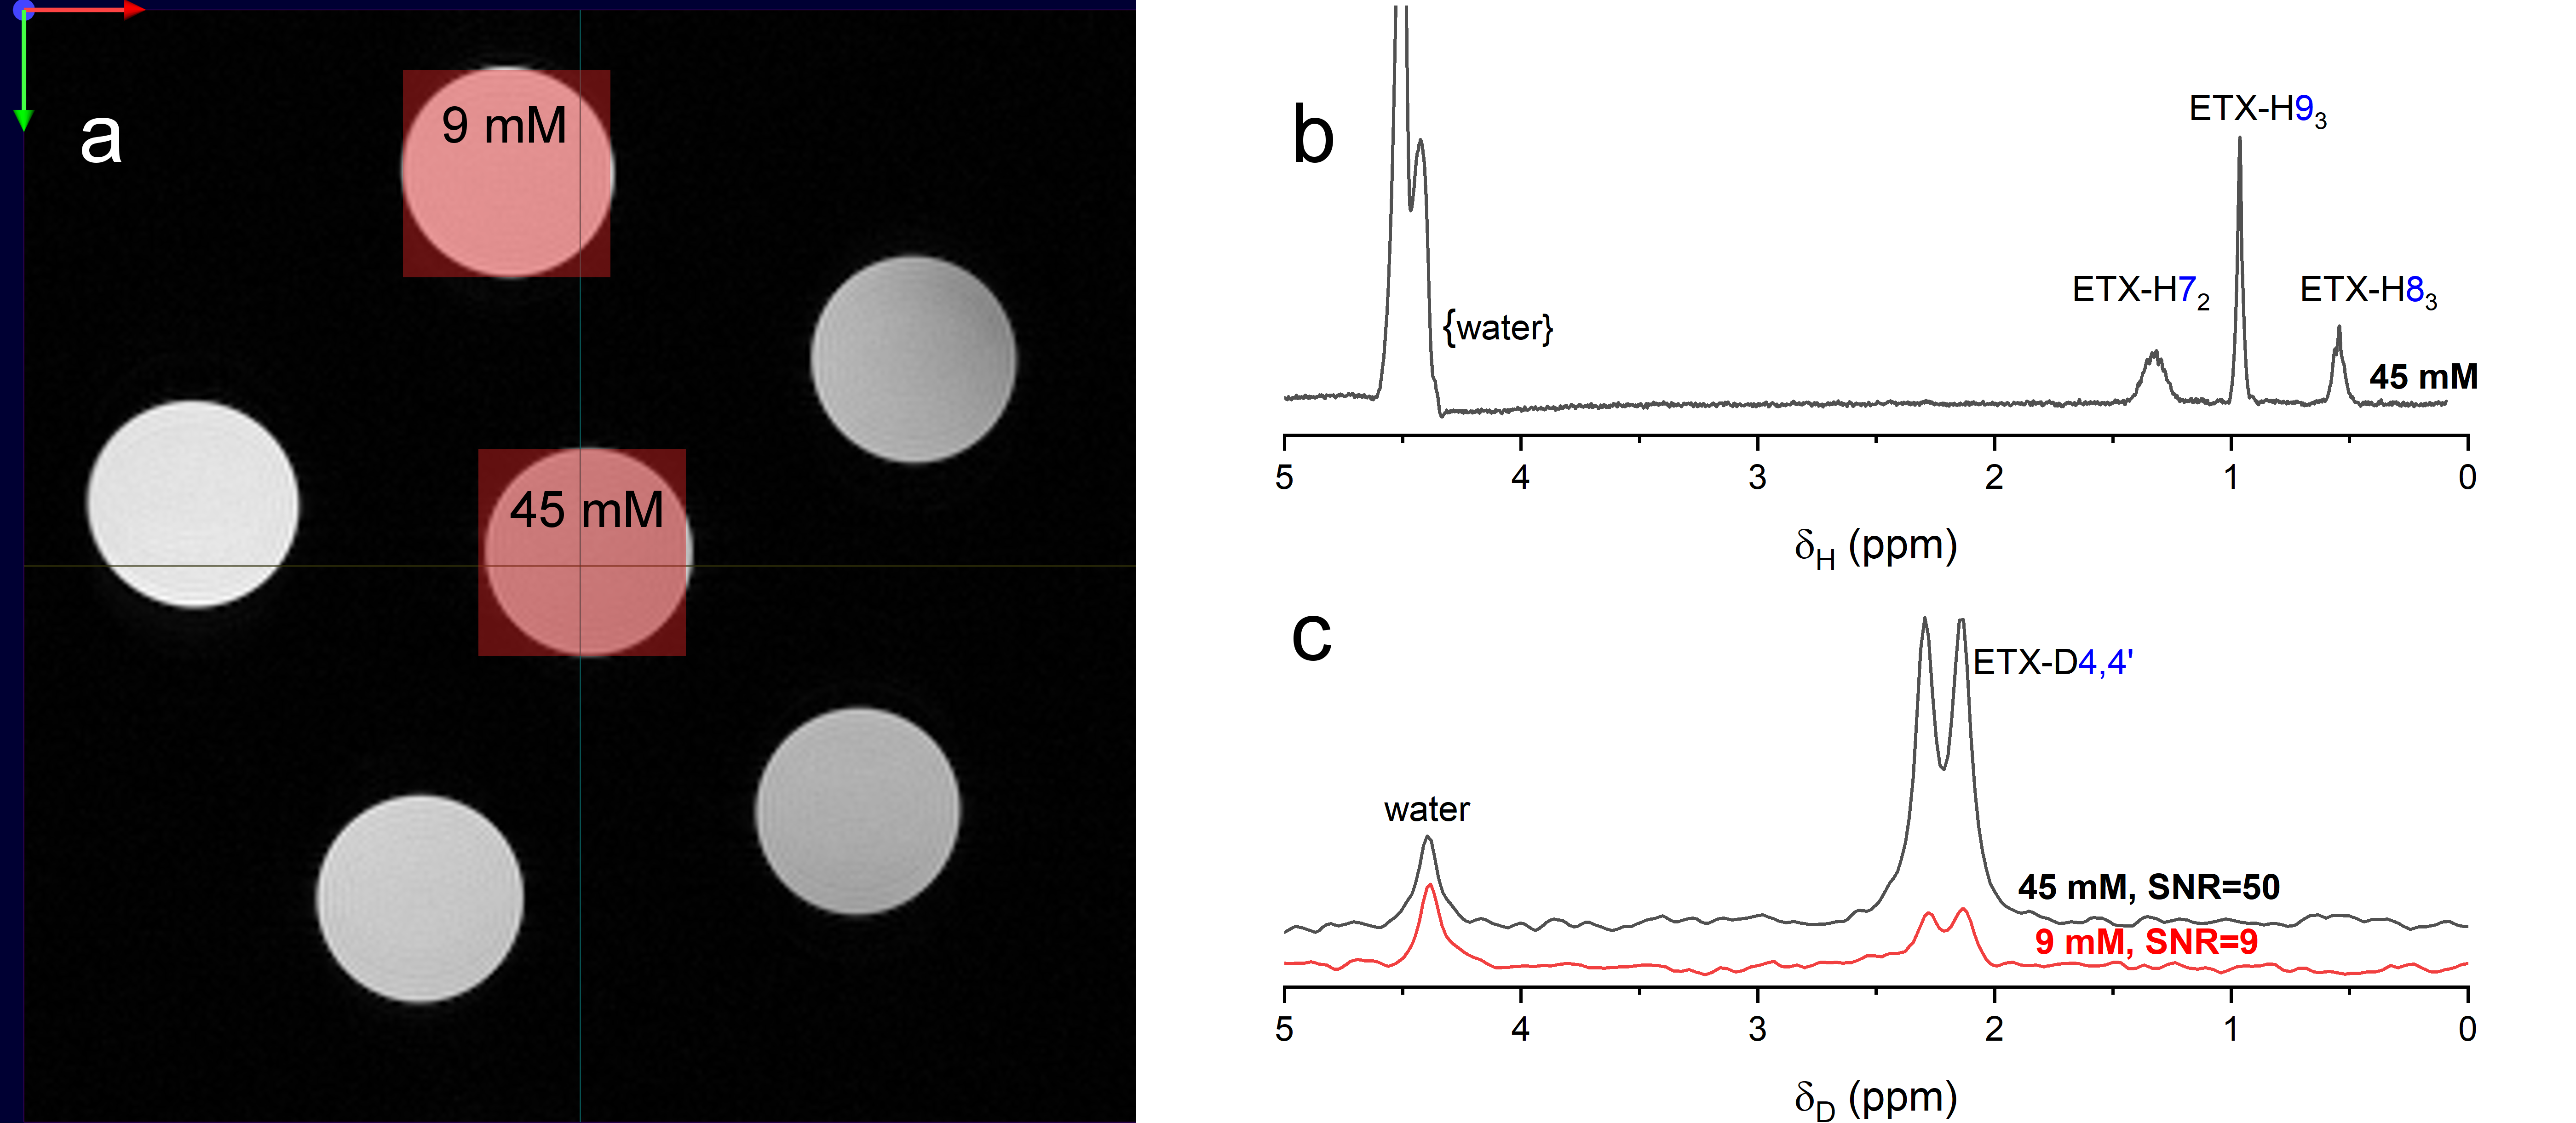
SNR of 1H- and 2H-PRESS. With the optimal parameters for 1H-PRESS (TE=16.5ms, TR=2000ms, NS=1200) and 2H-PRESS (TE=14.2ms, TR=300ms, NS=8000) and the same voxel size of 4 mm x 4 mm x 4 mm, and total acquisition time of 40 minutes localized spectra were measured (Figure 5). Obtained SNRs for D4,4’, H72, H93 and H83 of 45mM ETX-D4,4’ were 50, 73, 330 and 105 respectively. Among measured protons, H93 gives the sharpest singlet peak. D4,4’ is appearing as two partially overlapping signals that correspond to two individual 2H. From this, one can conclude that SNR of 1H is 110 and SNR of 2H is ~50 per spin. This gives a hint that alternative deuteration would be more preferable: 3 times higher SNR of ~150 is expected for ETX-D93.
Conclusion
We have done all preparation steps for the future in vivo DMI of ETX-D4,4’. Although, the magnetogyric ratio of 2H is not in favour of high MR-signal, the rapid accumulation, sharp lines even in an inhomogeneous magnetic field and low the background signal is allowing a successful DMI measurement. The measurement time (40 minutes) and special resolution (voxels 4mm x 4mm x 4mm) are reasonable for 2H-MRS of samples with a 9mM the concentration of ETX-D4,4’ with SNR of 9. Experimentally we achieved the increase in the number of scans by a factor of 7 (TR for 1H is 2000ms and for 2H is 300 ms) that partially compensates the low signal of 2H.Acknowledgements
We acknowledge funding from BMBF (01ZX1915C), DFG (HO-4602/2-2, HO-4602/3, GRK2154-2019, EXC PMI1267, FOR5042. TRR287), Kiel University and the Faculty of Medicine for supporting the MOIN CC.References
1. Feyter, H. M. D. et al. Deuterium metabolic imaging (DMI) for MRI-based 3D mapping of metabolism in vivo. Sci. Adv. 4, eaat7314 (2018).
2. Moonen, C. T. W. et al. Comparison of single-shot localization methods (steam and press) for In vivo proton NMR spectroscopy. NMR Biomed. 2, 201–208 (1989).
Figures
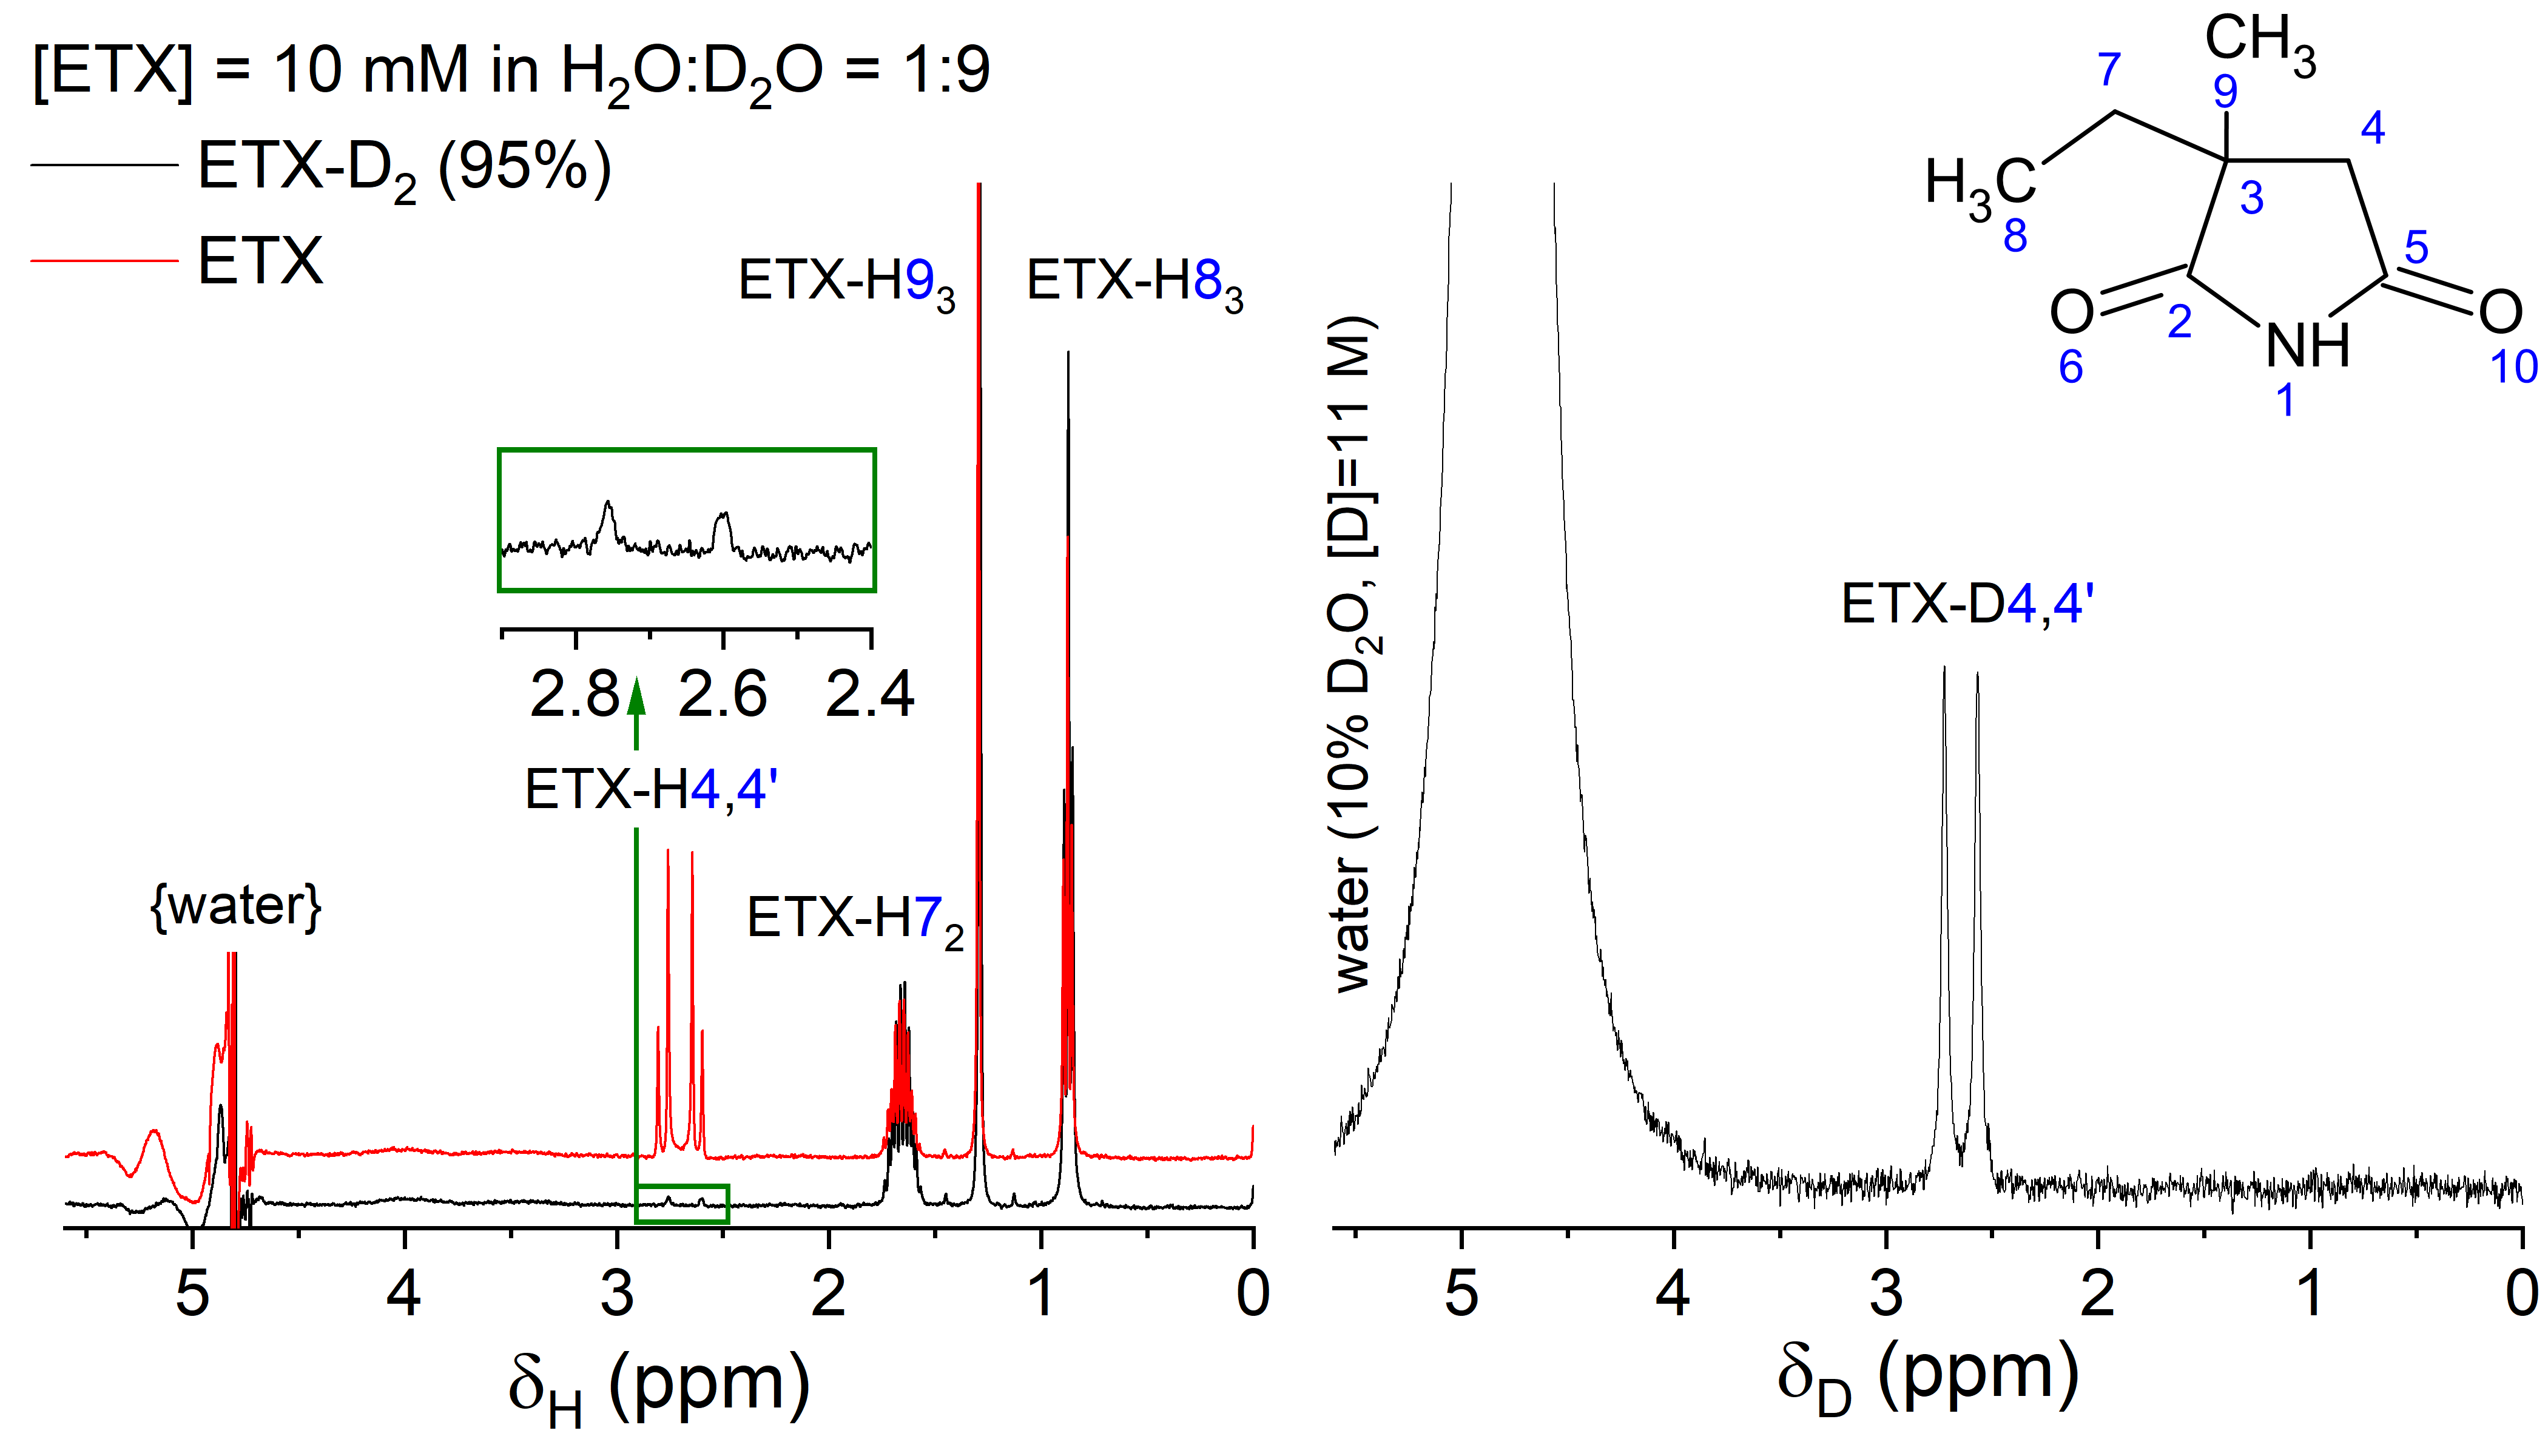
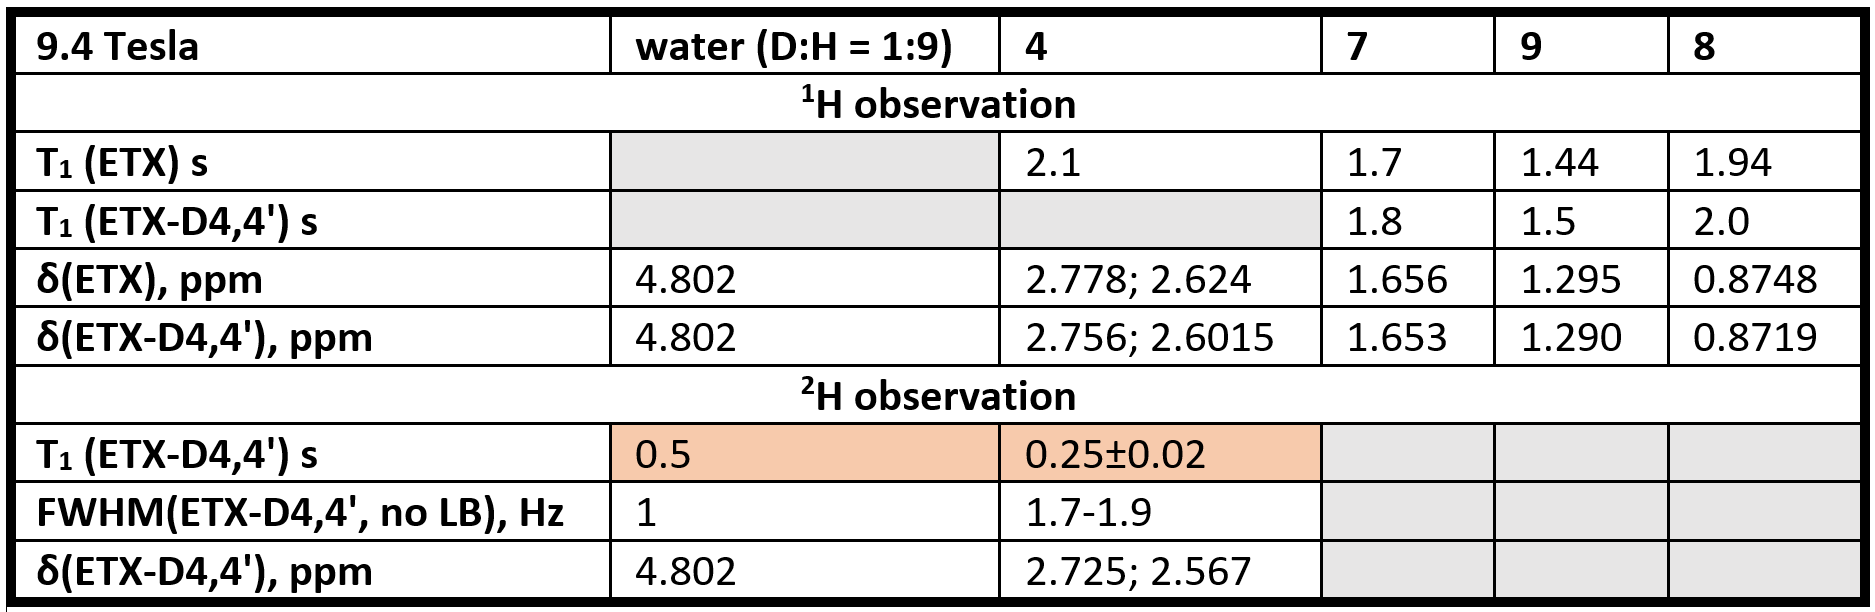
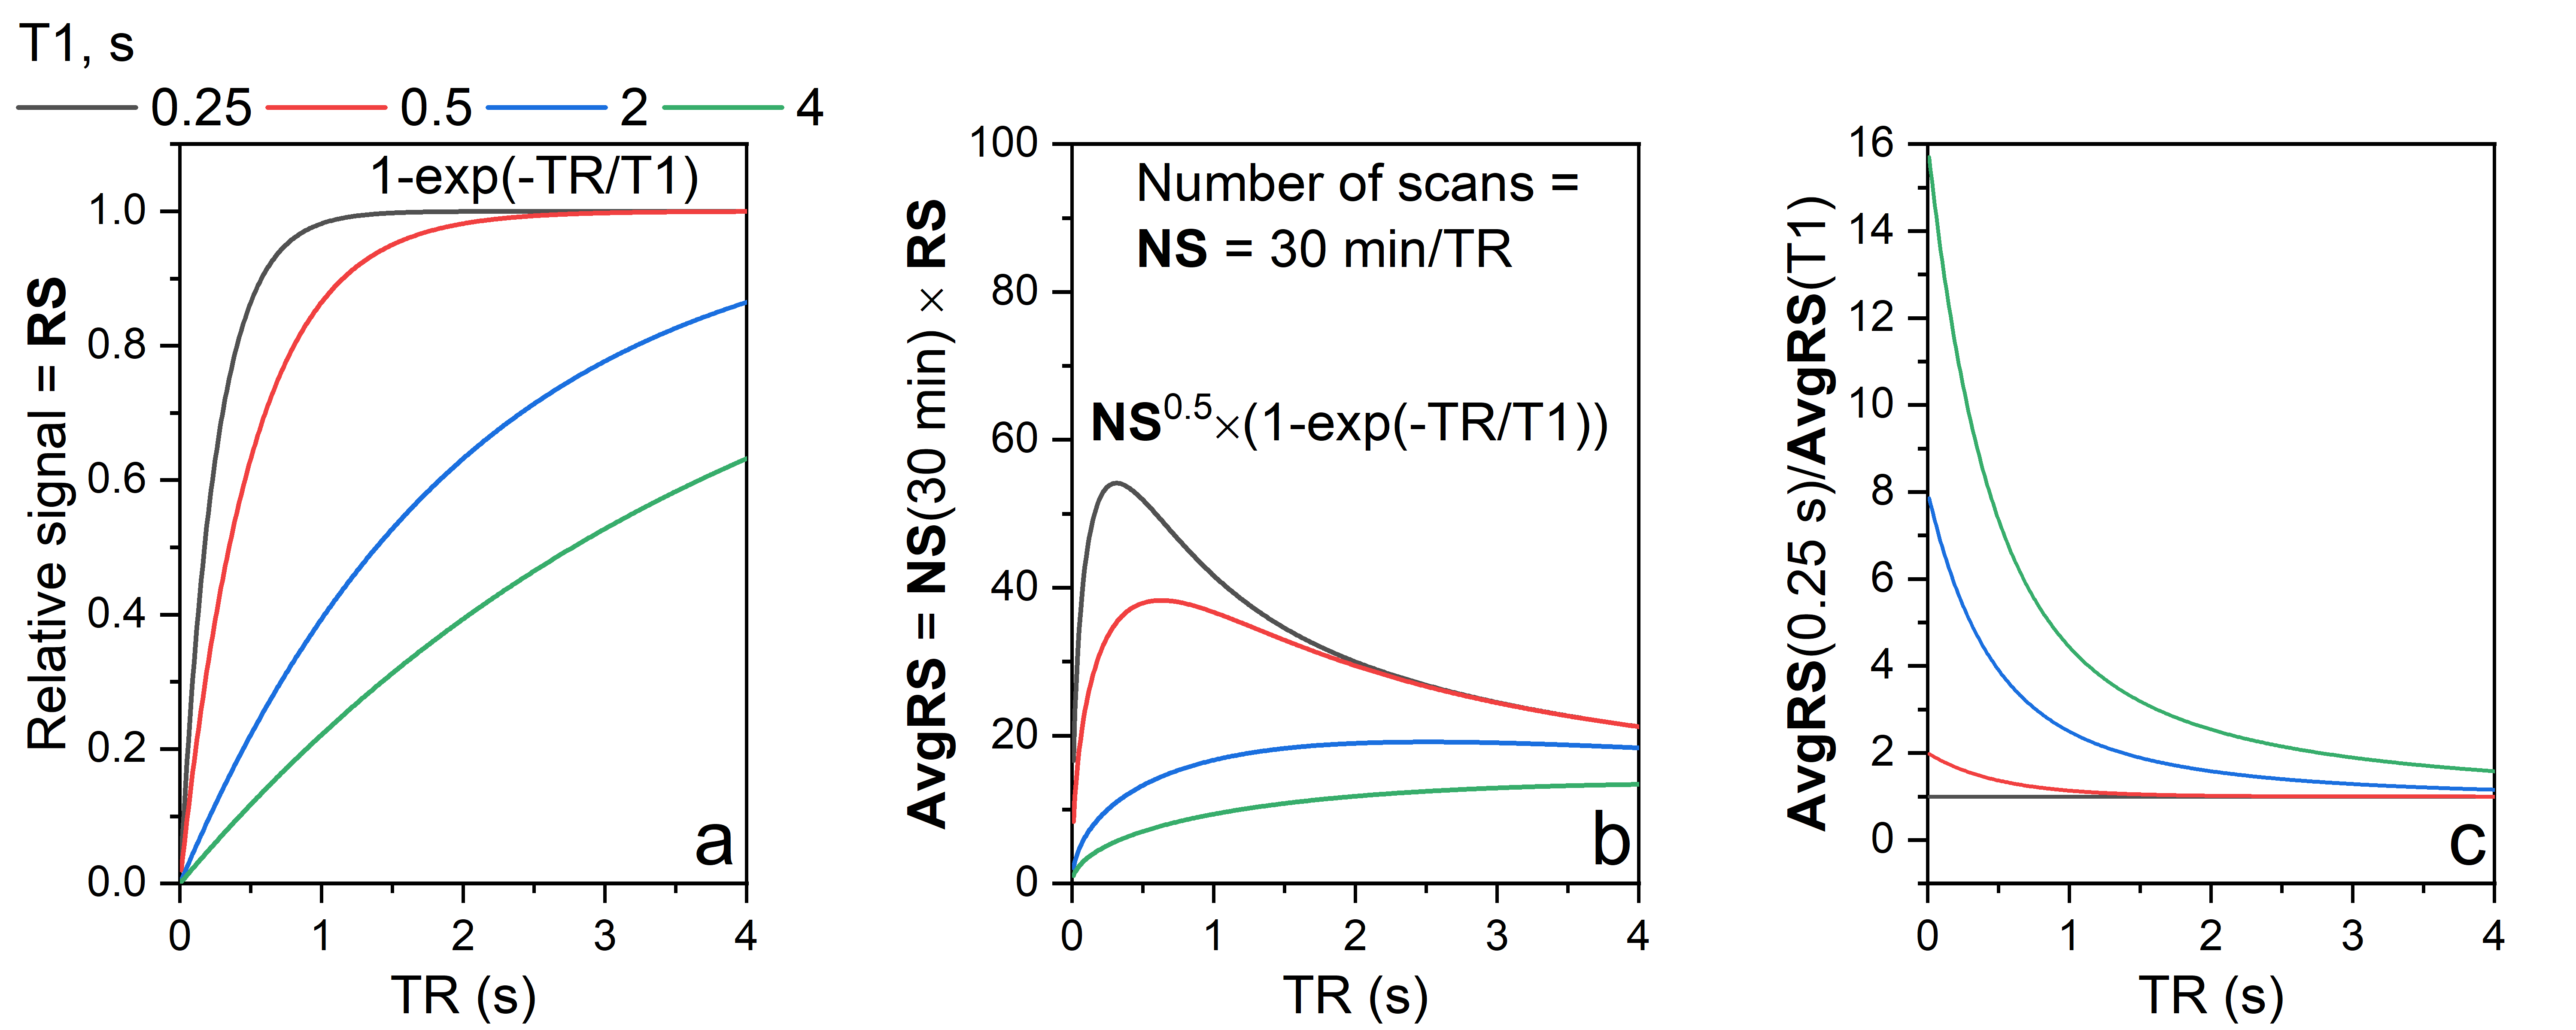
Figure 3. Theoretical estimation of optimal TR for quickly relaxing nuclei (a, b). D4,4’ spins have T1 relaxation times of 0.25 s that for TR = 0.25 s results in 5-8 times higher average signal than can be obtained for spins with T1 of 2-4 s (common for H2O and 1H of small molecules). Here relative MR signal as a function of T1 and TR is estimated with 1-exp(-TR/T1). The maximum of (1-exp(-TR/T1))/TR0.5 is close to 1.25*T1.