1228
Absolute quantification of cardiac 31P metabolites using surface loop and dipole array coils at 7T1Wolfson Brain Imaging Center, University of Cambridge, Cambridge, United Kingdom, 2Department of Electromagnetic and Biomedical Engineering, University of Žilina, Zilina, Slovakia, 3Oxford Centre for Clinical Magnetic Resonance Research, University of Oxford, Oxford, United Kingdom
Synopsis
Phosphorus magnetic resonance spectroscopy (31P-MRS) delivers unique information to aid our understanding of cardiac metabolism. To quantify “absolute” concentrations of phosphorus metabolites (i.e. in recognised units such as mmol / kg wet weight), sensitivity calibration and transmit field correction are required. Ultrahigh field (>7 T) magnets and the use of multichannel RF coils make this even more challenging. In this study, we investigate the feasibility of absolute concentration of phosphorus metabolites in the human heart at 7T, compare our findings to literature values and evaluate reproducibility with different coils and different MR systems.
Introduction
Changes in cardiac energy metabolism are related to all major cardiovascular disorders as well as systemic disease[1], such as obesity[2] and type-II diabetes[3]. Phosphorus magnetic resonance spectroscopy (31P-MRS) affords unique insight into cardiac energetics but has a low intrinsic signal-to-noise ratio (SNR) in humans. This can be increased at 7T, enabling a better investigation of cardiac metabolism[5]. 31P-MRS cardiac energetic assessments are often reported in terms of the PCr/ATP concentration ratio[4] on the assumption that ATP concentration varies little in vivo. However, PCr/ATP is insensitive to simultaneous changes in the concentrations of both metabolites which does occur in heart failure and other diseases. In this study, we have investigated the feasibility to quantify absolute concentrations of human cardiac 31P metabolites at 7T. To demonstrate the versatility of the approach, two different MR systems and three RF coil designs were tested.Methods
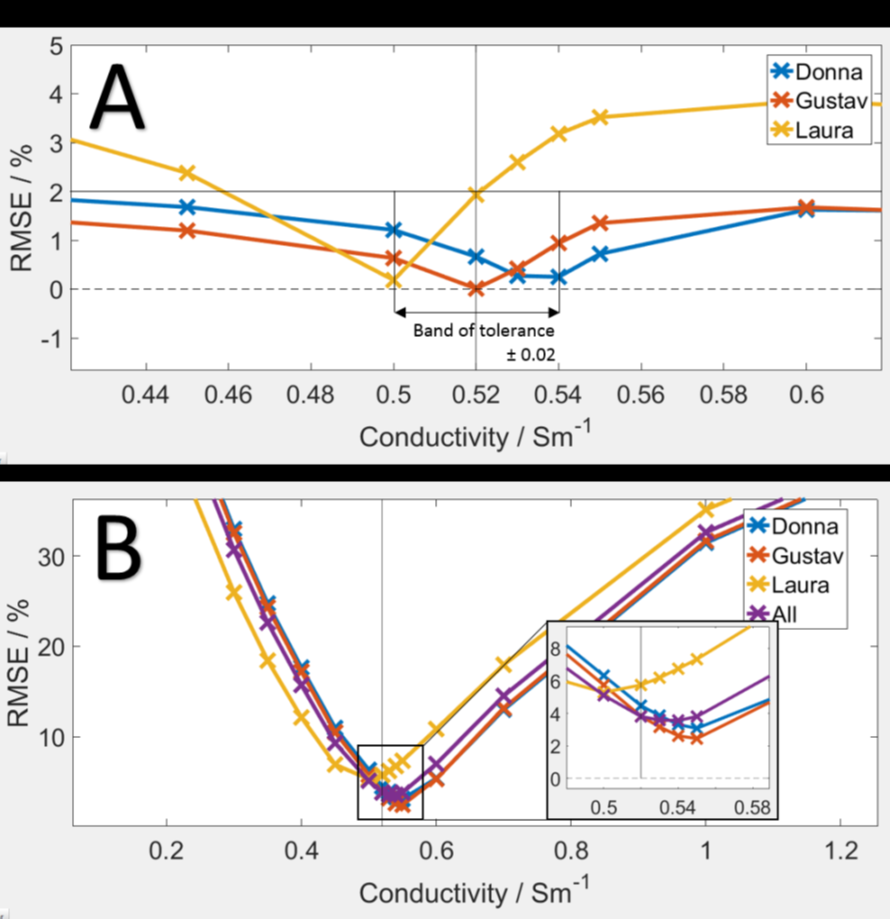
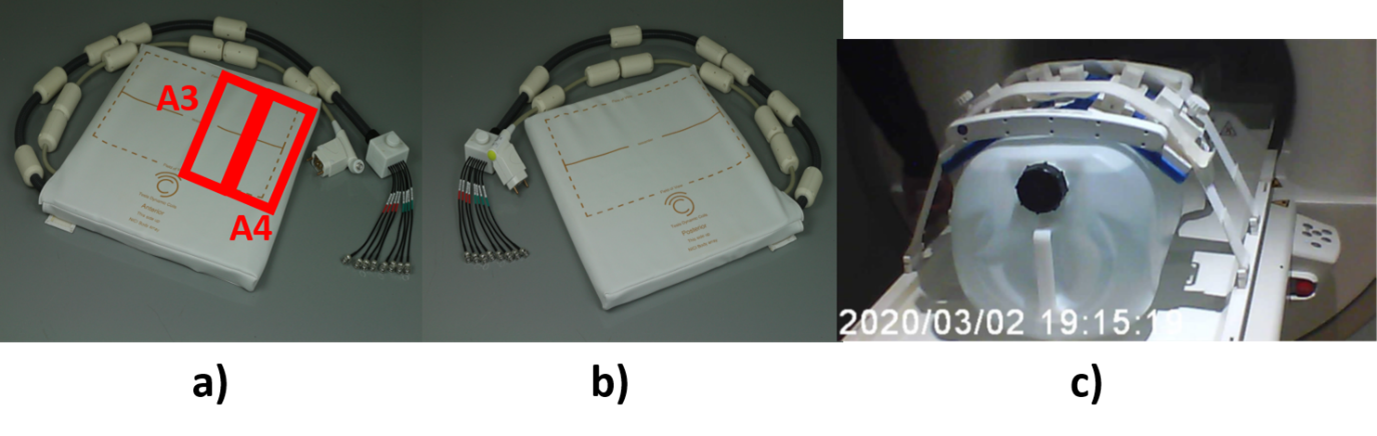
Two different 7T MR systems (Magnetom and Terra, both Siemens Healthineers, Erlangen, Germany) equipped with two different RF coils were used for data acquisition to demonstrate the flexibility of this absolute quantification approach. The Magnetom MR scanner was combined with a 16-channel-receive array coil with local rectangular transmit surface coil (Rapid Biomedical, Rimpar, Germany) (Figure 1) and the Terra MR scanner was equipped with a prototype surface body dipole+loop array (Tesla Dynamic Coils, Zaltbommel, The Netherlands). The surface body coil dipole array is composed of 4 Anterior and 4 posterior Tx/Rx 1H/31P dipoles and 16 31P-Rx loops. For data acquisition, two of the dipoles A3 and A4 were used for transmission(Figure 2).The absolute quantification method in Purvis et al.[6] for liver metabolites at 7T was adjusted for the heart. This required RF field simulations for B1 distribution in several voxel models and determination of target conductivity to be matched by the reference phantom (Figure 1). Based on the simulations, two phantoms containing 30mM K2HPO4 (jerry cans of dimensions 165x700x310 mm3 in Cambridge and 280×280×450 mm3 in Oxford) were prepared and used for the field mapping experiments.
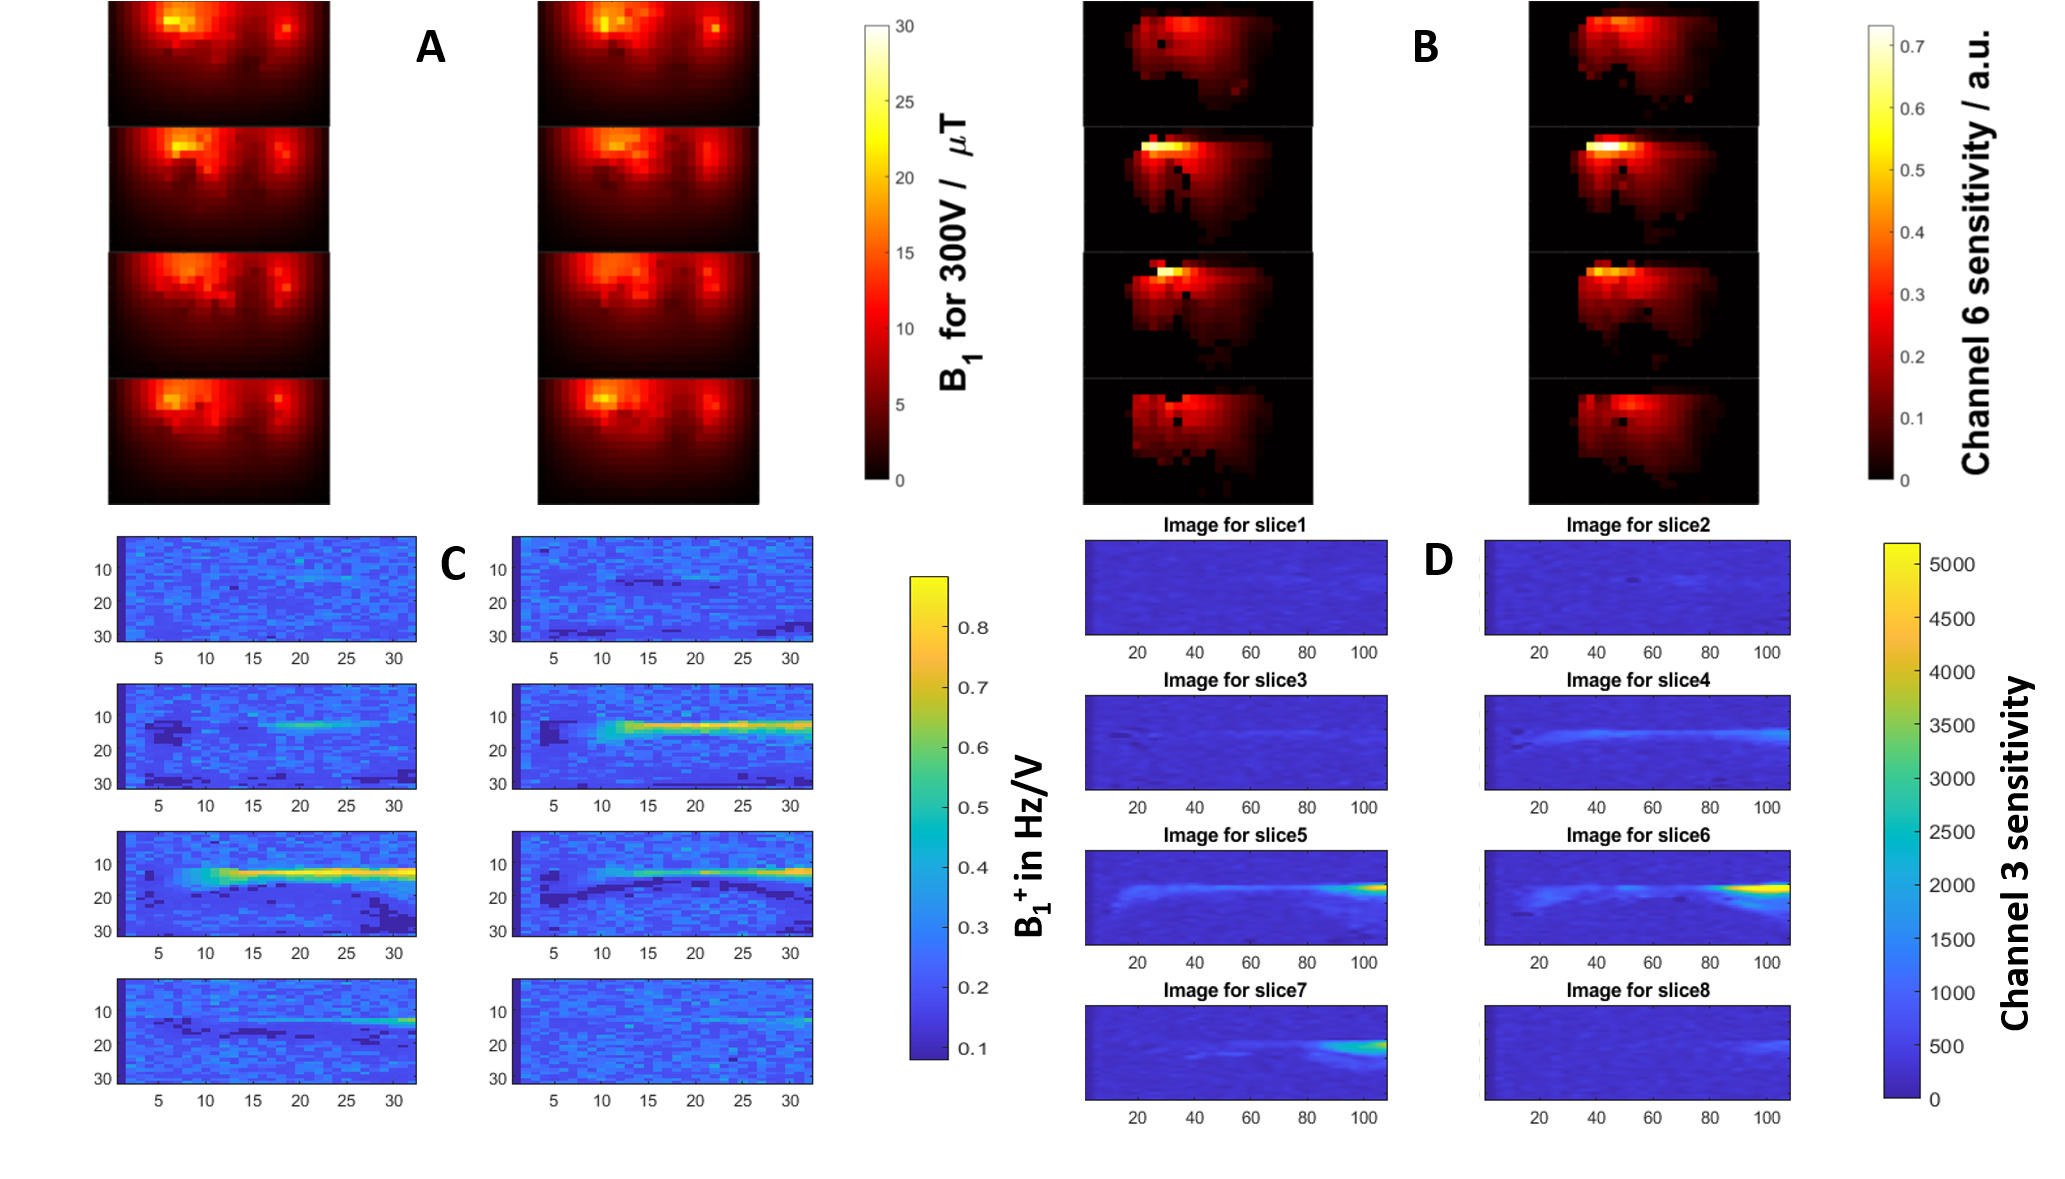
Field maps were acquired as a set of 31P images using a 3D-GRE sequence over a 32×16×8 matrix and a 500×250×15 mm3 field of view. Minimal TE (6.9ms) and a TR of 100ms were used for each image with an increasing transmit voltage of the excitation sinc pulse in steps of 50VRMS from 0-450VRMS.
3D-weighted-CSI cardiac data has been acquired on the heart with TR 1s, matrix size 8x16x8, FOV 220 mm, vector size 1024 points, spectral bandwidth 6 kHz and both 16-channel array body coil (Rapid Biomedical) and dipole+loop array body coil (from Tesla DC). Acquisition time was 6min30s with the 16-channel array body coil (4 averages) and 11min48s for the Tesla DC coil (7 averages).
Data processing:
The field maps were generated by fitting the signal intensities acquired at different voltages and maps of B1+ were converted in Hz/volt by multiplication of the number of degrees FA/Hz calculated for the sinc pulse used in the GRE acquisition.
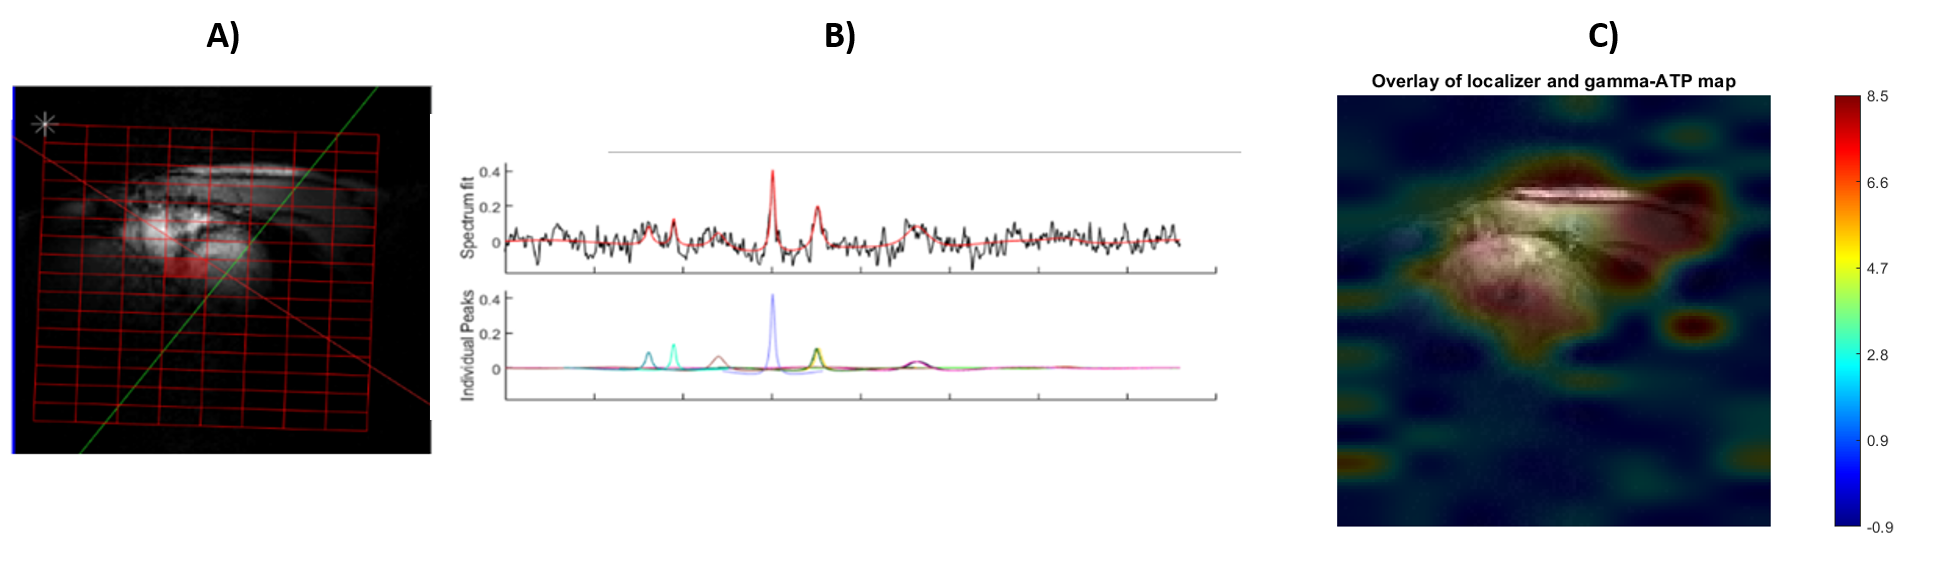
Before analysis, the single‐channel spectra were combined using WSVD[8]. Each spectrum was analyzed using the OXSA toolbox[7]. Fitting was done using the AMARES implemented in OXSA.
For the final absolute quantification of cardiac metabolites, a calibration factor was calculated by scaling the mode of the corrected amplitudes from the reference phantom scan to match the true concentration (30mM). This calibration factor was applied to the in vivo data.
Results and Discussion
Figure 1, simulated conductivity over 3 different voxel models are shown. The simulated conductivities of reference phantoms that would yield the minimal RMSE vs the voxel modes were 0.52S/m for 7T, with the error at 7T rising dramatically with minimal changes in conductivity. Purvis et al. in their liver study found the ideal conductivities to be lower, 0.38S/m for 7T, which reflects the lower conductivity of the liver tissue (0.5S/m) to the cardiac muscle (0.73S/m) and the difference in the organ position and surrounding anatomy.Figure 3 shows B1 field map of the 16-channel array coil and Tesla DC dipole array coil, both for transmission and sensitivity.
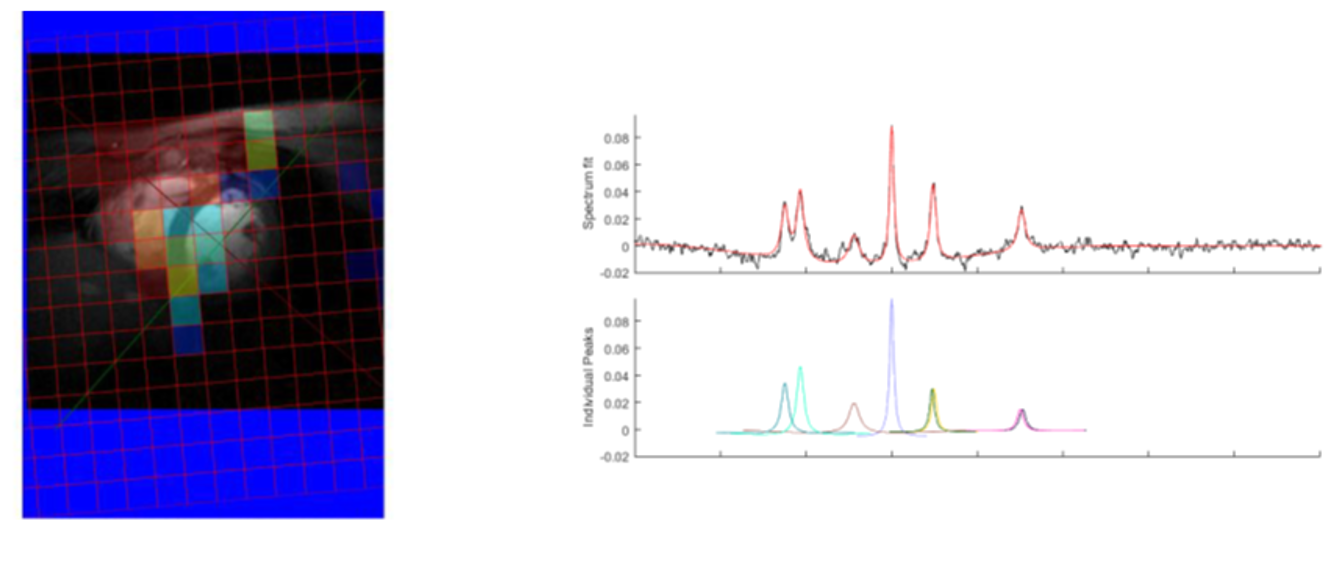
Figure 4 shows a fit result for a voxel in the myocardium with AMARES and an ATP absolute concentration map obtained with the Tesla DC dipole body array coil for the Terra MR system.
Figure 5 shows the same results but obtained in Oxford with the Rapid Biomedical 16-channel array coil.
An ATP concentration of 4.80 ± 1.06 mmol/kg wet weight was obtained in the heart using data acquired on either MR system. This is in good agreement with literature[9] and demonstrates good versatility of the proposed approach since two different systems were used. More direct comparison using the same volunteers will be performed once all 8 dipoles can be used for transmit simultaneously.
Conclusion
After adjusting the reference phantom conductivity based on EM simulations, we have demonstrated feasibility of the method originally proposed for absolute quantification of liver metabolites at 7T by Purvis et al. to provide concentration of cardiac energy metabolites, such as ATP. The demonstrated potential of method to be independent on the MR system of RF coil used could make it very attractive for widespread use, moving 7T cardiac 31P-MRS from evaluating PCr/ATP towards absolute concentrations.Acknowledgements
Jabrane Karkouri is funded by the European Union’s Horizon 2020 research and innovation programme under grant agreement No 801075.
Christopher T. Rodgers and Ladislav Valkovic are funded by a Sir Henry Dale Fellowship from the Wellcome Trust and the Royal Society [098436/Z/12/B].
This study was funded by the NIHR Cambridge Biomedical Research Centre and MRC Clinical Research Infrastructure Award for 7T.
Support of the Slovak Grant Agencies VEGA [2/0003/20] and APVV [19–0032] is also gratefully acknowledged. Stanislav Frištyk would like to acknowledge the support of the NSP of Slovakia.
References
[1] Hudsmith, Lucy E., and Stefan Neubauer. "Magnetic resonance spectroscopy in myocardial disease." JACC: Cardiovascular Imaging 2.1 (2009): 87-96.
[2] Rayner, Jennifer J., et al. "Myocardial energetics in obesity: enhanced ATP delivery through creatine kinase with blunted stress response." Circulation 141.14 (2020): 1152-1163.
[3] Levelt, Eylem, et al. "Ectopic and visceral fat deposition in lean and obese patients with type 2 diabetes." Journal of the American College of Cardiology 68.1 (2016): 53-63.
[4] Bottomley, Paul A., et al. "Metabolic rates of ATP transfer through creatine kinase (CK Flux) predict clinical heart failure events and death." Science translational medicine 5.215 (2013): 215re3-215re3.
[5] Rodgers, Christopher T., et al. "Human cardiac 31P magnetic resonance spectroscopy at 7 Tesla." Magnetic resonance in medicine 72.2 (2014): 304-315.
[6] Purvis LAB, Valkovič L, Robson MD, Rodgers CT. Feasibility of absolute quantification for 31 P MRS at 7 T. Magn Reson Med. 2019;82(1):49-61. doi:10.1002/mrm.27729
[7] Purvis LAB, Clarke WT, Biasiolli L, Valkovic L, Robson MD, Rodgers CT. OXSA: an open‐source magnetic resonance spectroscopy analysis toolbox in MATLAB. PLoS ONE. 2017;12:e0185356.
[8] Rodgers, Christopher T., and Matthew D. Robson. "Receive array magnetic resonance spectroscopy: whitened singular value decomposition (WSVD) gives optimal Bayesian solution." Magnetic Resonance in Medicine: An Official Journal of the International Society for Magnetic Resonance in Medicine 63.4 (2010): 881-891.
[9] Kemp, Graham J., Martin Meyerspeer, and Ewald Moser. "Absolute quantification of phosphorus metabolite concentrations in human muscle in vivo by 31P MRS: a quantitative review." NMR in Biomedicine: An International Journal Devoted to the Development and Application of Magnetic Resonance in Vivo 20.6 (2007): 555-565.
Figures