1227
Metabolic Responses of HeLa Cells upon addition of the Photosensitizer Chlorin e4 and Carriers in the Dark by 1H HR-MAS NMR1Department of Chemistry and Biochemistry, University Bern, Bern, Switzerland, 2Departments of BioMedical Research and Radiology, University Bern, Bern, Switzerland
Synopsis
Porphyrinic photosensitizers (PSs) like chlorin e4 (Ce4) are applied with polymer-based carriers for photodynamic therapy of cancer. However, the impact of PSs and their carriers on the metabolic state of cells in the dark-interval before light treatment are not clear. Here, HR-MAS NMR metabolomics was applied to cancer cells treated with Ce4 alone or combined with polyvinylpyrrolidone (PVP) or block-copolymer micelles (BCMs). A Ce4-concentration dependent metabolic response was observed that was clearly attenuated by BCMs and more pronounced by PVP indicating the beneficial role of the carriers. Direct interaction of Ce4 with glycero-phosphocholine was observed suggesting intracellular membrane localization.
INTRODUCTION
Porphyrinic photosensitizers (PSs) are used in photodynamic therapy (PDT) of cancer and non-cancerous diseases due to their cytotoxic properties that are only unfolded in combination with light and oxygen.1 Polymer-based nanoparticles (NPs) are mostly used as delivery systems for PSs since they enhance porphyrin solubility and bioavailability.2 Since both PS and NP are required to exhibit low dark toxicity, to avoid side effects, and to ensure a light-directed localized therapy, it is important to assess the in-vivo tolerability of both. Recently, it was shown that the PS chlorin e4 (Ce4) is well encapsulated into polyvinylpyrrolidone (PVP) and into block copolymer micelles (BCMs) formed by Kolliphor P188 (KP).3,4 However, little is known about the metabolic response of the cells towards the PSs and NPs.In this study we investigated how PVP and KP-micelles affect the metabolic response of cancer cells after incubation with Ce4 in the dark by using High Resolution Magic Angle Spinning (HR-MAS) NMR.
EXPERIMENTAL PROCEDURES
Cell culture – Human HeLa cervical cancer cells were cultured in modified DMEM culture medium. HeLa cells were incubated with culture media containing different concentrations of Ce4 and carrier (all in triplicates):(i) Ce4: concentrations of 10μM, 25μM, 62.5μM (3×3 samples)
(ii) Ce4-PVP: Same Ce4 concentrations plus 208.3μM PVP (3×3 samples)
(iii) Ce4-KP: Same Ce4 concentrations plus 3mM KP (3×3 samples)
(iv) only PVP (3 samples)
(v) only KP (3 samples)
(vi) control samples: Pure PBS only (2×3 samples)
resulting in 39 cell samples in total.
Preparation of cell samples – Cells were harvested and lysed by shock freezing. Frozen samples were stored at -80°C until measurement, then thawed, heated to inactivate enzymatic activity, and cell suspensions (~4*106cells) transferred to a 50μL MAS rotor. All preparation steps were performed in the dark.
NMR Spectroscopy – HR-MAS NMR was performed on a Bruker AVII 500MHz NMR-spectrometer at 5kHz spinning and 276K. The following spectra were recorded: (I) T2-edited 1H spectra using the 1D-PROJECT sequence with water pre-saturation (TE=400ms, 512 scans); (II) 1D-1H diffusion edited spectra (256 scans, 13.5G/cm gradient-strength, Δ=50ms, δ=6ms). To support resonance assignments, 2D 1H1H-TOCSY spectra were acquired on several samples.
Data Analysis - Standard spectral processing was performed using Topspin™. The 39 PROJECT 1H HR-MAS NMR spectra were subdivided into 259 individually sized buckets. Multivariate data analysis was performed applying probabilistic quotient normalization (PQN), mean centering and pareto scaling. The data were subdivided into 12 classes according to Ce4 concentration and carrier addition as well as control samples. PCA was performed to probe for sample clustering. Partial least squares discriminant analysis (PLS-DA) was used to calculate a model for distinguishing the x-data based on the assignment to 12 classes (y-data).
RESULTS
In Fig.1, the structures of Ce4 and the polymeric carriers PVP and KP are shown. While both efficiently encapsulate Ce4, BCMs were shown to have enhanced dynamics leading to faster drug release.4Unsupervised PCA was applied to all samples based on their projected 1H-HR-MAS NMR spectra (Fig.2A). Carrier-free samples shown in blue were well separated from the remaining ones. Inspection of the isolated subgroups (Fig.2B-D) revealed a Ce4-concentration dependent trend towards increasing negative PC-scores. KP samples were more distant from controls than PVP-samples.
Similar results were obtained from oPLS-analysis of the individual subgroups (Fig.3A-C). For each group (no carrier, KP, PVP), a Ce4-concentration dependent separation of samples along LV1 was observed with the highest concentration being most distant from Ce4-free samples. The corresponding loading plot (Fig.4A,B) revealed strong contributions of decreased choline, creatine and lactate levels and increased aspartate, citrate and fumarate levels in separating cells treated with high Ce4 concentration versus no/low Ce4 levels.
In 1D diffusion edited cell spectra a selective upfield shift of the GPC resonance was observed with increasing Ce4 concentration, while the choline and PC resonances remained unchanged. The effect was less pronounced in the presence of carriers in the order no-carrier>KP>PVP (Fig. 5A,B).
DISCUSSION
The presence of Ce4 in HeLa cells triggers already in the dark a concentration dependent response reflected in alterations of distinct metabolite levels. Due to the strong ring current effect of porphyrins it was possible to detect the direct intracellular molecular environment of Ce4, namely the choline containing head groups of GPC. The upfield shift of the GPC resonance correlated with Ce4 concentration and suggests Ce4 association with phospholipid membranes. This is in agreement with previous model studies on Ce6 derivatives with phospholipid vesicles suggesting cellular membranes as the preferential intracellular localization sites of porphyrinic PSs.5Both, the metabolic response as well as the GPC interaction were attenuated when Ce4 was applied in combination with KP and even more with PVP. This indicates (i) the protective role that the carriers play upon cell internalization, and (ii) that in agreement with our previous studies Ce4 seems to be faster released from KP than from PVP.
CONCLUSION
The current study underlines the benefitable effect of carriers following cell internalization. In addition to the known advantages they attenuate the metabolic response reducing potential toxic effects in the dark. Micelles promote intracellular redistribution of PSs to membranes whereas PVP may retain the PSs. The impact on PDT efficiency remains to be evaluated in further studies including light irradiation.Acknowledgements
No acknowledgement found.References
- Abrahamse, H.; Hamblin, M.-R. New photosensitizers for photodynamic therapy. Biochem. J. 2016, 473 (4), 347.
- Conte, C.; Maiolino, S.; Pellosi, D. S.; Miro, A.; Ungaro, F.; Quaglia, F., Polymeric Nanoparticles for Cancer Photodynamic Therapy. In Light-Responsive Nanostructured Systems for Applications in Nanomedicine, Sortino, S., Ed. Springer International Publishing: Cham, 2016; pp 61-112.
- Gjuroski, I.; Furrer, J.; Vermathen, M., How Does the Encapsulation of Porphyrinic Photosensitizers into Polymer Matrices Affect Their Self-Association and Dynamic Properties? ChemPhysChem 2018, 19 (9), 1089-1102.
- Gjuroski, I.; Girousi, E.; Meyer, C.; Hertig, D.; Stojkov, D.; Fux, M.; Schnidrig, N.; Bucher, J.; Pfister, S.; Sauser, L.; Simon, H.-U.; Vermathen, P.; Furrer, J.; Vermathen, M., Evaluation of polyvinylpyrrolidone and block copolymer micelle encapsulation of serine chlorin e6 and chlorin e4 on their reactivity towards albumin and transferrin and their cell uptake. Journal of Controlled Release 2019, 316, 150-167.
- Vermathen, M., Marzorati, M., Vermathen, P., Bigler, P. pH-Dependent Distribution of Chlorin e6 Derivatives across Phospholipid Bilayers Probed by NMR Spectroscopy. Langmuir 2010, 26, 13, 11085–1109
Figures
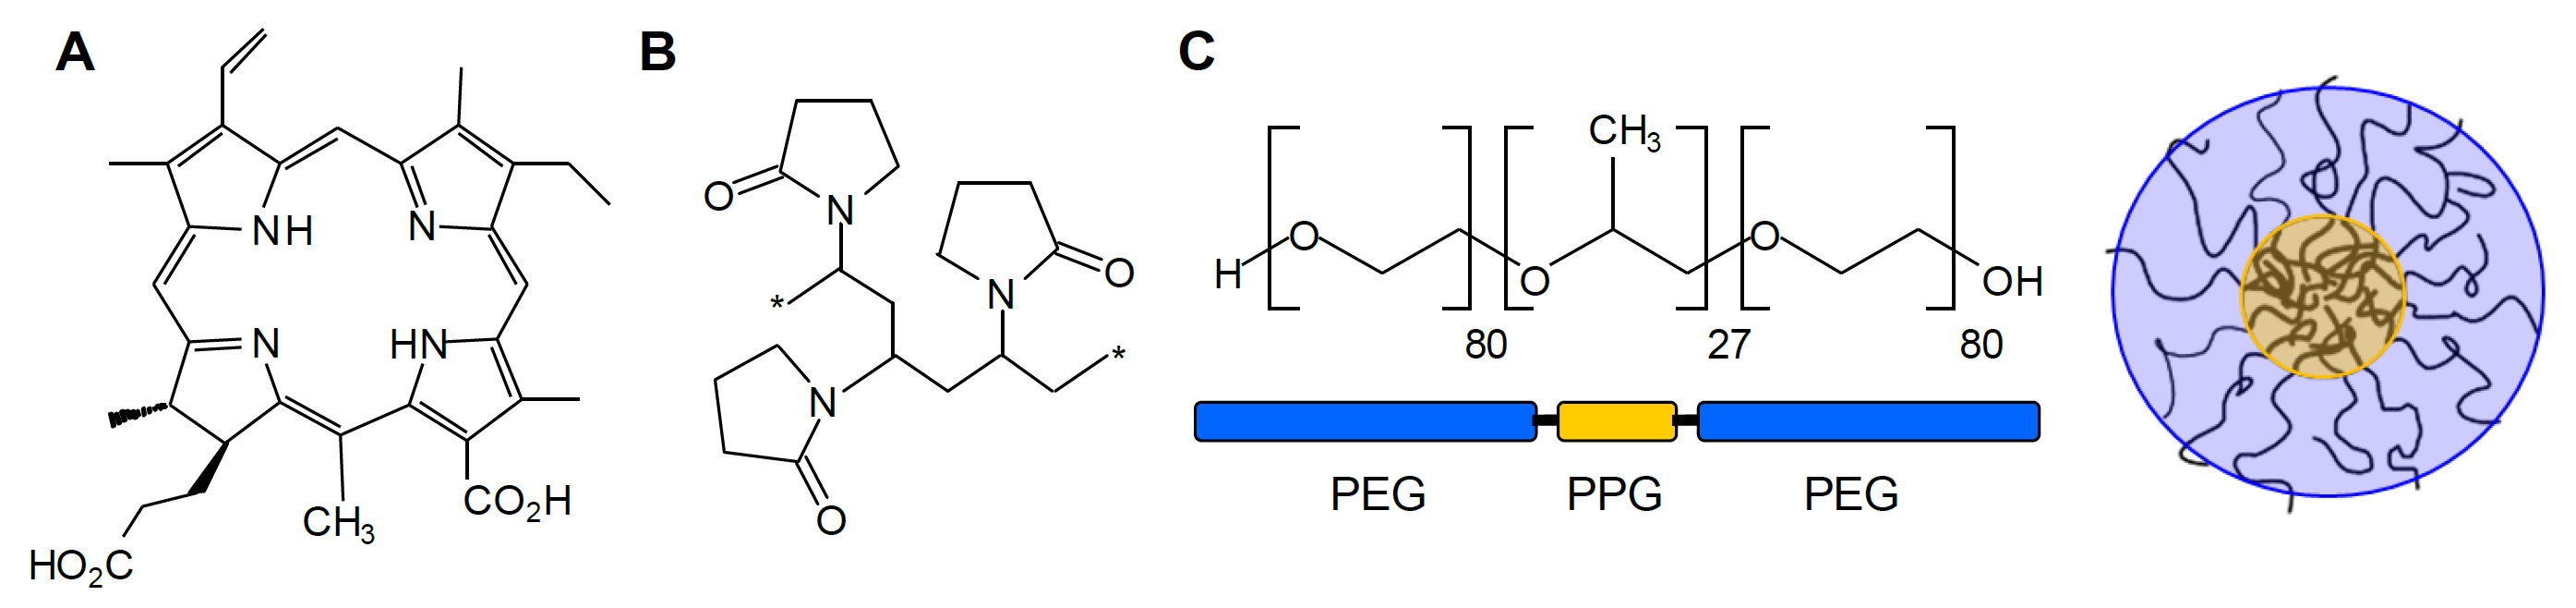
FIGURE 1
Structure of the photosensitizer chlorin e4 (Ce4) (A), building block of the polymeric network formed by polyvinylpyrrolidone (PVP) (B), PEG-PPG-PEG triblock copolymer Kolliphor P 188 (KP) and sketch of a KP-micelle (C). The carriers are distinguished by their structures with PVP forming a macromolecular network and KP forming BCMs.
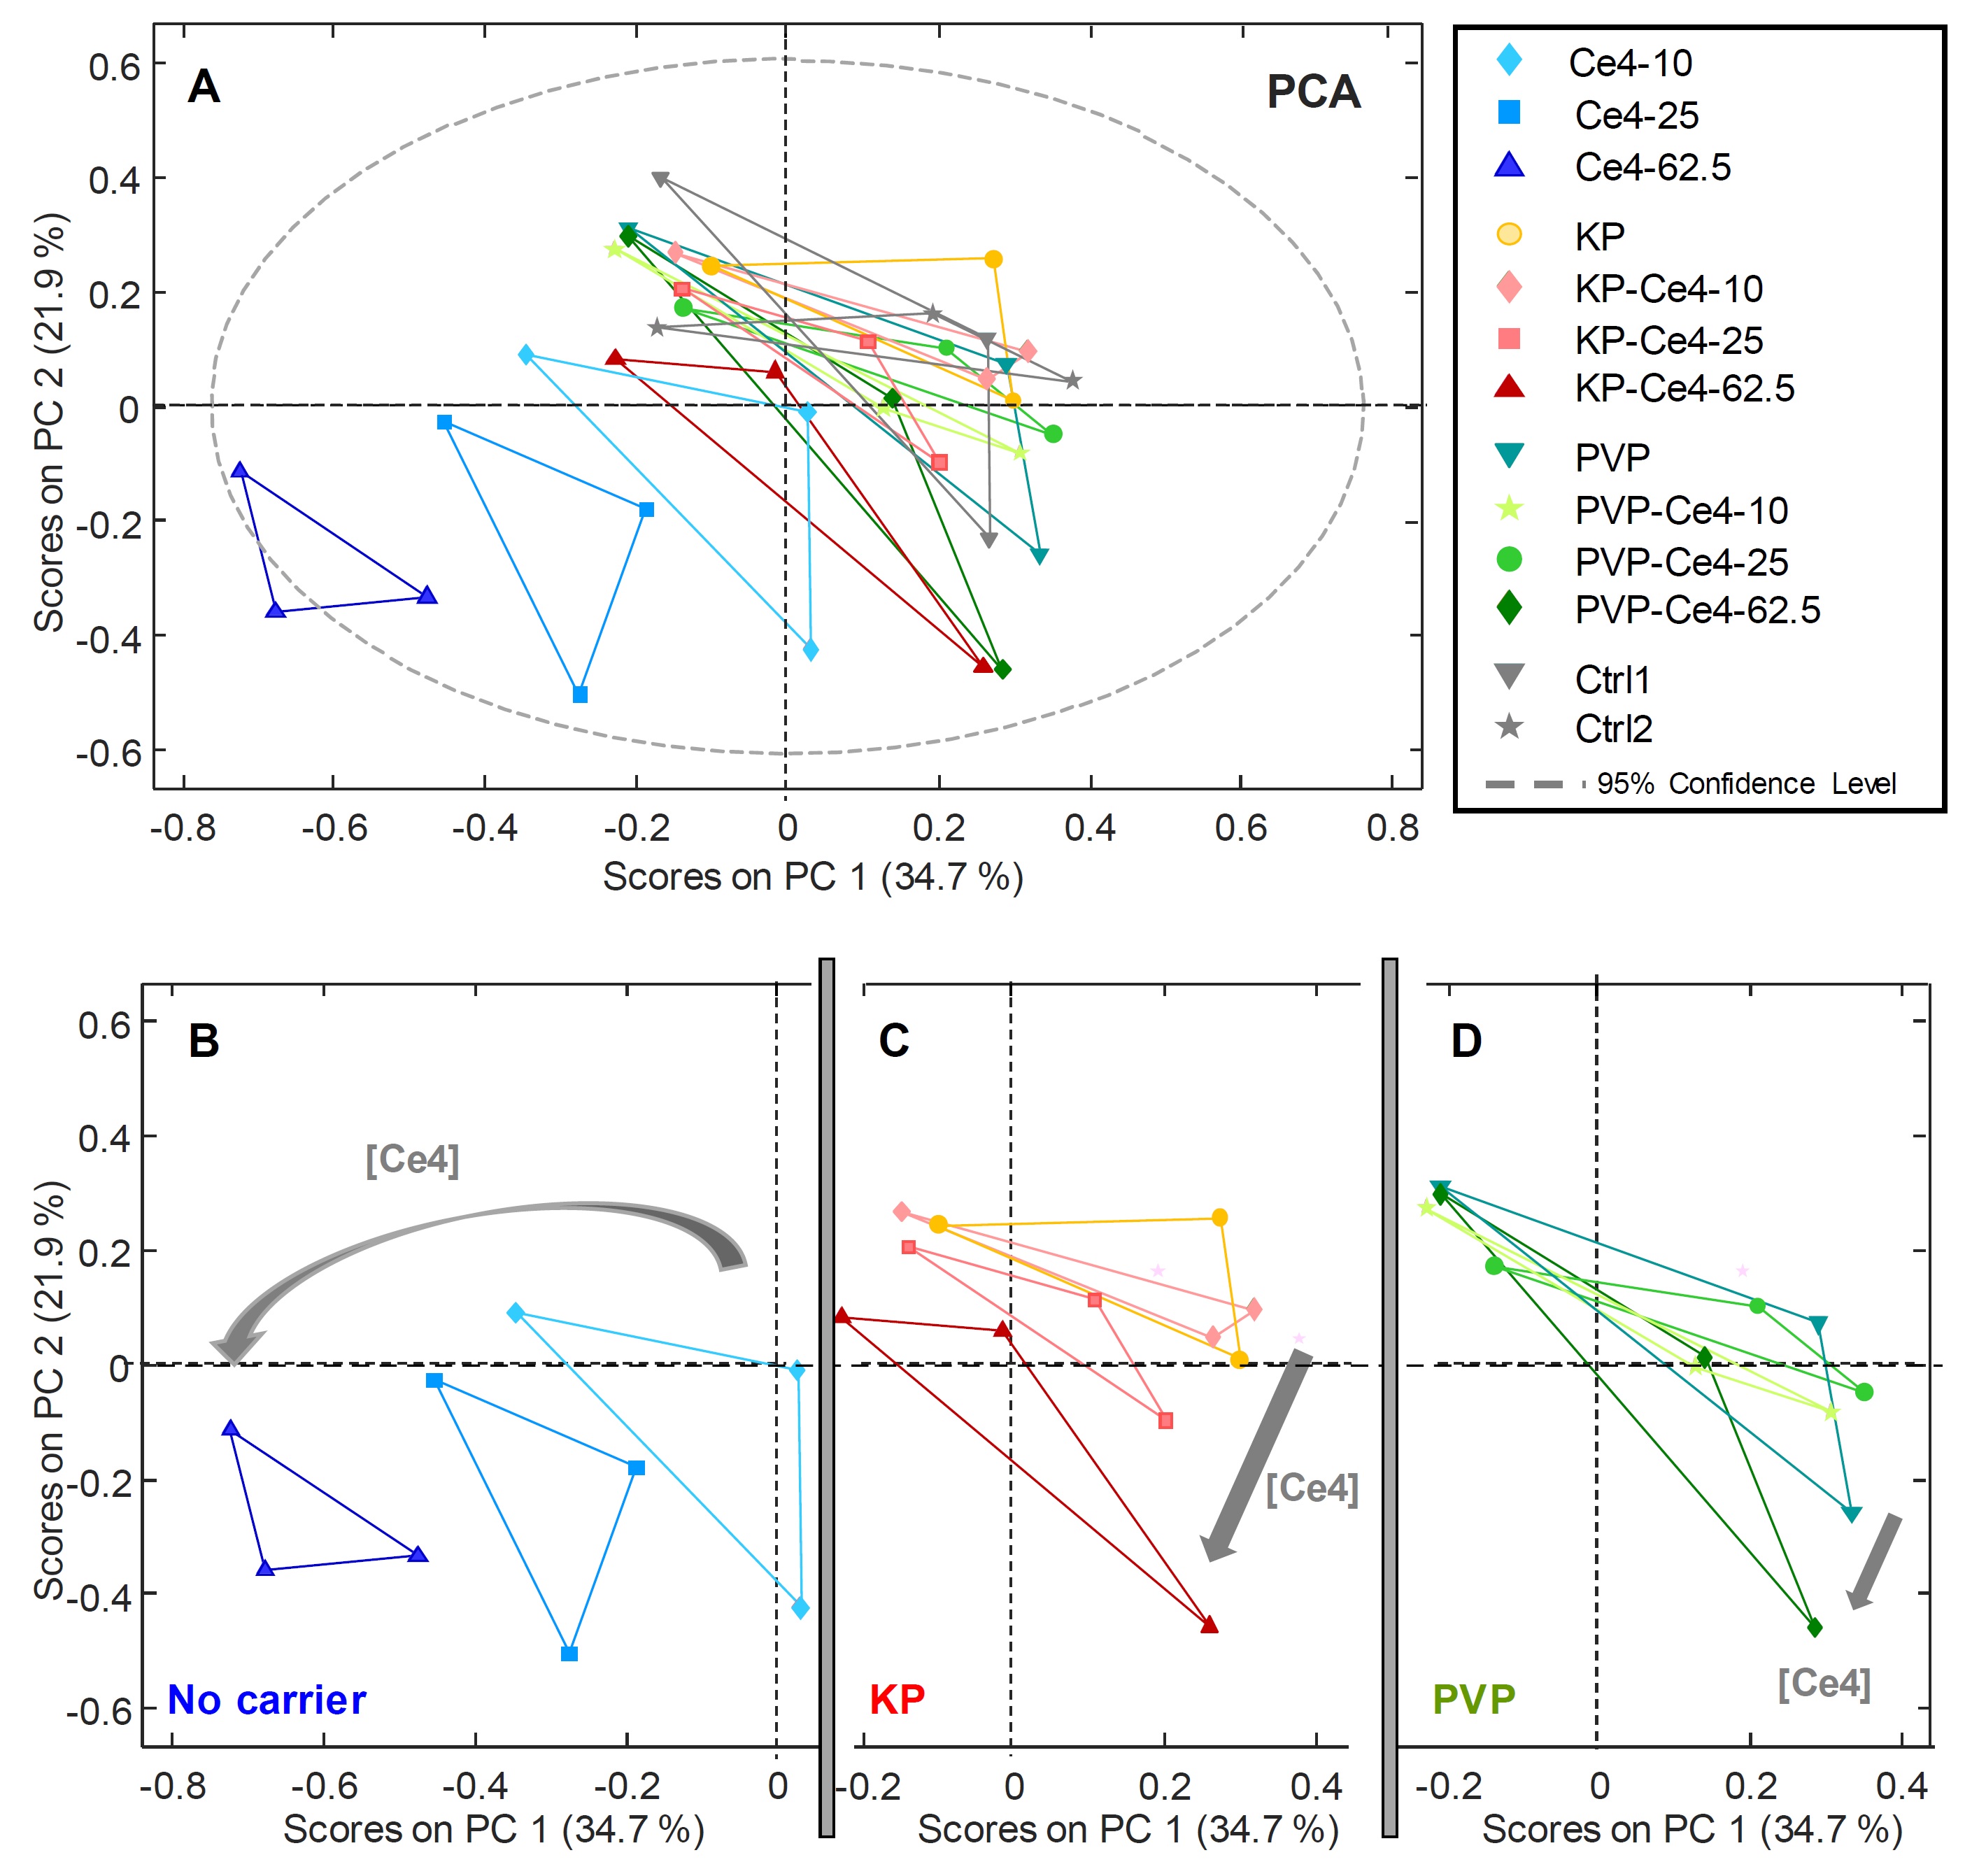
FIGURE 2
PCA applied to all samples and buckets from 1D projected spectra (259 x 39) (A). Excerpts from the PCA plot in (A) for better visibility of the subclasses, i.e. samples without carriers (B), samples with KP as carrier (C) and samples with PVP as carrier (D).
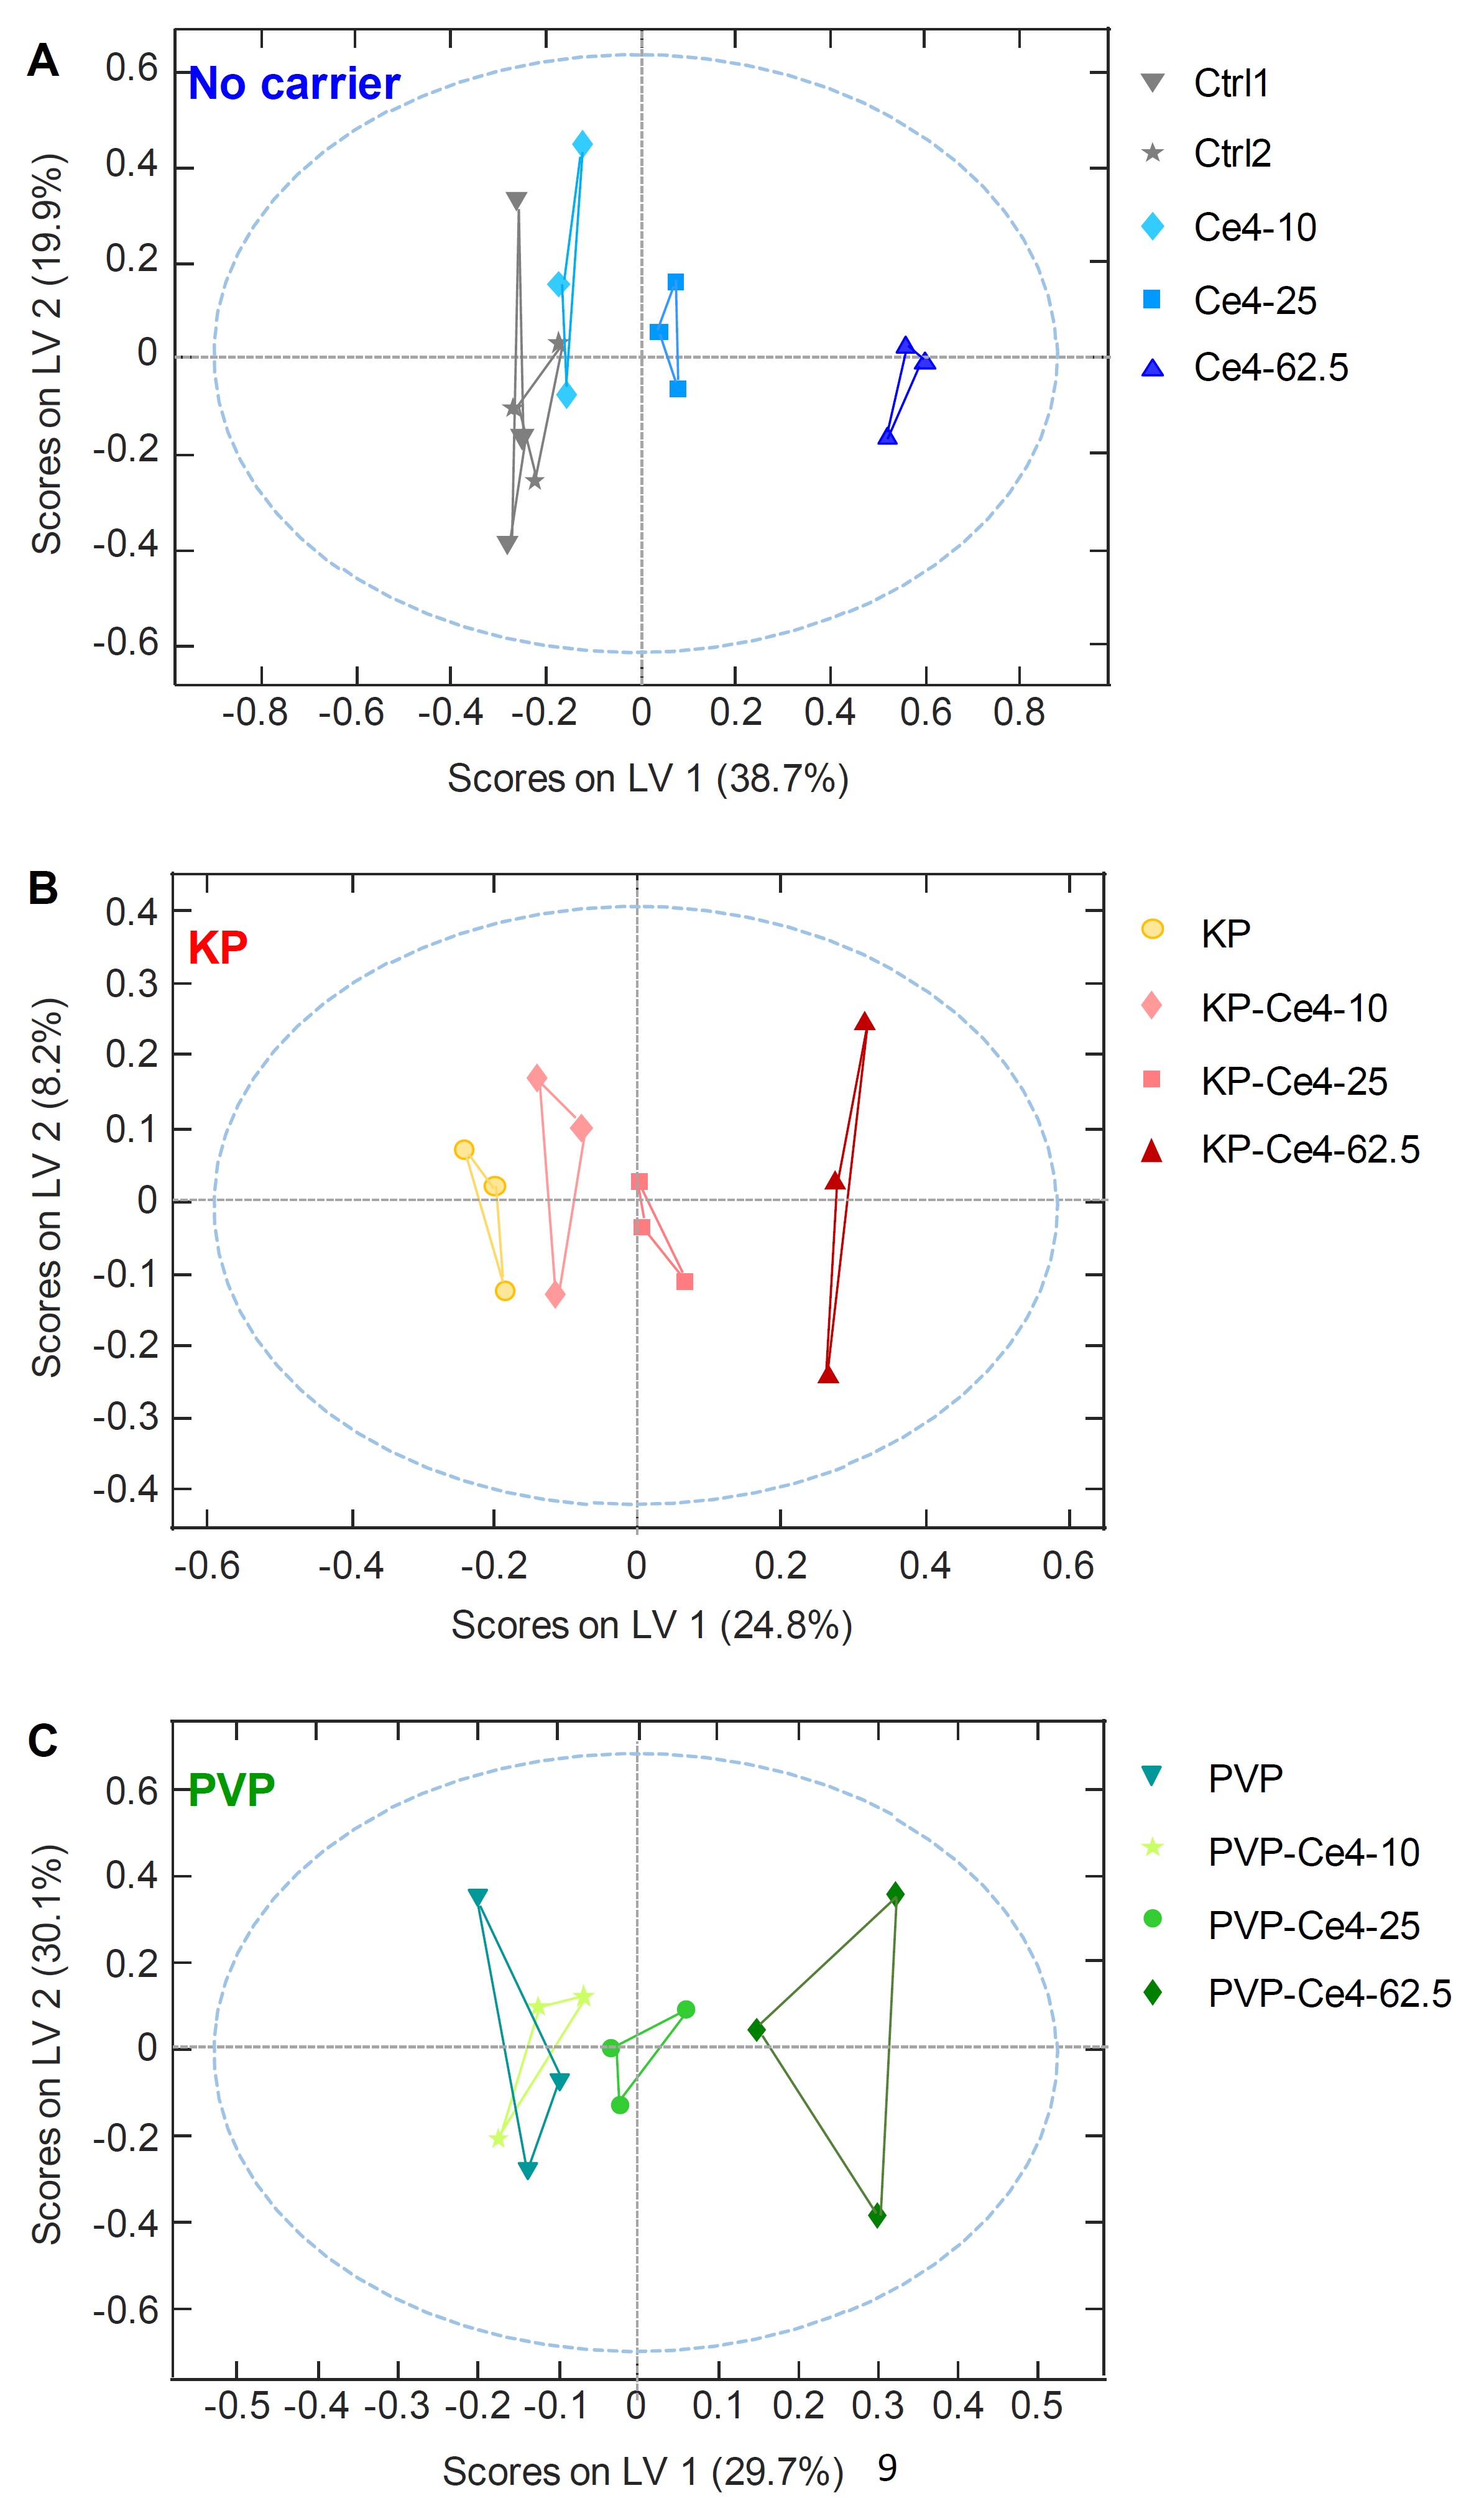
FIGURE 3
o-PLS applied to samples and buckets from 1D PROJECT spectra as x-matrix and Ce4 concentration (0, 10, 25, 62.5 μM) as y-matrix according to the subclasses of samples without carriers (A), samples with KP as carrier (B) and samples with PVP as carrier (C). The blue dashed line includes samples falling into the range of 95% confidence level.
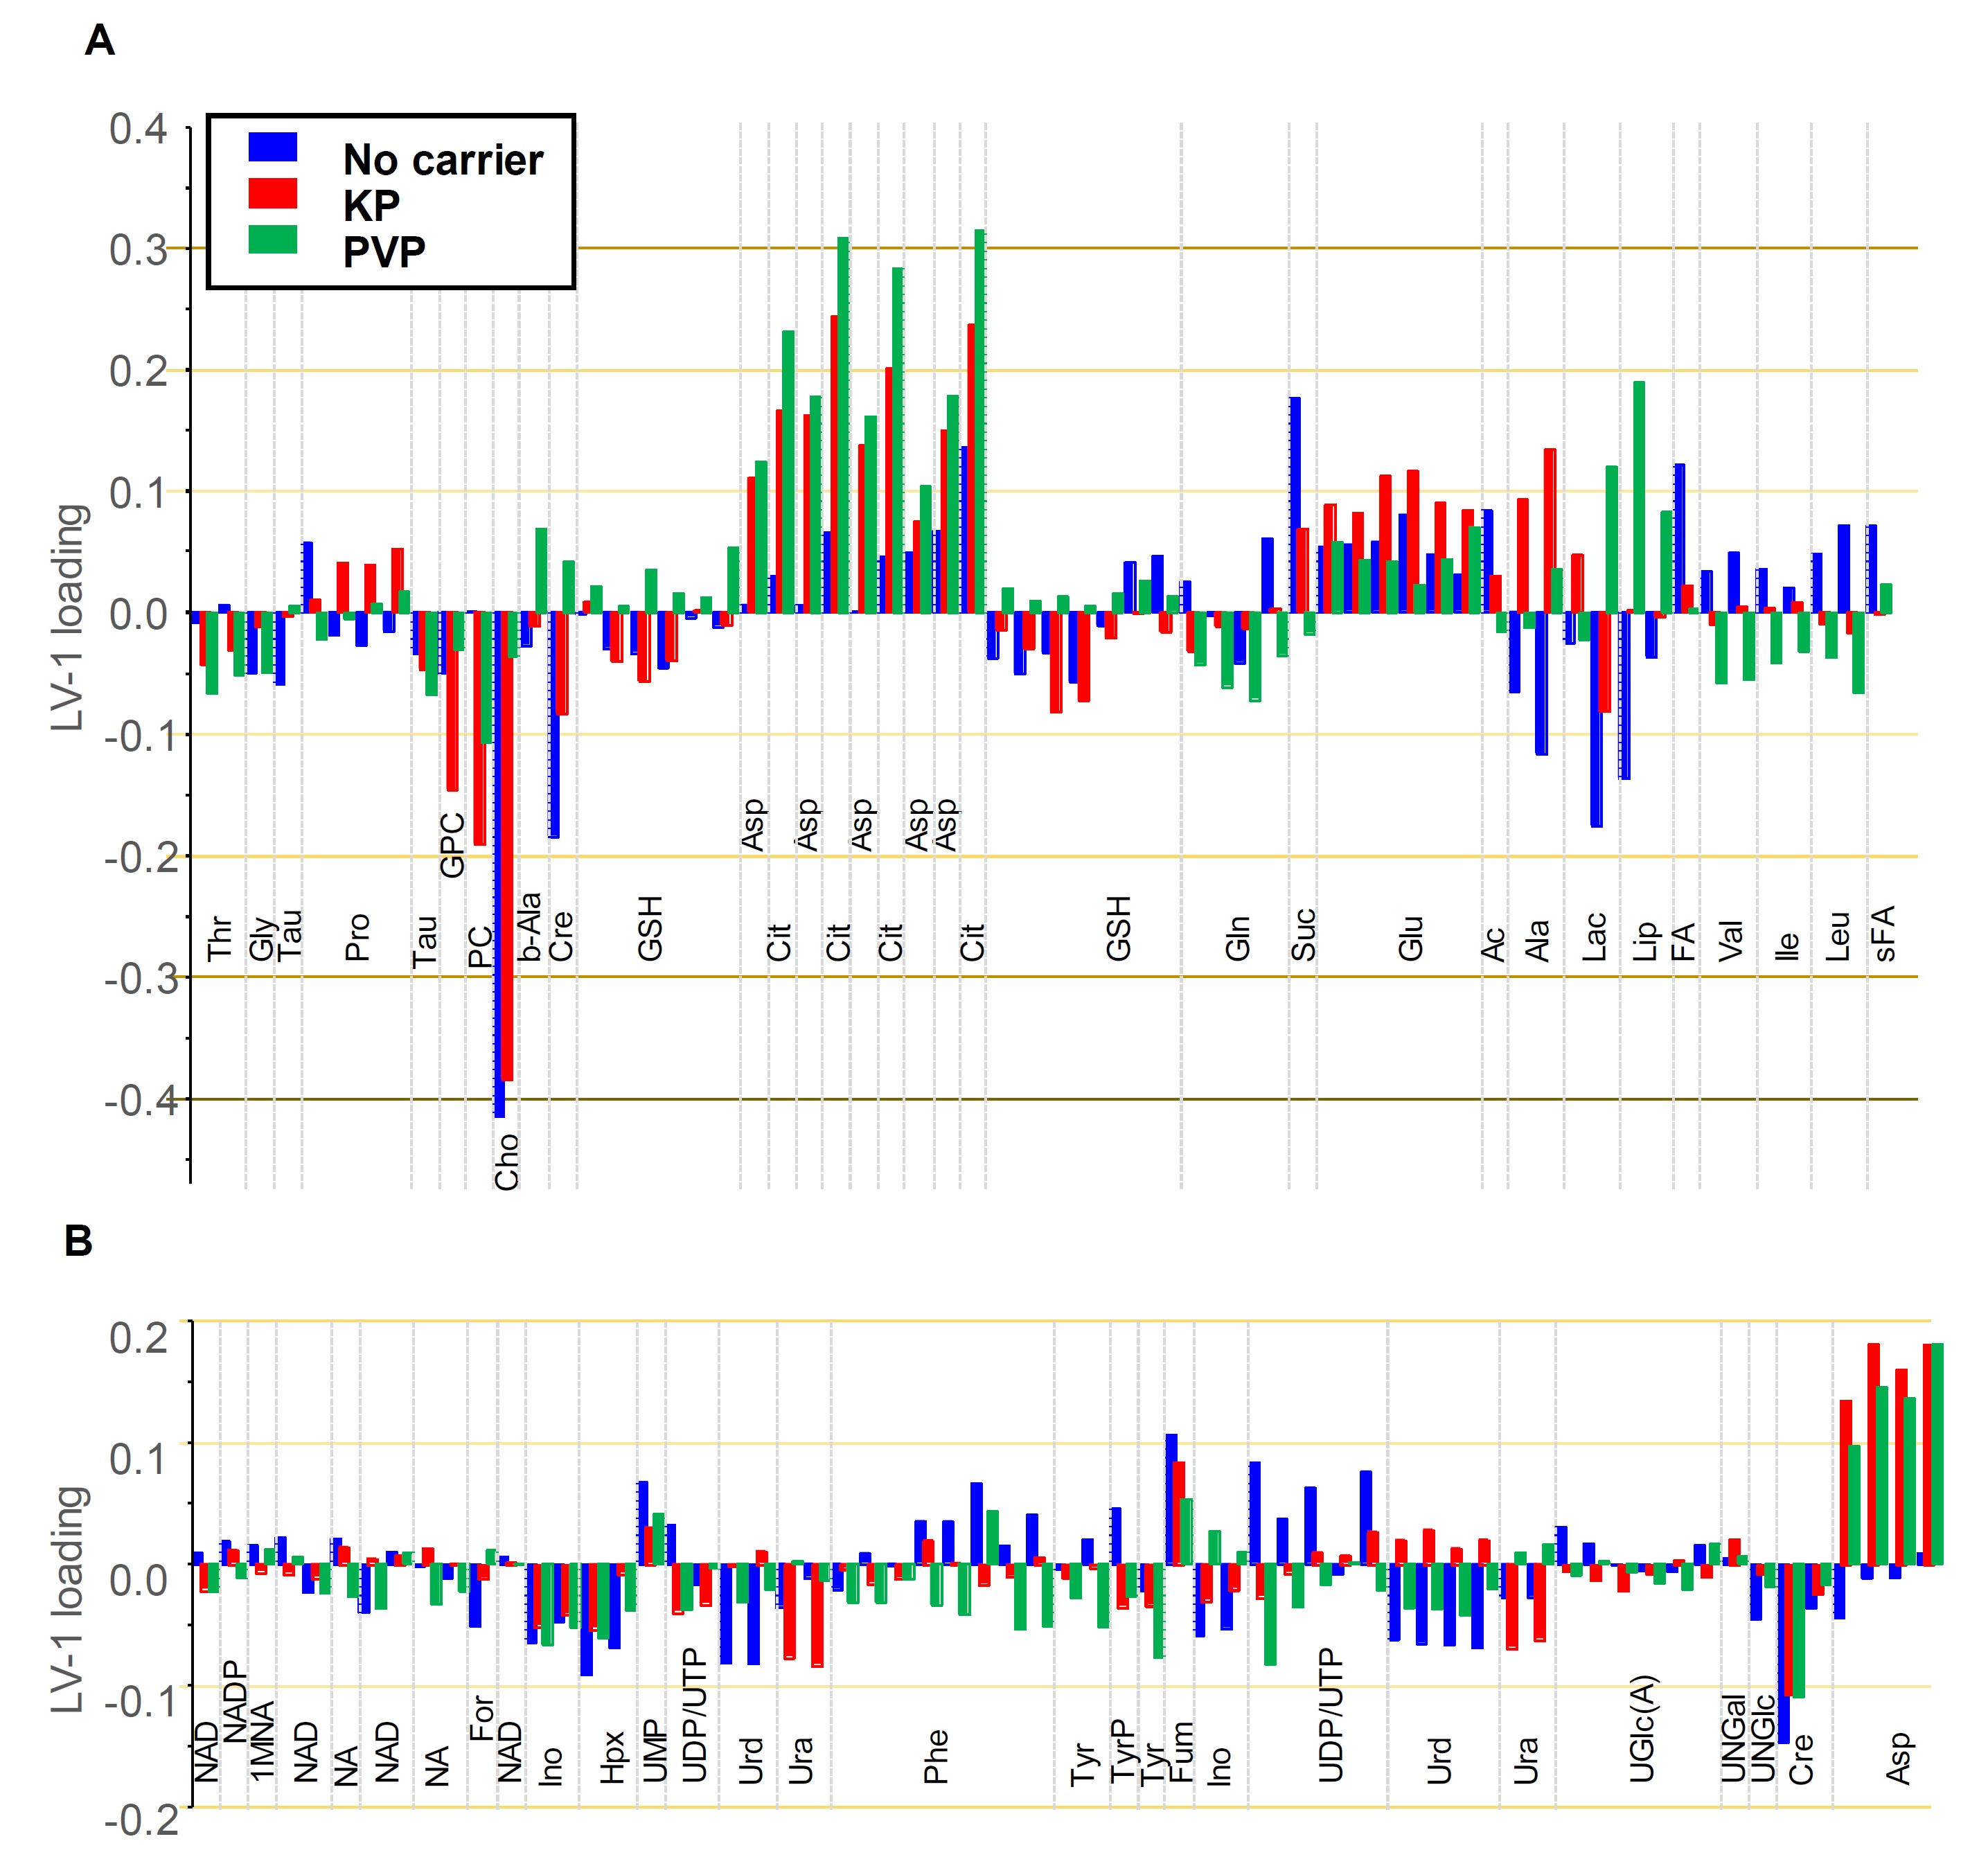
FIGURE 4
Loadings of the first o-PLS components (LV-1) according to the oPLS-score plots shown in Fig. 3 for carrier-free samples (blue), KP-samples (red), and PVP-samples (green). Loadings are shown for buckets that were assigned to metabolites and that had little overlap. Horizontal arbitrary lines mark metabolites with respect to their contribution with load-values above 0.1, 0.2, 0.3 and 0.4. (A) 3.6-0.8 ppm region (B) 9.4-3.6 ppm region.
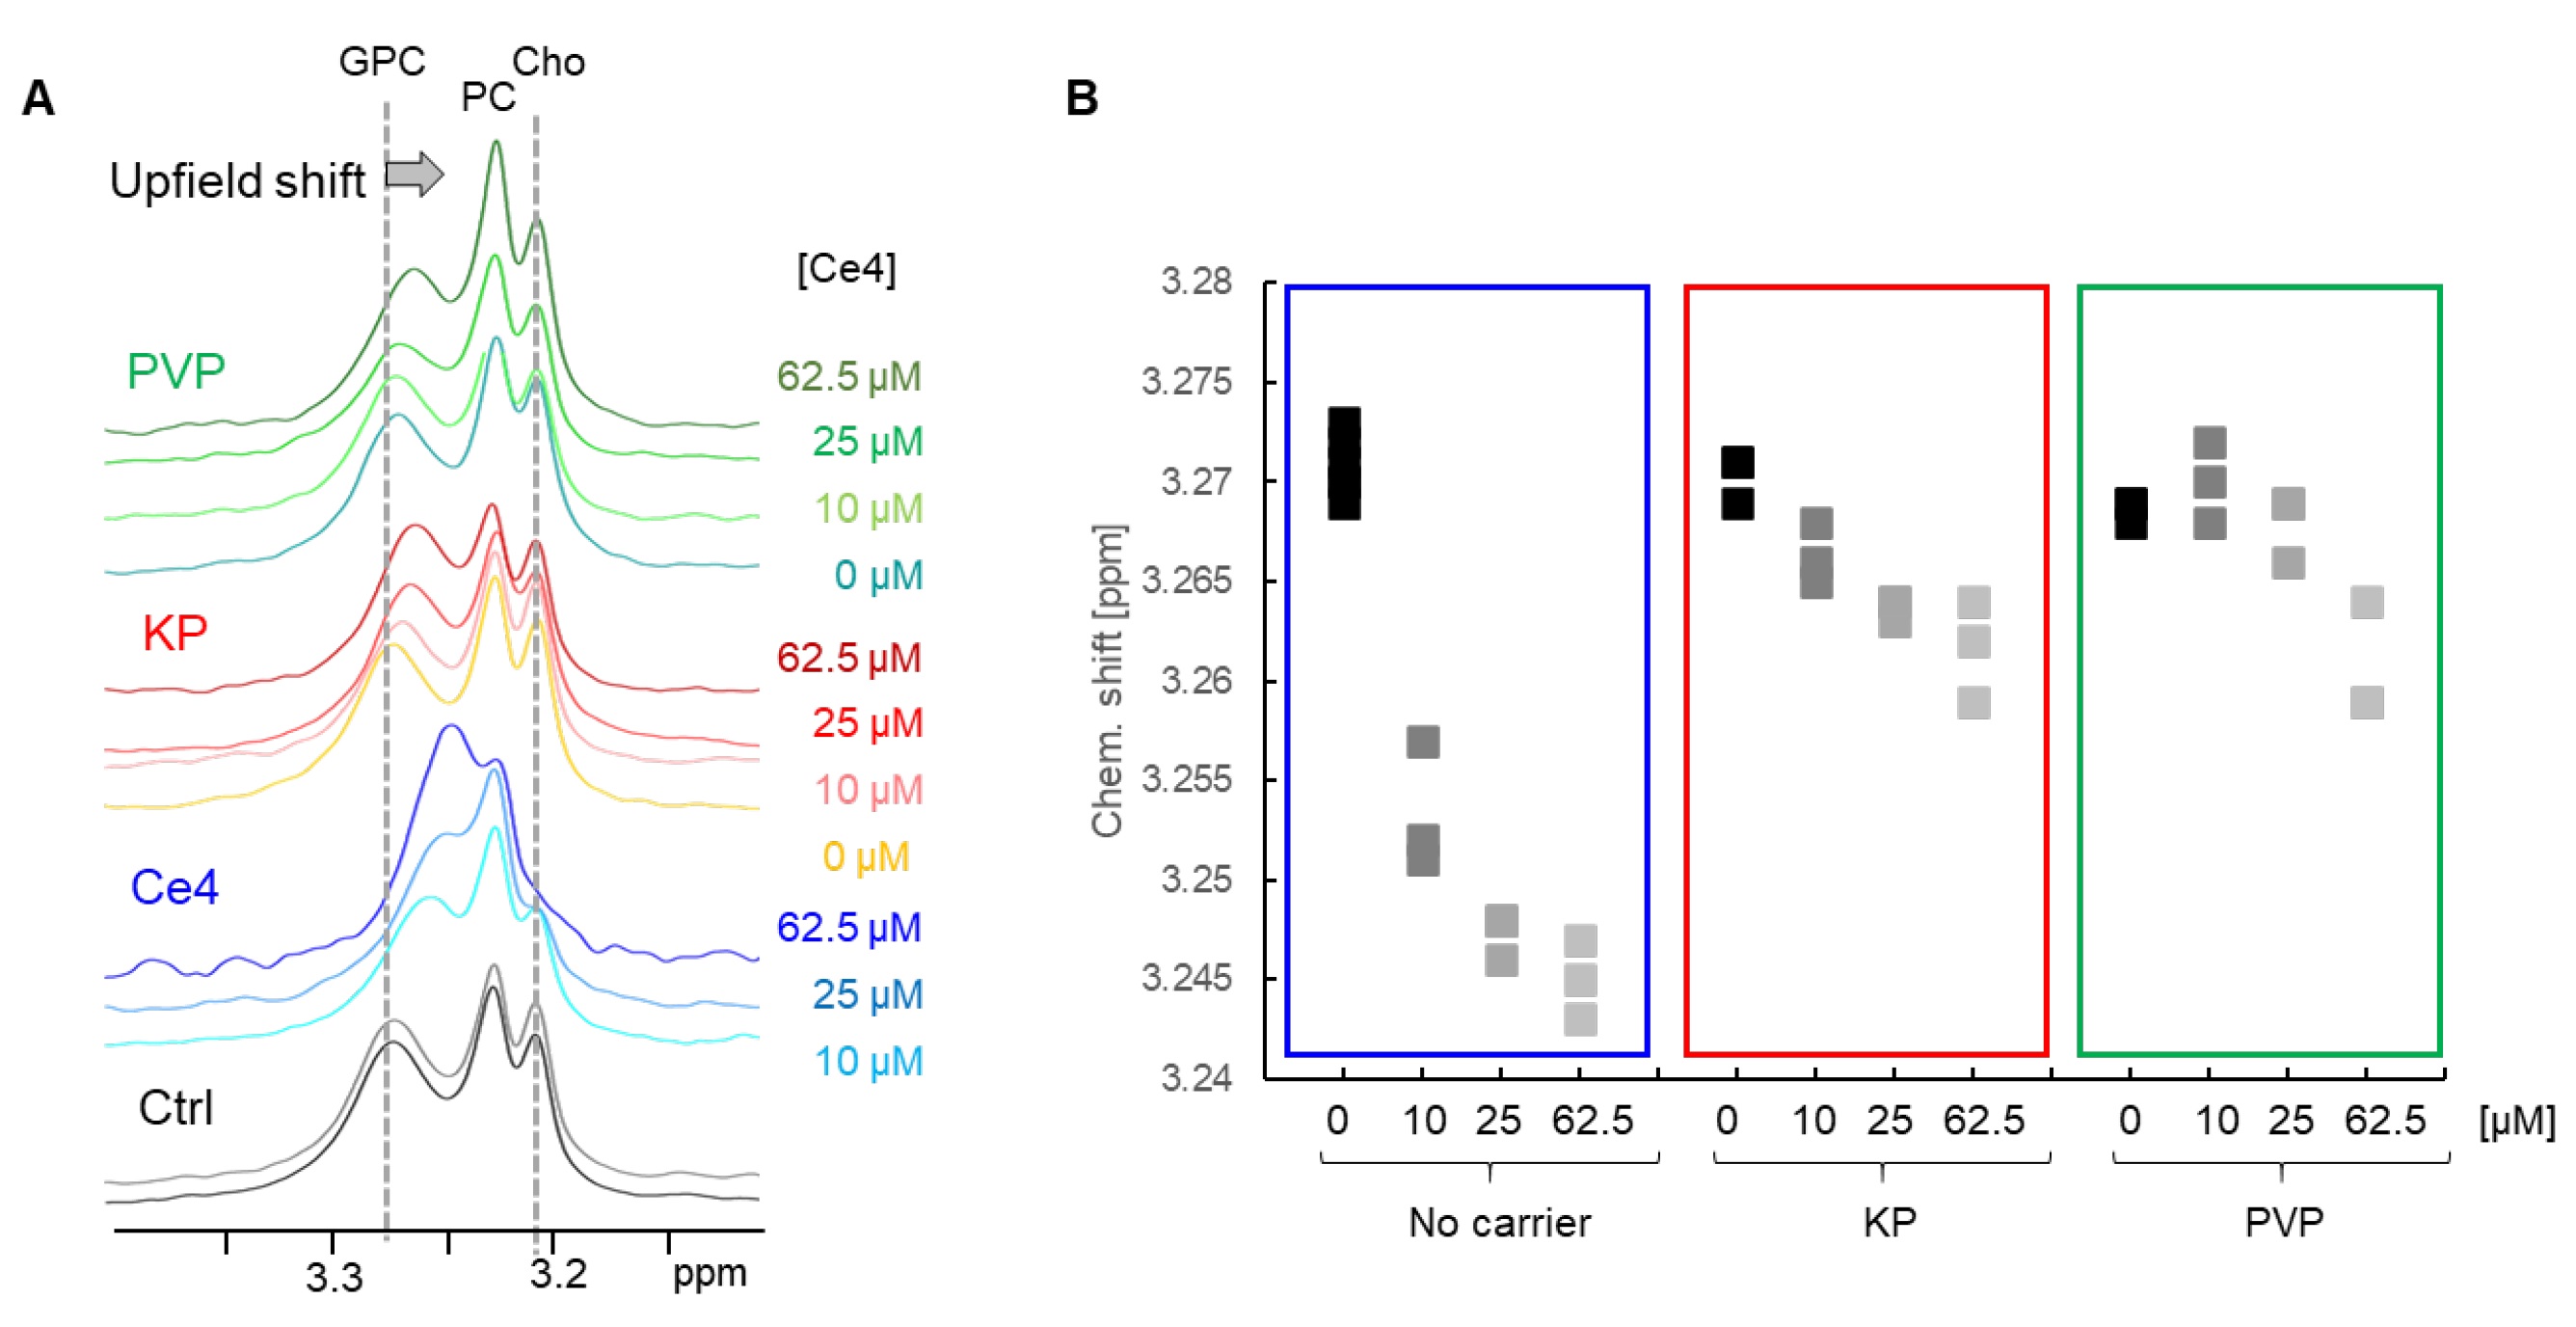
FIGURE 5
(A) HR-MAS 1H-diffusion-edited NMR spectra (1D-DOSY) of lysed HeLa cell suspensions in PBS incubated with different concentrations of Ce4 without carrier or encapsulated into KP or PVP. Shown is the spectral region where the choline containing resonances appear. The GPC resonance exhibits upfield shifts;
(B) Chemical shift of the GPC-choline resonance as function of condition (Ce4 concentration and carrier)