1226
Vcan mutation leads to sex-specific changes in white matter microstructure in mice1Wellcome Centre for Integrative Neuroimaging, FMRIB, Nuffield Department of Clinical Neurosciences, University of Oxford, Oxford, United Kingdom, 2British Heart Foundation Centre of Research Excellence, King's College London, London, United Kingdom, 3Mouse Imaging Centre, Hospital for Sick Children, Toronto, ON, Canada, 4Department of Medical Biophysics, University of Toronto, Toronto, ON, Canada
Synopsis
Recent genome-wide association studies using UK Biobank datasets have shown associations between diffusion-weighted MRI (dMRI) phenotypes and genetic loci associated with the human VCAN gene, spanning most white matter tracts. To understand the biological cause of this association, we acquired ex vivo structural and dMRI data in a Vcan mouse model and evaluated whether it displays similar changes in white matter microstructure. We show that male Vcan mice display related dMRI phenotypes to those associated with mutations in VCAN in humans. This gives us the ability to investigate the biological interpretations of human GWAS results using histology.
Introduction
Recent genome-wide association studies (GWAS)1 using UK Biobank (UKB) brain imaging2 datasets identified associations between numerous image-derived phenotypes and subjects’ genotypes (specifically, single nucleotide polymorphisms). While useful for discovering such associations, GWAS cannot directly provide evidence for what aspect of tissue drives these relationships3. A potentially powerful approach to pinpoint the biological cause of these associations is to scan rodents with modifications to the same gene4, followed by comparisons with histology. This relies on the hypothesis that these mutations can causally induce phenotypic changes prevalent across both species.A large number of GWAS associations were found between diffusion-weighted MRI (dMRI) and genetic loci associated with the VCAN gene1. These associations were particularly strong for the estimated intra-cellular volume fraction (ICVF) across much of the cerebral white matter, as well as fractional anisotropy (FA) and mean diffusivity (MD) in some white matter tracts. The VCAN protein versican is an important extracellular matrix protein found around neuronal soma, dendrites and ubiquitously at the nodes of Ranvier5. Here, we acquire ex vivo structural and dMRI data in a Vcan mouse model with a point mutation at position E441A, which impairs protein cleavage.
Methods
14 homozygous (HOM) Vcan C57BL6 mice (7M:7F) and 14 wild-type (WT) (7M:7F) were studied. Mice (10-12 weeks old) were anaesthetised (ketamine/xylazine), intracardially perfused with a flush of saline solution, followed by formalin 4%, both containing 2mM Gd-based contrast agent (GDCA) (ProHance). Heads were removed from the body and dissected (keeping brains in skull), immersed in formalin and GDCA overnight, and refrigerated in a solution of phosphate-buffered saline, GDCA and azide 0.02%.Data was acquired on a Bruker 7T scanner (BioSpec 70/20 USR). dMRI parameters: spin-echo, segmented EPI, 12 segments, TE/TR=30/500ms, δ/Δ=6.7/13.5ms, b=0 s/mm2 (four volumes; one with phase-encoding reversed), b=2,500 and 10,000 s/mm2 (30 directions/shell), resolution=100x100x100µm. T2-weighted (T2w) structural parameters: TurboRARE, TEeff/TR=12/350ms, echo spacing=12ms, 6 echoes, resolution=60x60x60µm, acquisition time=33min. Samples were immersed in Fluorinert, scanned in custom holders, vacuum pumped at least a day in advance to eliminate intracranial bubbles, then left at room temperature until scanning.
Figure 1 illustrates the dMRI pipeline, resulting in the dMRI parametric maps. An average of the four b=0 s/mm2 images (after Gibbs6- and eddy-correction7,8) was fed into an iterative group-wise registration9 and atlas-based segmentation10 pipeline.
Atlas-based regions-of-interest (ROIs) within individual WM tracts were selected within each hemisphere and multiplied by a WM skeleton11 (Figure 2A). We calculated median values within these ROIs for FA, MD, orientation dispersion index (OD) and ICVF. We performed a first-pass GLM analysis to identify if there are significant effects of genotype, sex and sex-by-genotype interaction on median FA, MD, ICVF and orientation dispersion index (OD), grouping together all selected tracts. Unpaired two-sample, two-tailed t-tests were performed to compare median FA, OD and ICVF (metrics where we observed significant effects of sex and sex-genotype interaction in the above GLM analysis) between HOMs and WTs, across individual tracts, pooling together results across hemispheres, separately for male and female mice.
The T2w structural datasets were Gibbs-corrected6, registered together9, followed by atlas-based segmentation10. This data was used to assess volumetric differences between HOMs and WTs using the logarithm of the Jacobian matrix determinant for each transformation between the T2w images and the common space. A linear model was used to relate volumes of labelled brain structures (via atlas-based segmentation), as a function of genotype and sex.
Results and Discussion
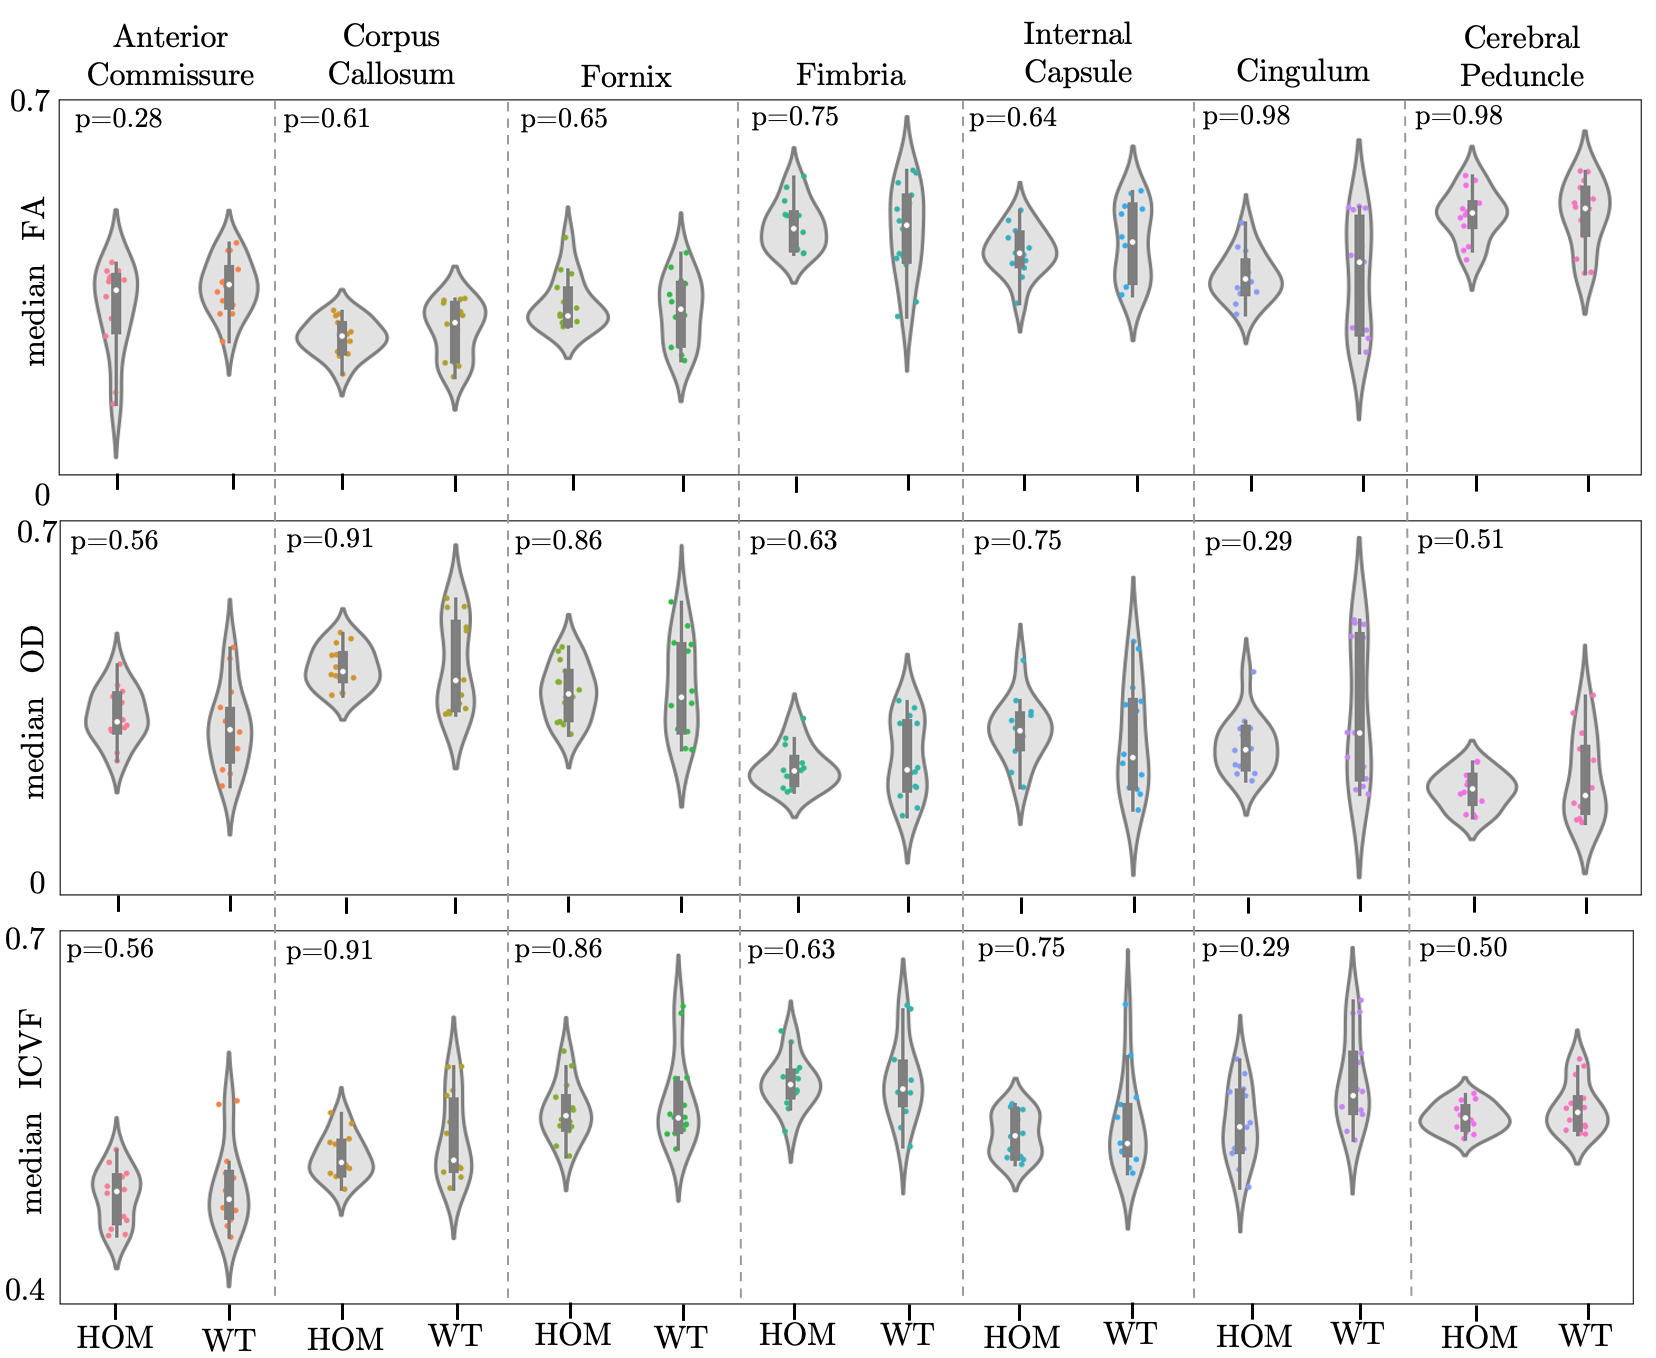
GLM results are summarised in Table 1. We found significant differences between HOMs and WTs across FA and OD parametric maps, in males, but not in females (Figures 3, 4). 6/7 WM tracts revealed significant differences (p-value≤0.05, FDR-corrected, 5%) across FA, with generally lower median FA values observed in WTs (Figures 2B, 3). Consistent with FA results, OD showed inverted trends to FA, one tract revealing significant differences (p≤0.05, FDR-corrected, 5%). While significance was not reached, ICVF displayed higher values for some tracts in WTs compared to HOMs, in both males and females (similarly to trends in humans1).The volumetric analysis revealed no significant differences between HOMs/WTs. A small number of gray matter areas (e.g. the bed nucleus of the stria terminalis, olfactory bulb subdivisions), showed sex-specific volume differences. WM tracts not reaching significance in this analysis suggests that the differences highlighted above are a consequence of microstructural variations and not partial volume effects.
The lack of significant results in female mice needs further investigation, but is potentially attributed to sex-specific differences in brain microstructure and development. More samples may be needed to reach significance.
Conclusions
While instrumental in their ability to uncover associations between genotypes and phenotypes, GWAS do not reveal mediating factors leading to these associations. Rodent models facilitate the causal manipulation of most genes and the examination of tissue microstructure using histology, currently not possible in humans.Comparing male Vcan HOM and WT mice, we find significant differences across FA and OD within most principal white matter tracts. This shows that mutations in Vcan causally induce changes in the white matter microenvironment. Future histological analysis will identify which specific aspects of the microstructure are altered in these mice, with the aim of understanding the biological mechanisms underlying GWAS findings in humans.
Acknowledgements
Aurea Martins-Bach and Karla Miller contributed equally to this work. This work was supported by the Wellcome Trust (grant 202788/Z/16/Z), the Engineering and Physical Sciences Research Council and Medical Research Council (grant EP/L016052/1). The Wellcome Centre for Integrative Neuroimaging is supported by core funding from the Wellcome Trust (203139/Z/16/Z).References
1. Elliott, L. T. et al. Genome-wide association studies of brain imaging phenotypes in UK Biobank. Nature 562, 210 (2018).
2. Miller, K. L. et al. Multimodal population brain imaging in the UK Biobank prospective epidemiological study. Nat. Neurosci. (2016) doi:10.1038/nn.4393.
3. Tam, V. et al. Benefits and limitations of genome-wide association studies. Nature Reviews Genetics (2019) doi:10.1038/s41576-019-0127-1.
4. Mague, S. D. et al. Mouse model of OPRM1 (A118G) polymorphism has sex-specific effects on drug-mediated behavior. Proc. Natl. Acad. Sci. U. S. A. (2009) doi:10.1073/pnas.0901800106.
5. Fawcett, J. W., Oohashi, T. & Pizzorusso, T. The roles of perineuronal nets and the perinodal extracellular matrix in neuronal function. Nature Reviews Neuroscience (2019) doi:10.1038/s41583-019-0196-3.
6. Kellner, E., Dhital, B., Kiselev, V. G. & Reisert, M. Gibbs-ringing artifact removal based on local subvoxel-shifts.Magn. Reson. Med. (2016) doi:10.1002/mrm.26054.
7. Andersson, J. L. R., Skare, S. & Ashburner, J. How to correct susceptibility distortions in spin-echo echo-planar images: Application to diffusion tensor imaging. Neuroimage (2003) doi:10.1016/S1053-8119(03)00336-7.
8. Andersson, J. L. R. & Sotiropoulos, S. N. An integrated approach to correction for off-resonance effects and subject movement in diffusion MR imaging. Neuroimage (2016) doi:10.1016/j.neuroimage.2015.10.019.
9. Friedel, M., van Eede, M. C., Pipitone, J., Mallar Chakravarty, M. & Lerch, J. P. Pydpiper: A flexible toolkit for constructing novel registration pipelines. Front. Neuroinform. (2014) doi:10.3389/fninf.2014.00067.
10. Chakravarty, M. M. et al. Performing label-fusion-based segmentation using multiple automatically generated templates. Hum. Brain Mapp. (2013) doi:10.1002/hbm.22092.
11. Smith, S. M. et al. Tract-based spatial statistics: Voxelwise analysis of multi-subject diffusion data. Neuroimage(2006) doi:10.1016/j.neuroimage.2006.02.024.
12. Zhang, H., Schneider, T., Wheeler-Kingshott, C. A. & Alexander, D. C. NODDI: Practical in vivo neurite orientation dispersion and density imaging of the human brain. Neuroimage (2012) doi:10.1016/j.neuroimage.2012.03.072.
13. Hernandez-Fernandez, M. et al. Using GPUs to accelerate computational diffusion MRI: From microstructure estimation to tractography and connectomes. Neuroimage (2019) doi:10.1016/j.neuroimage.2018.12.015.
Figures
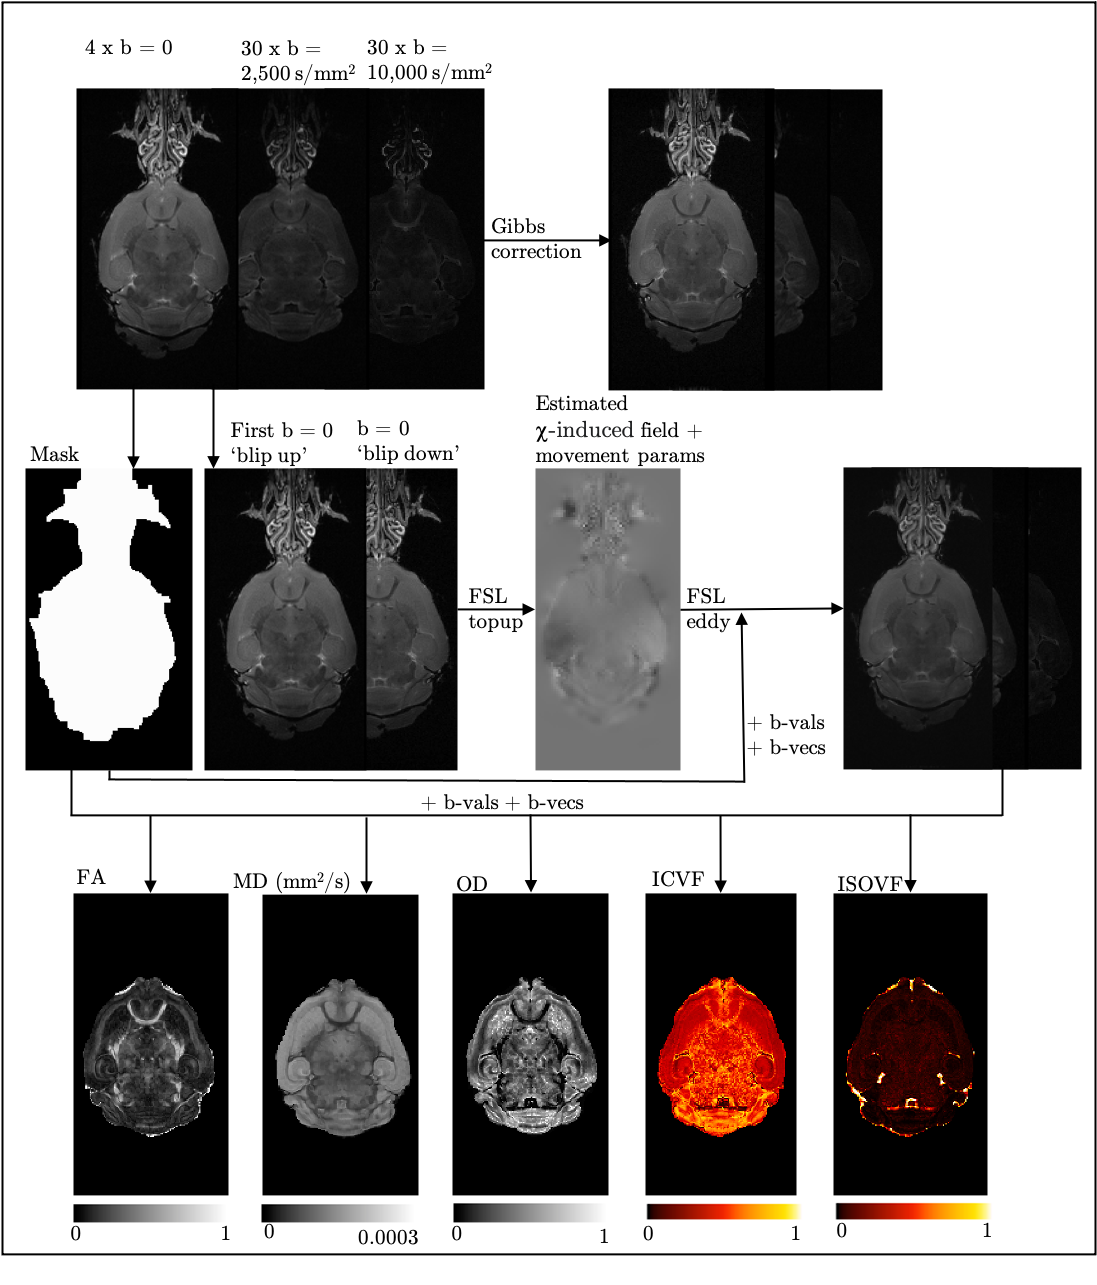
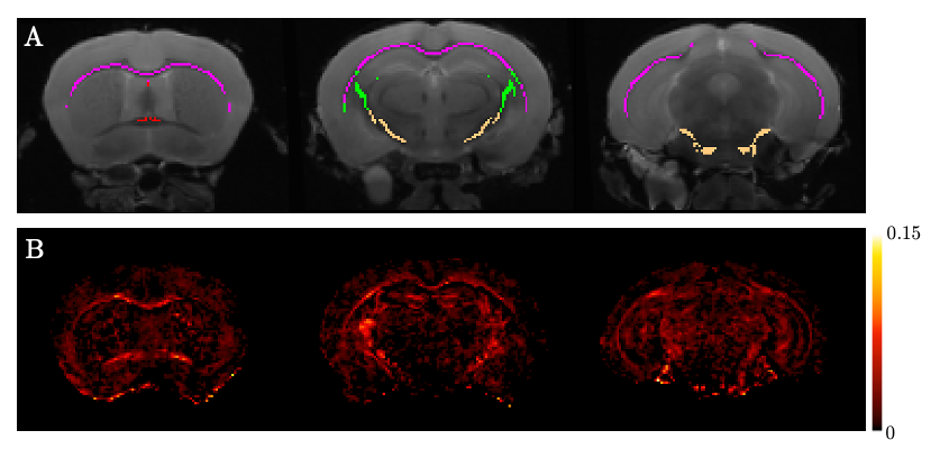
Figure 2. A. Example ROIs displayed in various coronal sections: red - fornix, magenta - corpus callosum, green - internal capsule, cream - cerebral peduncle. Not shown: cingulum, fimbria, anterior commissure. B. Difference FA map between average male HOMs and average male WTs, showing higher FA values in HOMs than WTs across WM.
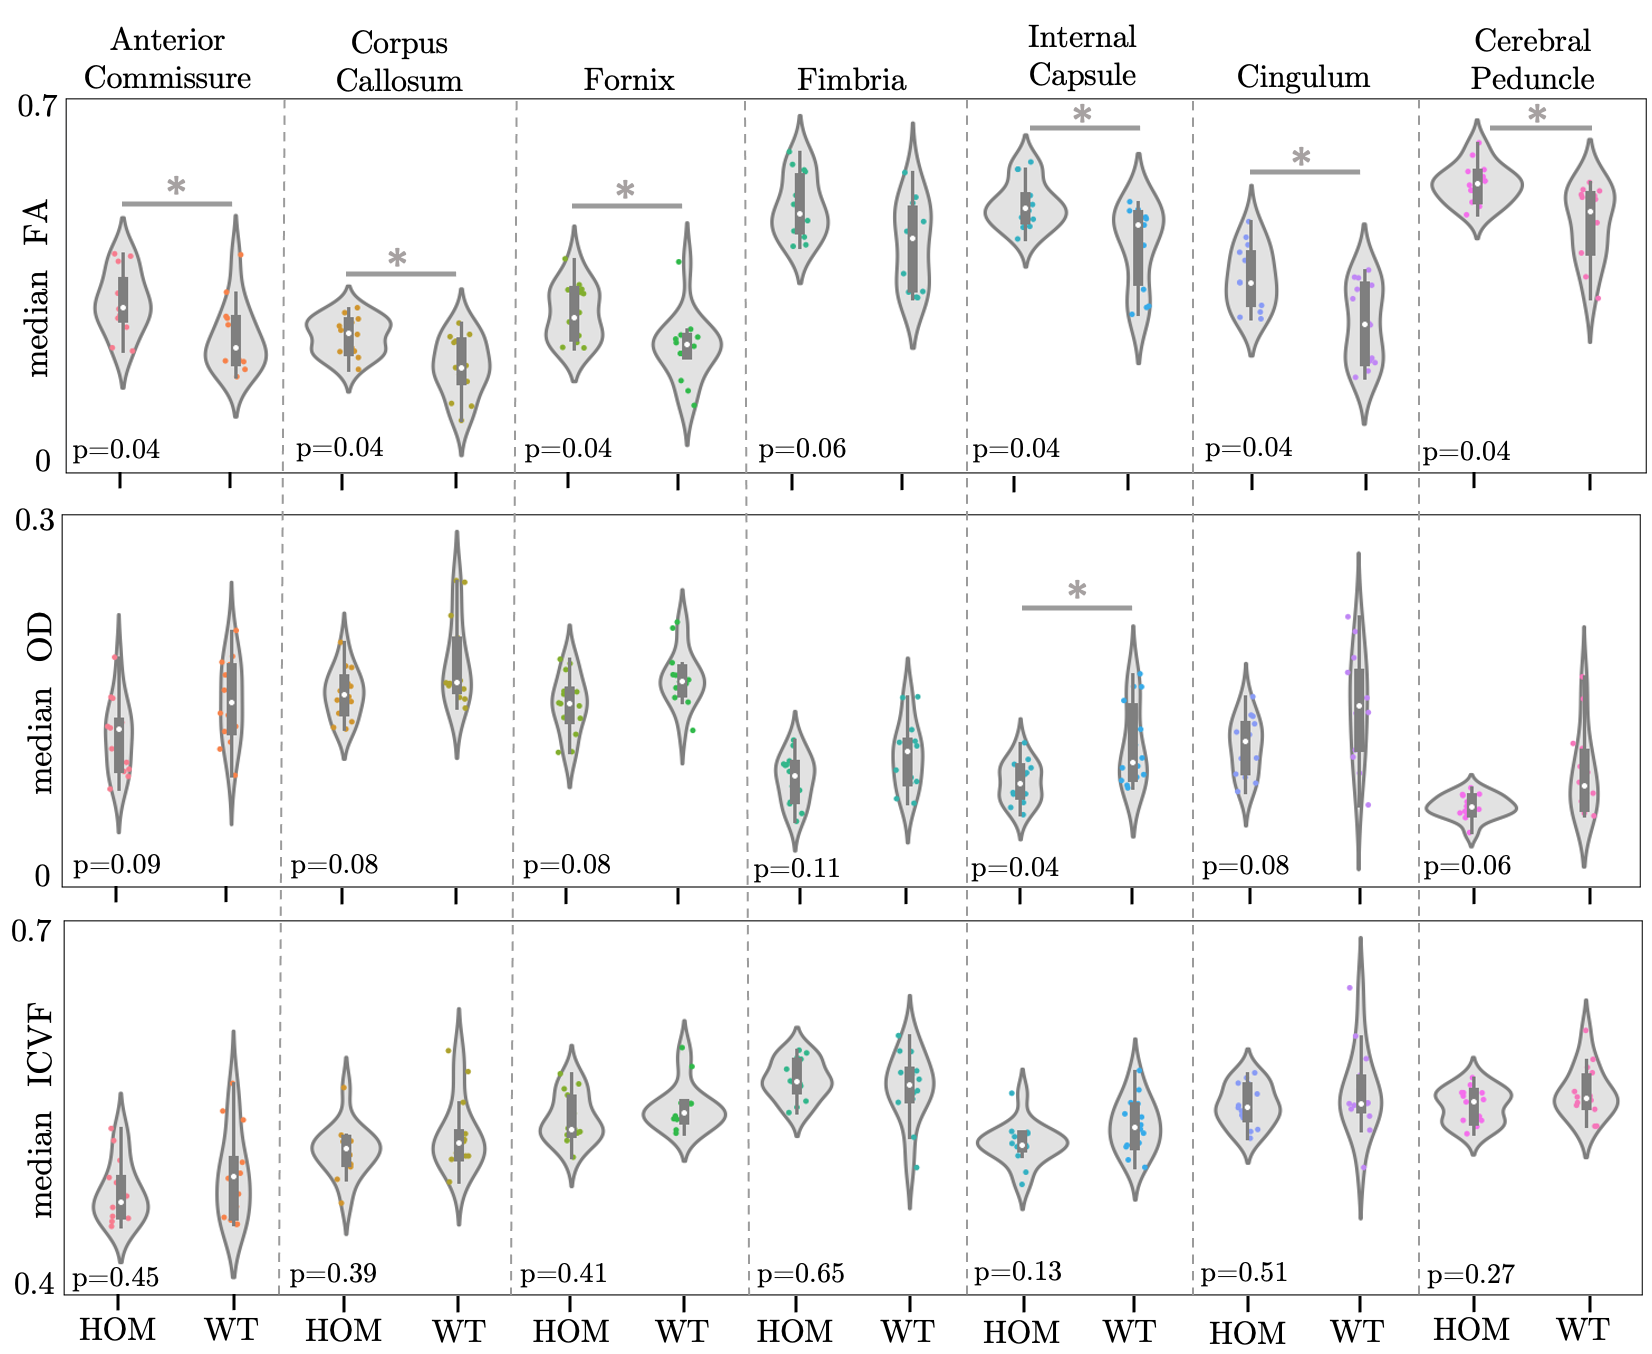
Figure 3. Violin plots of median FA, OD and ICVF values within 7 ROIs for male mice. *: p-value ≤0.05, FDR-corrected (5%).