1223
Investigating differences in lung cancer cells with induced and de-induced cisplatin resistance by 1H HR-MAS NMR metabolomics1Department of Chemistry and Biochemistry, University Bern, Bern, Switzerland, 2University Institute of Diagnostic, Interventional and Pediatric Radiology, University Bern, Bern, Switzerland, 3Department of BioMedical Research, University Bern, Bern, Switzerland
Synopsis
Cisplatin (cisPt) is an important drug that is used against various cancers, including advanced lung cancer. However, drug resistance is a major problem. Here, a high resolution magic angle spinning (HR-MAS) NMR study is presented determining the metabolic profile of lung cancer cells (A24) and metabolic adaptations in different levels of induced cisPt-resistance as well as in their de-induced counterparts. More than 40 metabolites were identified. Metabolic adaptations were determined, which increased with higher cisPt-resistance. Importantly, de-induced cell lines demonstrated similar metabolic adaptations. Metabolites predominantly changed in cisPt resistant cells and their de-induced counterparts include glutathione or taurine.
INTRODUCTION
While cisplatin (cisPt) is the main drug for treating non-small cell lung cancer (NSCLC)1, cisPt-resistance poses a major clinical problem.2 However, the mechanisms accounting for metabolic adaptations in cisPt-resistant cells are not well understood. Standardized in-vitro cell models with controllable quantitatively incremented cisPt-resistance allow investigating metabolic processes associated with resistance mechanisms, systematically. Recently, the stepwise generation of such cisPt-resistant NSCLC-cells has been reported. Furthermore, after de-induction, i.e. removal of cisPt from the culture media for several months, a long-term stable resistance was retained.3 The protocol to yield NSCLC-cells with increasing induced and de-induced cisPt-resistance was applied in the current study.High resolution magic angle spinning (HR-MAS) NMR spectroscopy allows to metabolically characterize biological samples like cells or tissue.4 Recently, the metabolic response of cisPt-sensitive and resistant A2780 cells towards treatment with Ruthenium complexes as alternatives to cisPt was shown.5,6
In the current study, HR-MAS NMR metabolomics was applied to NSCLC-cells (A240286S, A24), as controls and different levels of induced cisPt-resistance as well as their de-induced counterparts. First aim was to identify metabolites in the HR-MAS NMR spectra and secondly analyze the metabolic profiles with respect to potential markers of cisPt-resistance. Finally, the question was addressed if the previously observed maintenance of cisPt-resistance in de-induced NSCLC cells is also reflected in the metabolic profile.
EXPERIMENTAL PROCEDURES
cisPt-resistant cell lines - cisPt-resistant sublines were generated from the cisPt-sensitive wildtype A240286S cell strain (A24) derived from the suprarenal metastasis of a lung adenocarcinoma as previously described.3 Briefly, A24 cells were exposed during several months to stepwise increasing concentrations of cisPt in the culture medium ranging from 0.5μM to 8μM (Fig.1). From each subline cells were branched off and continued to be grown during several months in the absence of cisPt for de-induction (Fig.1).Preparation of cell samples - A24 cells and sublines were grown in modified RPMI 1640 and harvested. Cells were lysed by shock freezing, stored at -70°C, thawed and heated (20min, 70°C) prior to measurement. Cell suspensions were transferred into standard 4mm ZrO2-MAS rotors. All cell samples were prepared in two independent batches (a, b) at different time points under same conditions but using distinctive media. Batch (a) included control samples and the sublines (induced/de-induced) at 2μM and 8μM cisPt levels; batch (b) included control samples and the sublines (induced/de-induced) at 0.5μM and 4μM cisPt levels (Fig.1). Each sample consisted of ~5x10⁶ cells and was prepared in triplicate resulting in a total of 30 (2x15) samples.
NMR Spectroscopy - NMR was performed on a Bruker AV II 500 MHz NMR spectrometer. 1H HR-MAS NMR experiments (3kHz and 276K) were recorded using a 1D-PROJECT sequence7 (TE=400 ms, 512 scans) with water-presaturation.
Data Analysis - The NMR spectra were subdivided into individually sized buckets. Multivariate data analysis was performed applying probabilistic quotient normalization (PQN), mean centering and Pareto scaling. Unsupervised PCA and orthogonal partial least squares (oPLS) with the cisPt-concentration as Y-variables were performed, cross-validated, and subjected to permutation testing.
RESULTS
In Fig.2, a representative 1H HR-MAS NMR spectrum of lung adenocarcinoma cells (A24) is shown with assignments. Overall more than 40 different metabolites were identified, which builds the basis for future metabolomic studies in this cell type.Unsupervised PCA was performed (Fig.3) and demonstrated I) close clustering of replicates, II) greater distance from the cisPt-sensitive samples with increasing resistance, III) most importantly that the de-induced samples are close to their induced counterparts, IV) clear separation of the two batches, possibly due to passage and media differences. The main direction of separation with resistance is along PC2, while the two batches were separated primarily along PC1.
Similar results were obtained from oPLS-analysis (Fig.4a): Close clustering of replicates and greater distance from the cisPt sensitive samples with increasing resistance was observed. The de-induced samples are metabolically similar as their resistant counterparts. The two batches are clearly separated. Due to the oPLS guidance, the main direction of separation with resistance is switched compared to the PCA and is along LV1, while the two batches are separated primarily along LV2. Fig.4b demonstrates that the PLS model predicts the resistance of samples well: The predicted resistances are close to the measured ones. The corresponding loading plot (Fig.5) shows increased concentration of glutathione (GSH) and taurine (Tau) in cisPt-resistant cells, while Creatine (Cr) and Phosphocholine (PC) appear reduced.
DISCUSSION
The deviation of the metabolic profile from cisPt sensitive cells increases with the concentration of cisPt exposure and most likely reflects the metabolic expression of increasing cisPt-resistance previously proved by increasing IC50 values.3 Cells with high cisPt exposure showed elevated levels of GSH, a biomarker candidate for cisPt-resistance as it functions as reactive oxygen species (ROS) scavenger.8 Likewise, increased taurine levels may reflect cellular defense and are reported to have antiapoptotic effects in response to cisPt.9The metabolic similarity of induced cisPt-resistant cells and their de-induced counterparts indicates an adaptation along with a metabolic long-term memory of the cells. This is in accordance with the maintenance of cisPt-resistance reported in de-induced cells.3
CONCLUSION
The detection of metabolic differences in cisPt-resistant cells and their de-induced counterparts will be useful for future studies addressing the response to cisPt surrogates and other drugs.Acknowledgements
No acknowledgement found.References
- Fennell, D.A.; Summers, Y.; Cadranel, J.; Benepal, T.; Christoph, D.C.; Lal, R.; Das, M.; Maxwell, F.; Visseren-Grul, C.; Ferry, D. Cisplatin in the modern era: The backbone of first-line chemotherapy for non-small cell lung cancer. Cancer Treat. Rev. 2016, 44, 42–50.
- Chen, S.H.; Chang, J.Y. New Insights into Mechanisms of Cisplatin Resistance: From Tumor Cell to Microenvironment. Int. J. Mol. Sci. 2019, 20, 4136.
- Ruprecht, N.; Hofmann, L.; Hungerbühler, M.N.; Kempf, C.; Heverhagen, J.T.; von Tengg-Kobligk, H. Generation of Stable cisPt Resistant Lung Adenocarcinoma Cells. Pharmaceuticals 2020, 13, 109 ; doi: 10.3390/ph13060109.
- Lindon, J.C., Beckonert, O.P., Holmes, E., Nicholson, J.K.. High-resolution magic angle spinning NMR spectroscopy:Application to biomedical studies. Prog Nucl Mag Res Sp. 2009; 55: 79–100.
- Vermathen, M., Paul, L.E.H., Diserens, G., Vermathen, P., Furrer, J. (2015) 1H HR-MAS NMR Based Metabolic Profiling of Cells in Response to Treatment with a Hexacationic Ruthenium Metallaprism as Potential Anticancer Drug. PLoS ONE 10(5): e0128478. doi:10.1371/journal. pone.0128478
- Primasovà, H., Paul, L.E.H., Diserens, G., Primasovà, E., Vermathen P., Vermathen, M., Furrer, J. 1H HR-MAS NMR-Based Metabolomics of Cancer Cells in Response to Treatment with the Diruthenium Trithiolato Complex [(p-MeC6H4iPr)2Ru2(SC6H4-p-But)3]+ (DiRu-1). Metabolites 2019, 9, 146; doi:10.3390/metabo9070146
- Aguilar J.A., Nilsson M.; Bodenhausen G., Morris G.A. Spin echo NMR spectra without J modulation. Chem. Commun. 1012; 48:811-813.
- Brozovic A., Ambriović-Ristov A., Osmak M. The relationship between cisplatin-induced reactive oxygen species, glutathione, and BCL-2 and resistance to cisplatin. Critical Reviews in Toxicology, 2010; 40(4): 347–359.
- Sørensen B.H., Thorsteinsdottir U.A., Lambert I.H., Am J Physiol Cell Physiol 307: C1071–C1080, 2014. doi:10.1152/ajpcell.00274.2014.
Figures
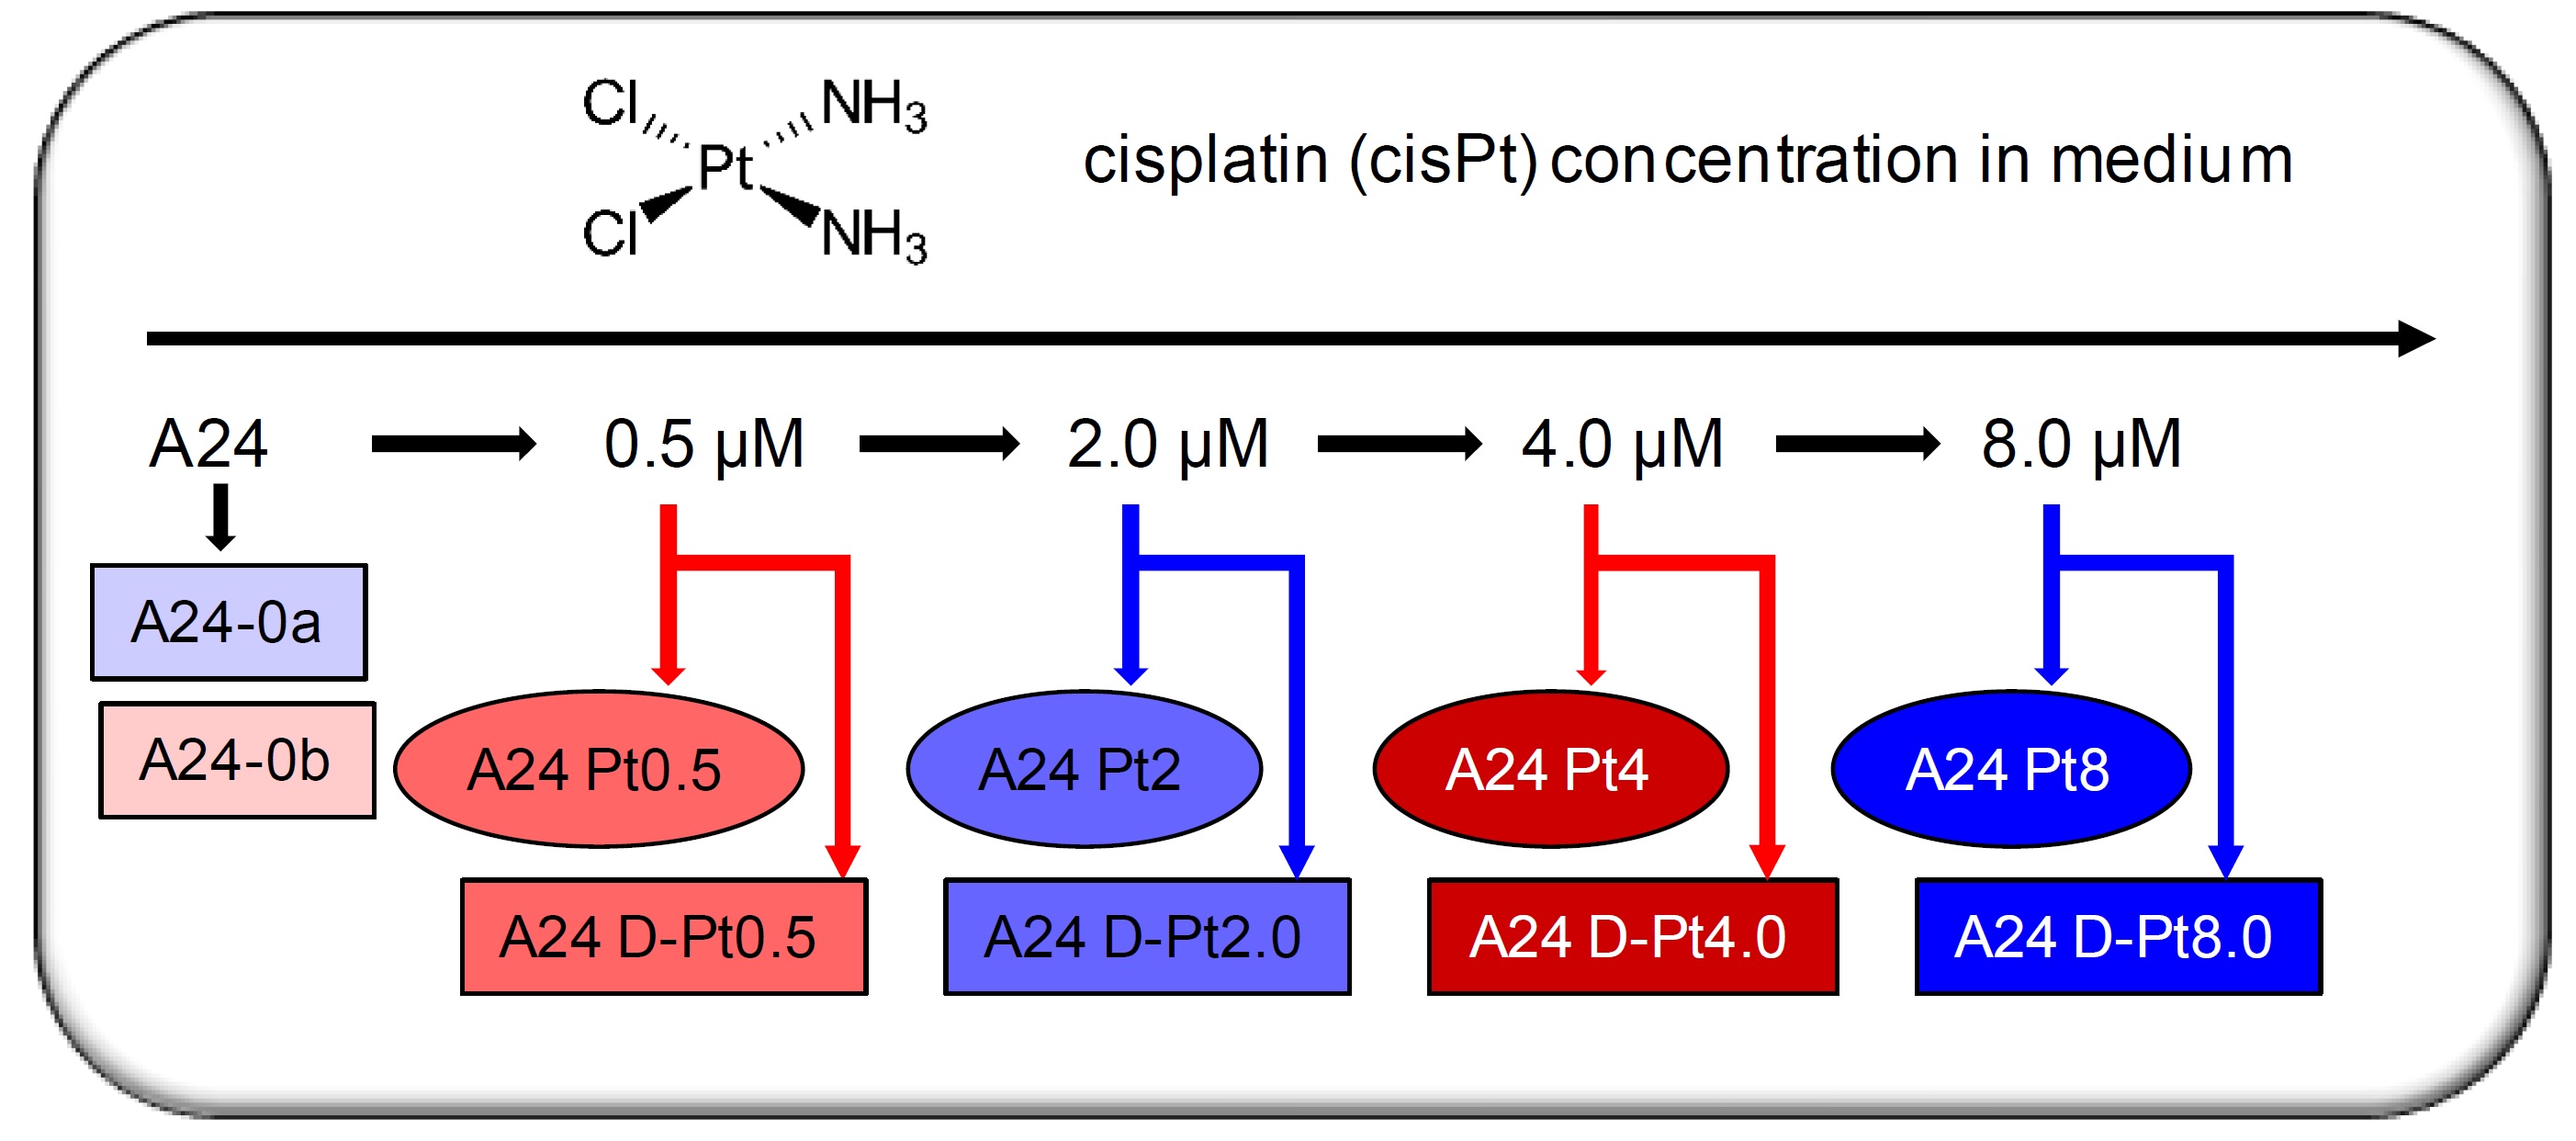
Figure 1:
Sample overview of examined lung adenocarcinoma (A24) cell cultures. Two separate batches of cell cultures were examined (color coded in red and blue) in triplicates with increasing cisPt resistance. For each cisPt concentration, resistant and de-induced cells were examined (labelled Pt0.5 through Pt8.0, and D-Pt0.5 through D-Pt8.0, respectively; indicated with ellipsoids and rectangles). The color- and form-coding is maintained for all figures.
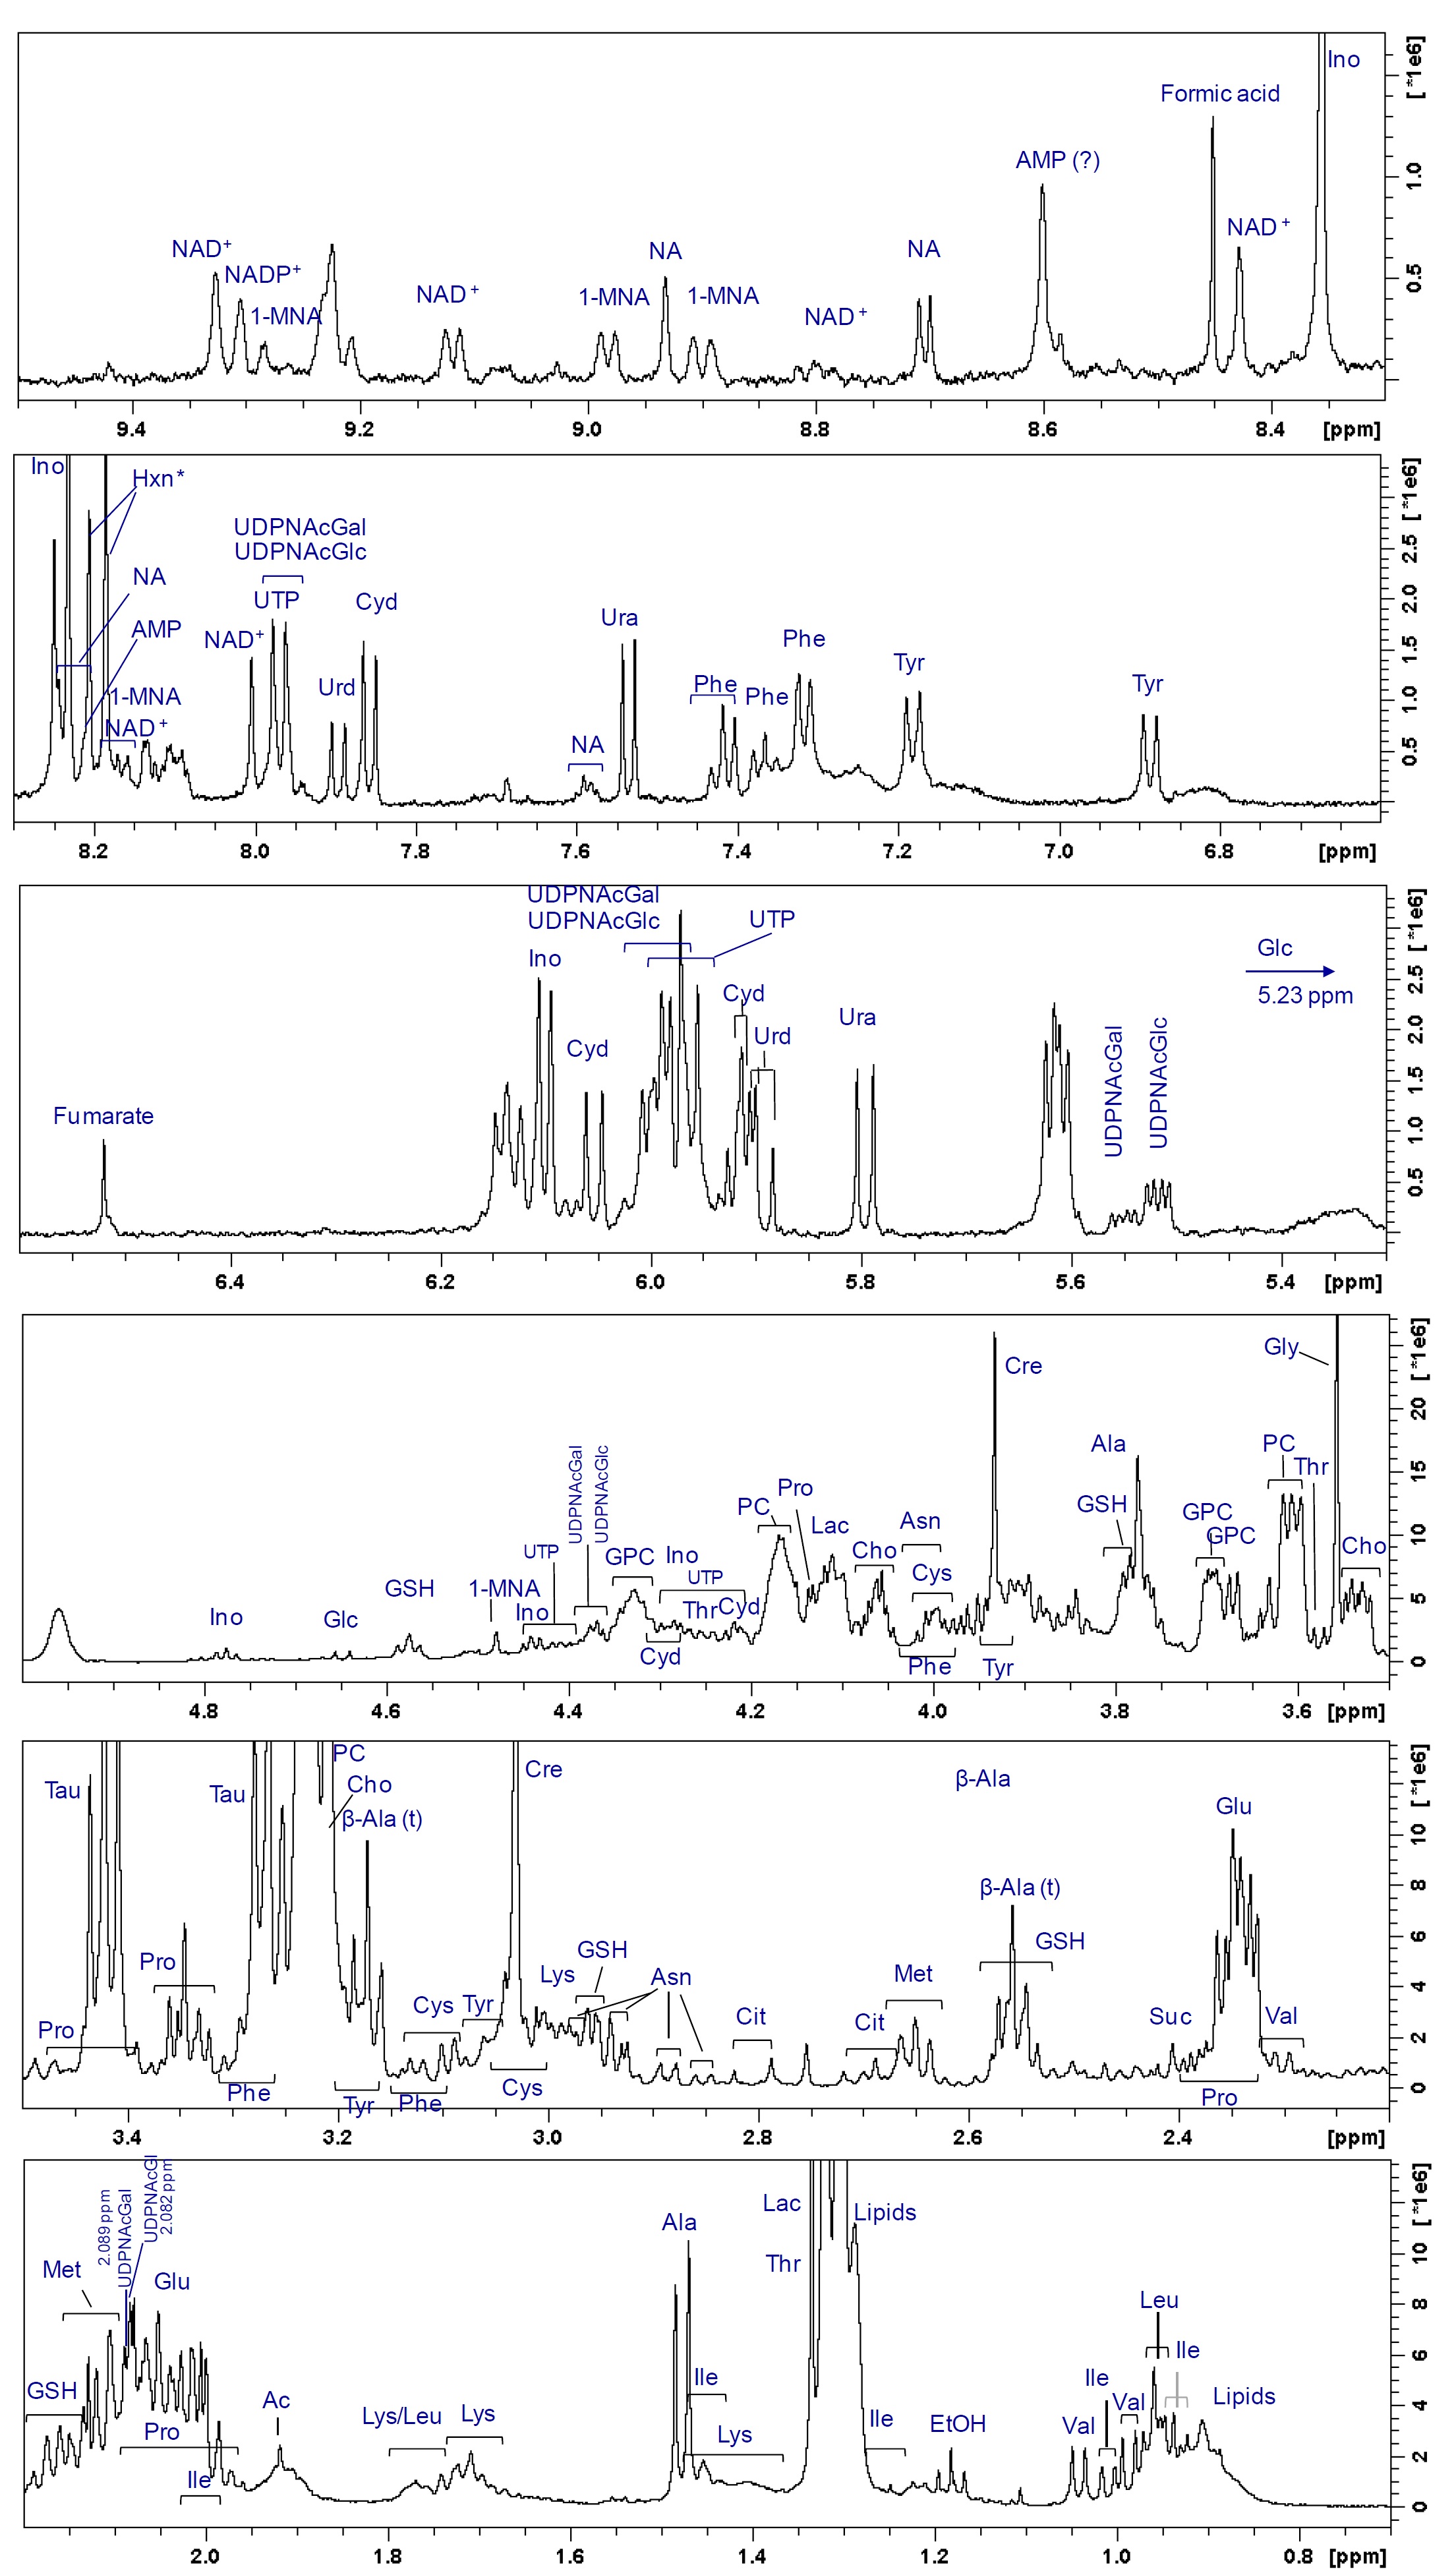
Figure 2:
Figure 2:
1H HR-MAS-PROJECT spectrum of a A24 cell suspension in PBS with resonance assignments. The assignment was based on 2D 1H1H TOCSY and J-resolved spectra, as well as on spectral reference data, data derived from the literature, and the human metabolome data base (HMDB).
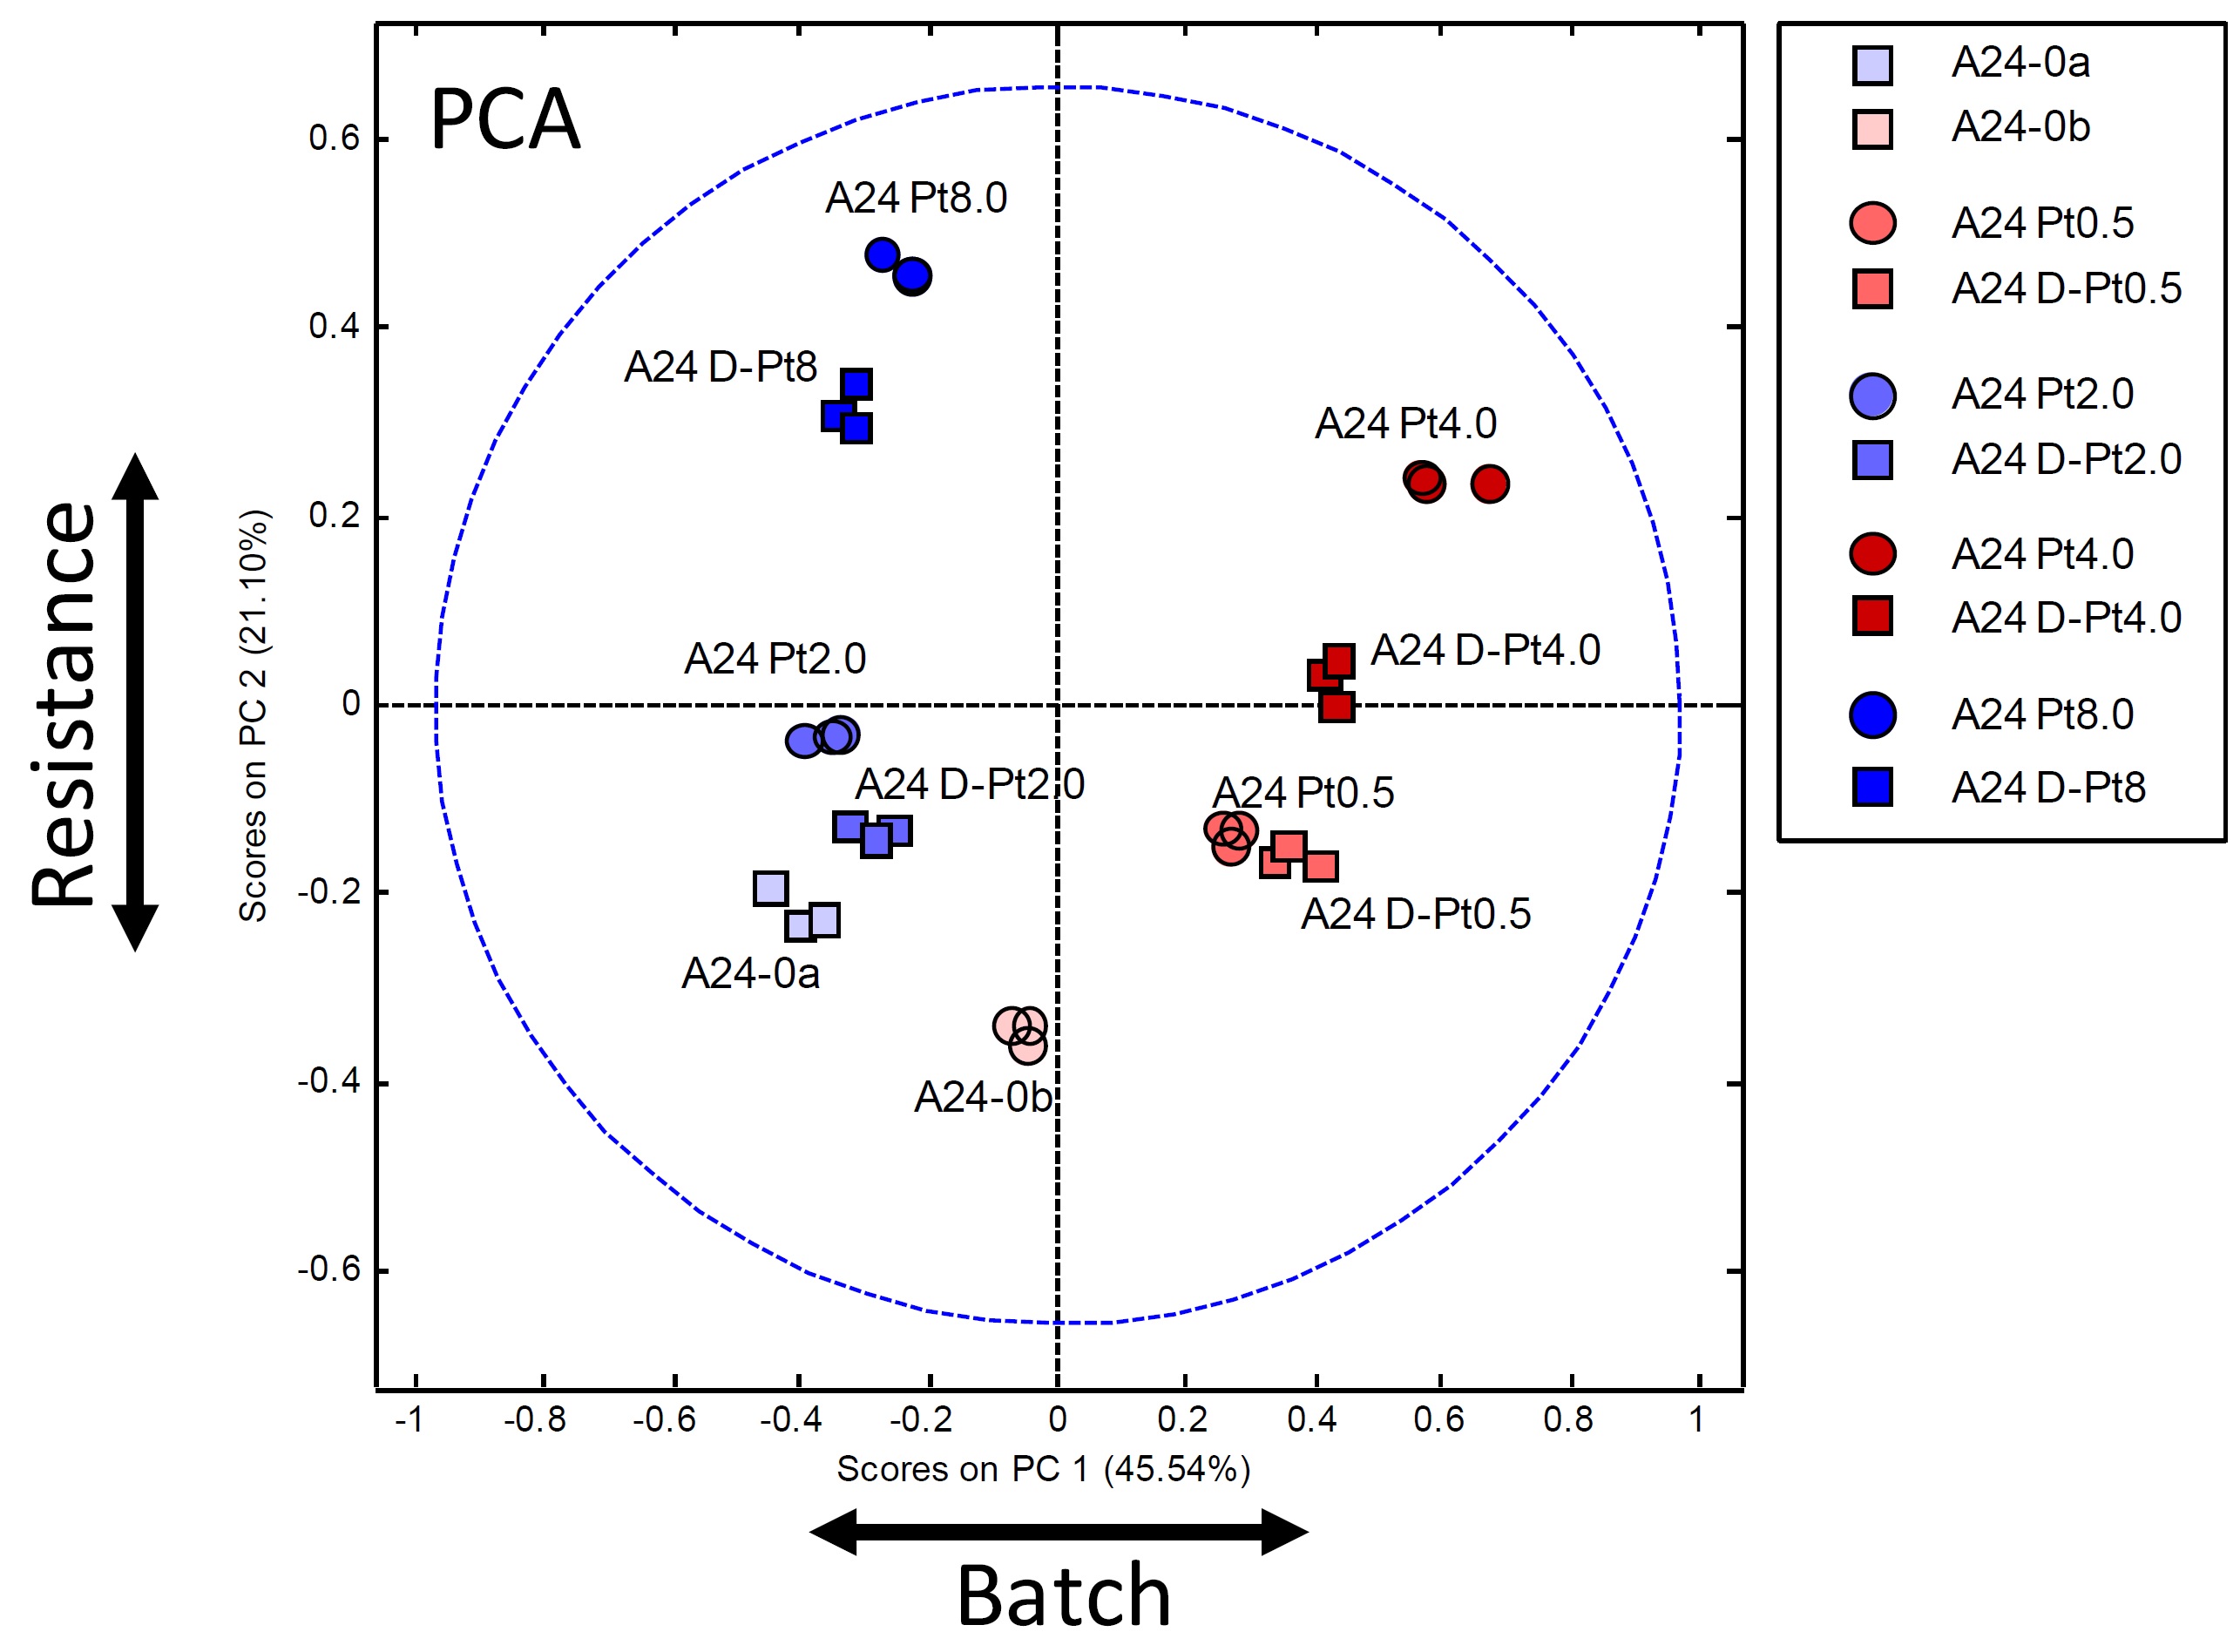
Figure 3:
PCA scores plot (PC1 – PC2) of all samples using the color and form coding introduced in Fig.1.
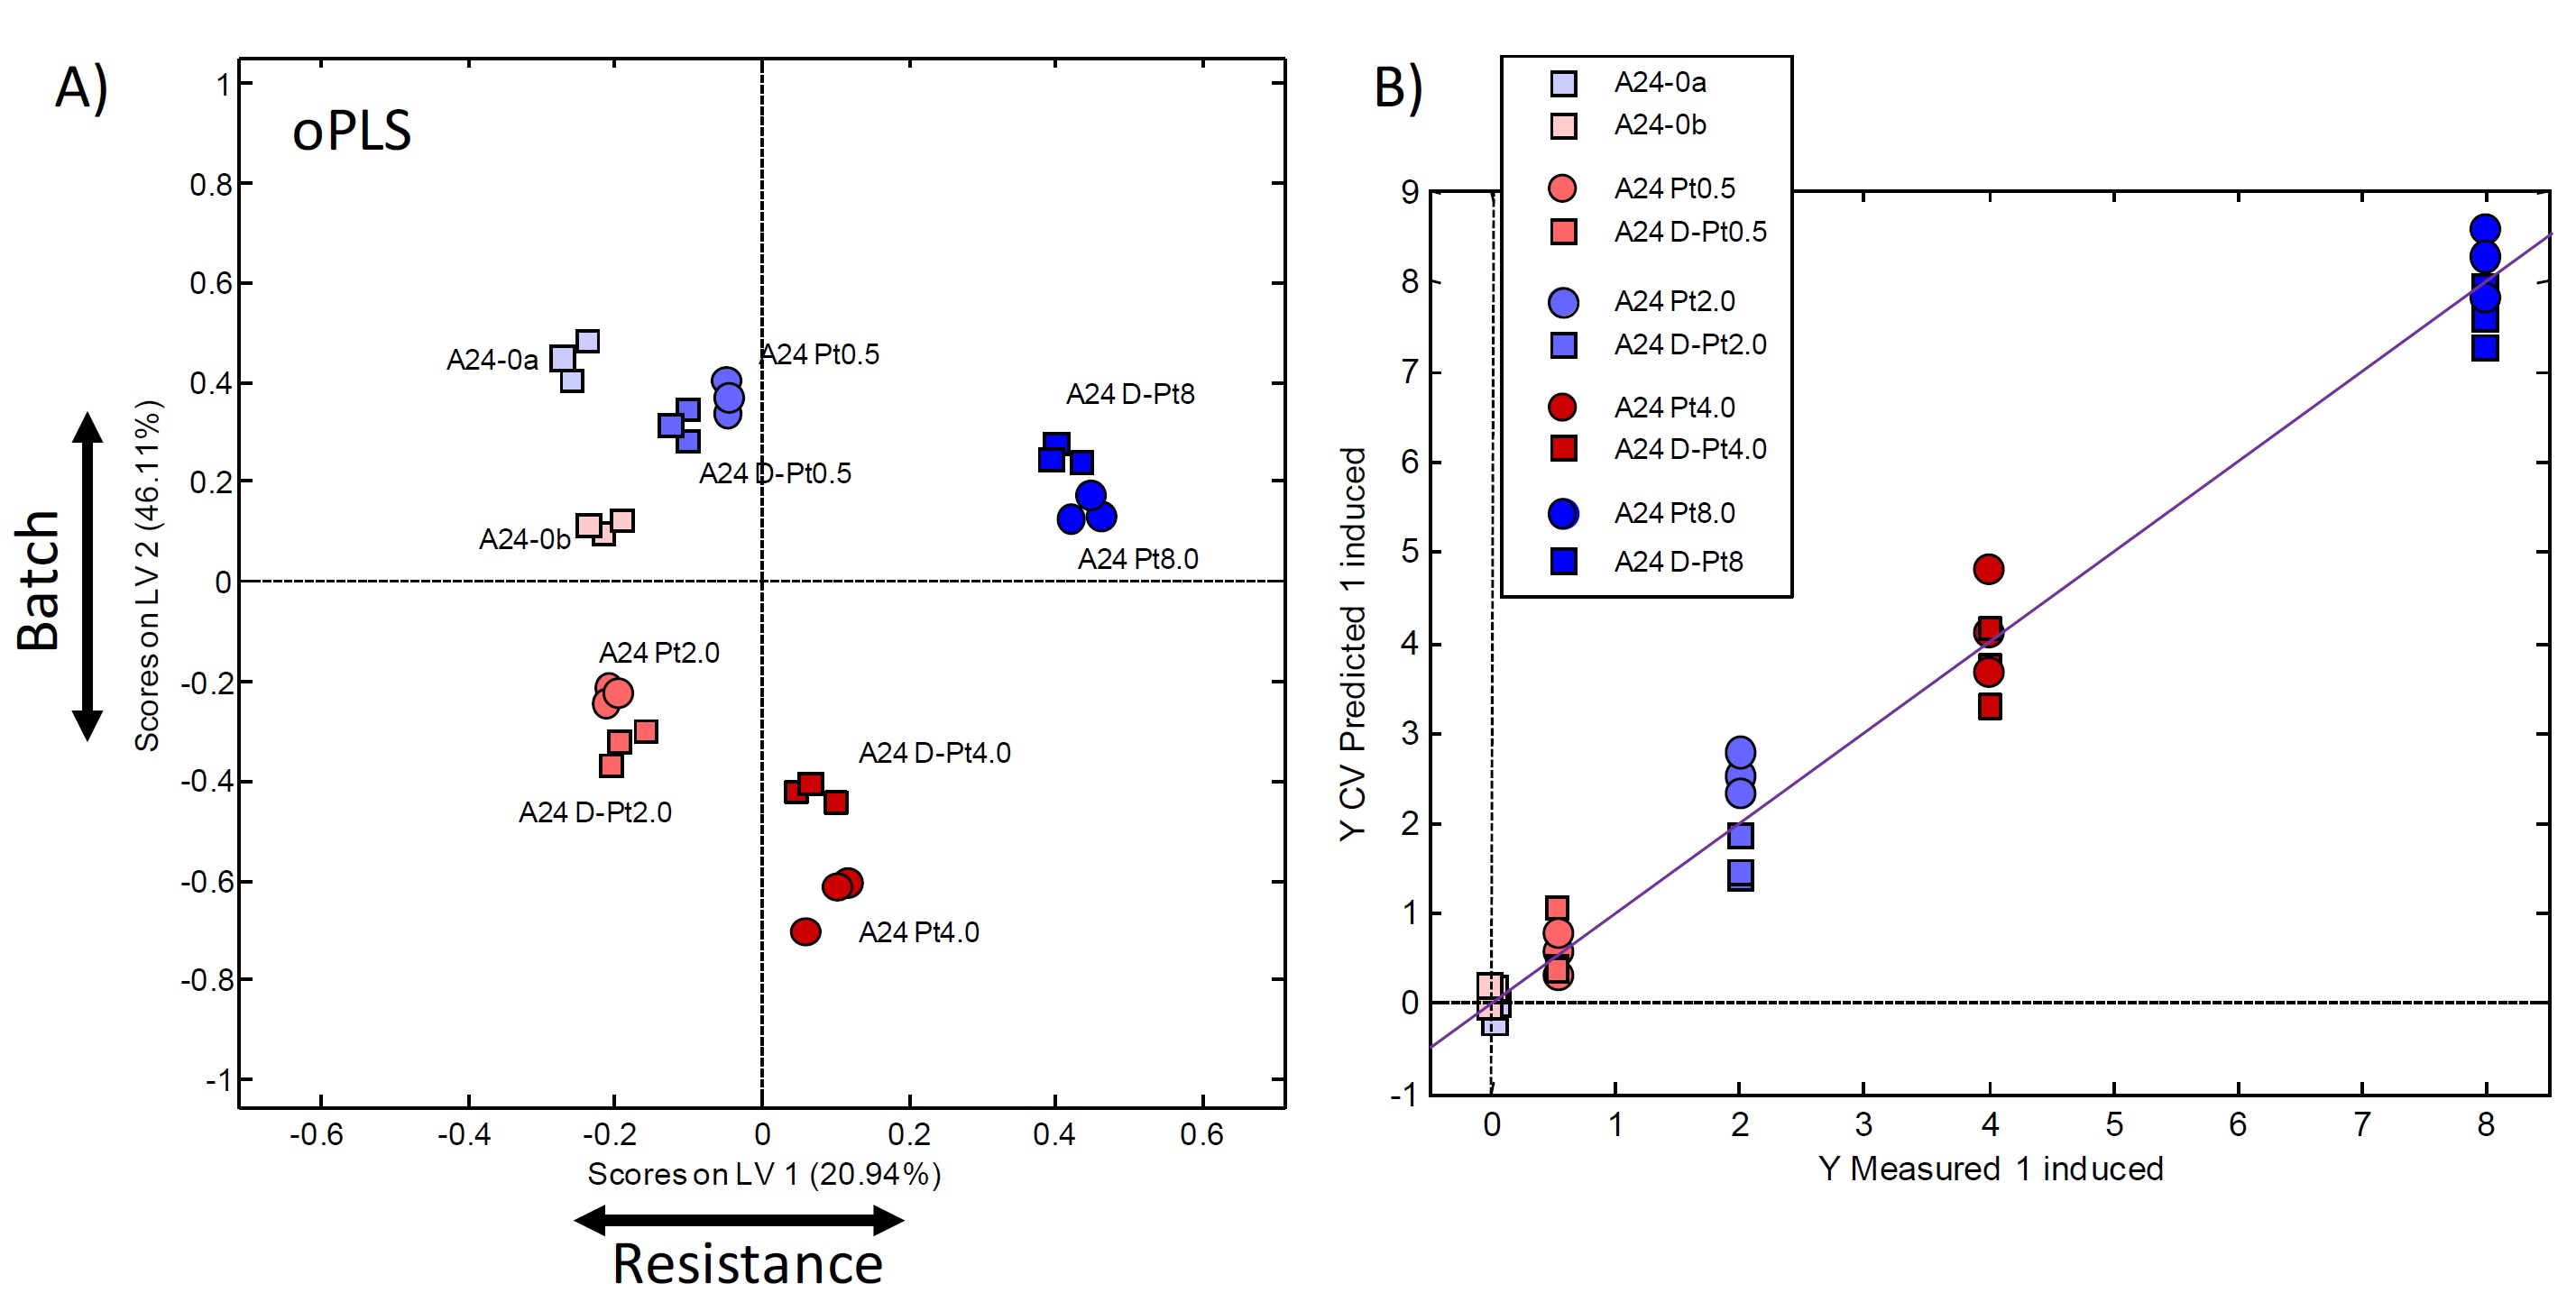
Figure 4:
A) oPLS scores plot (LV1 – LV2) using the resistance as scaled prior knowledge (y-table).
B) Description of the PLS model showing the measured compared to the predicted resistance values.
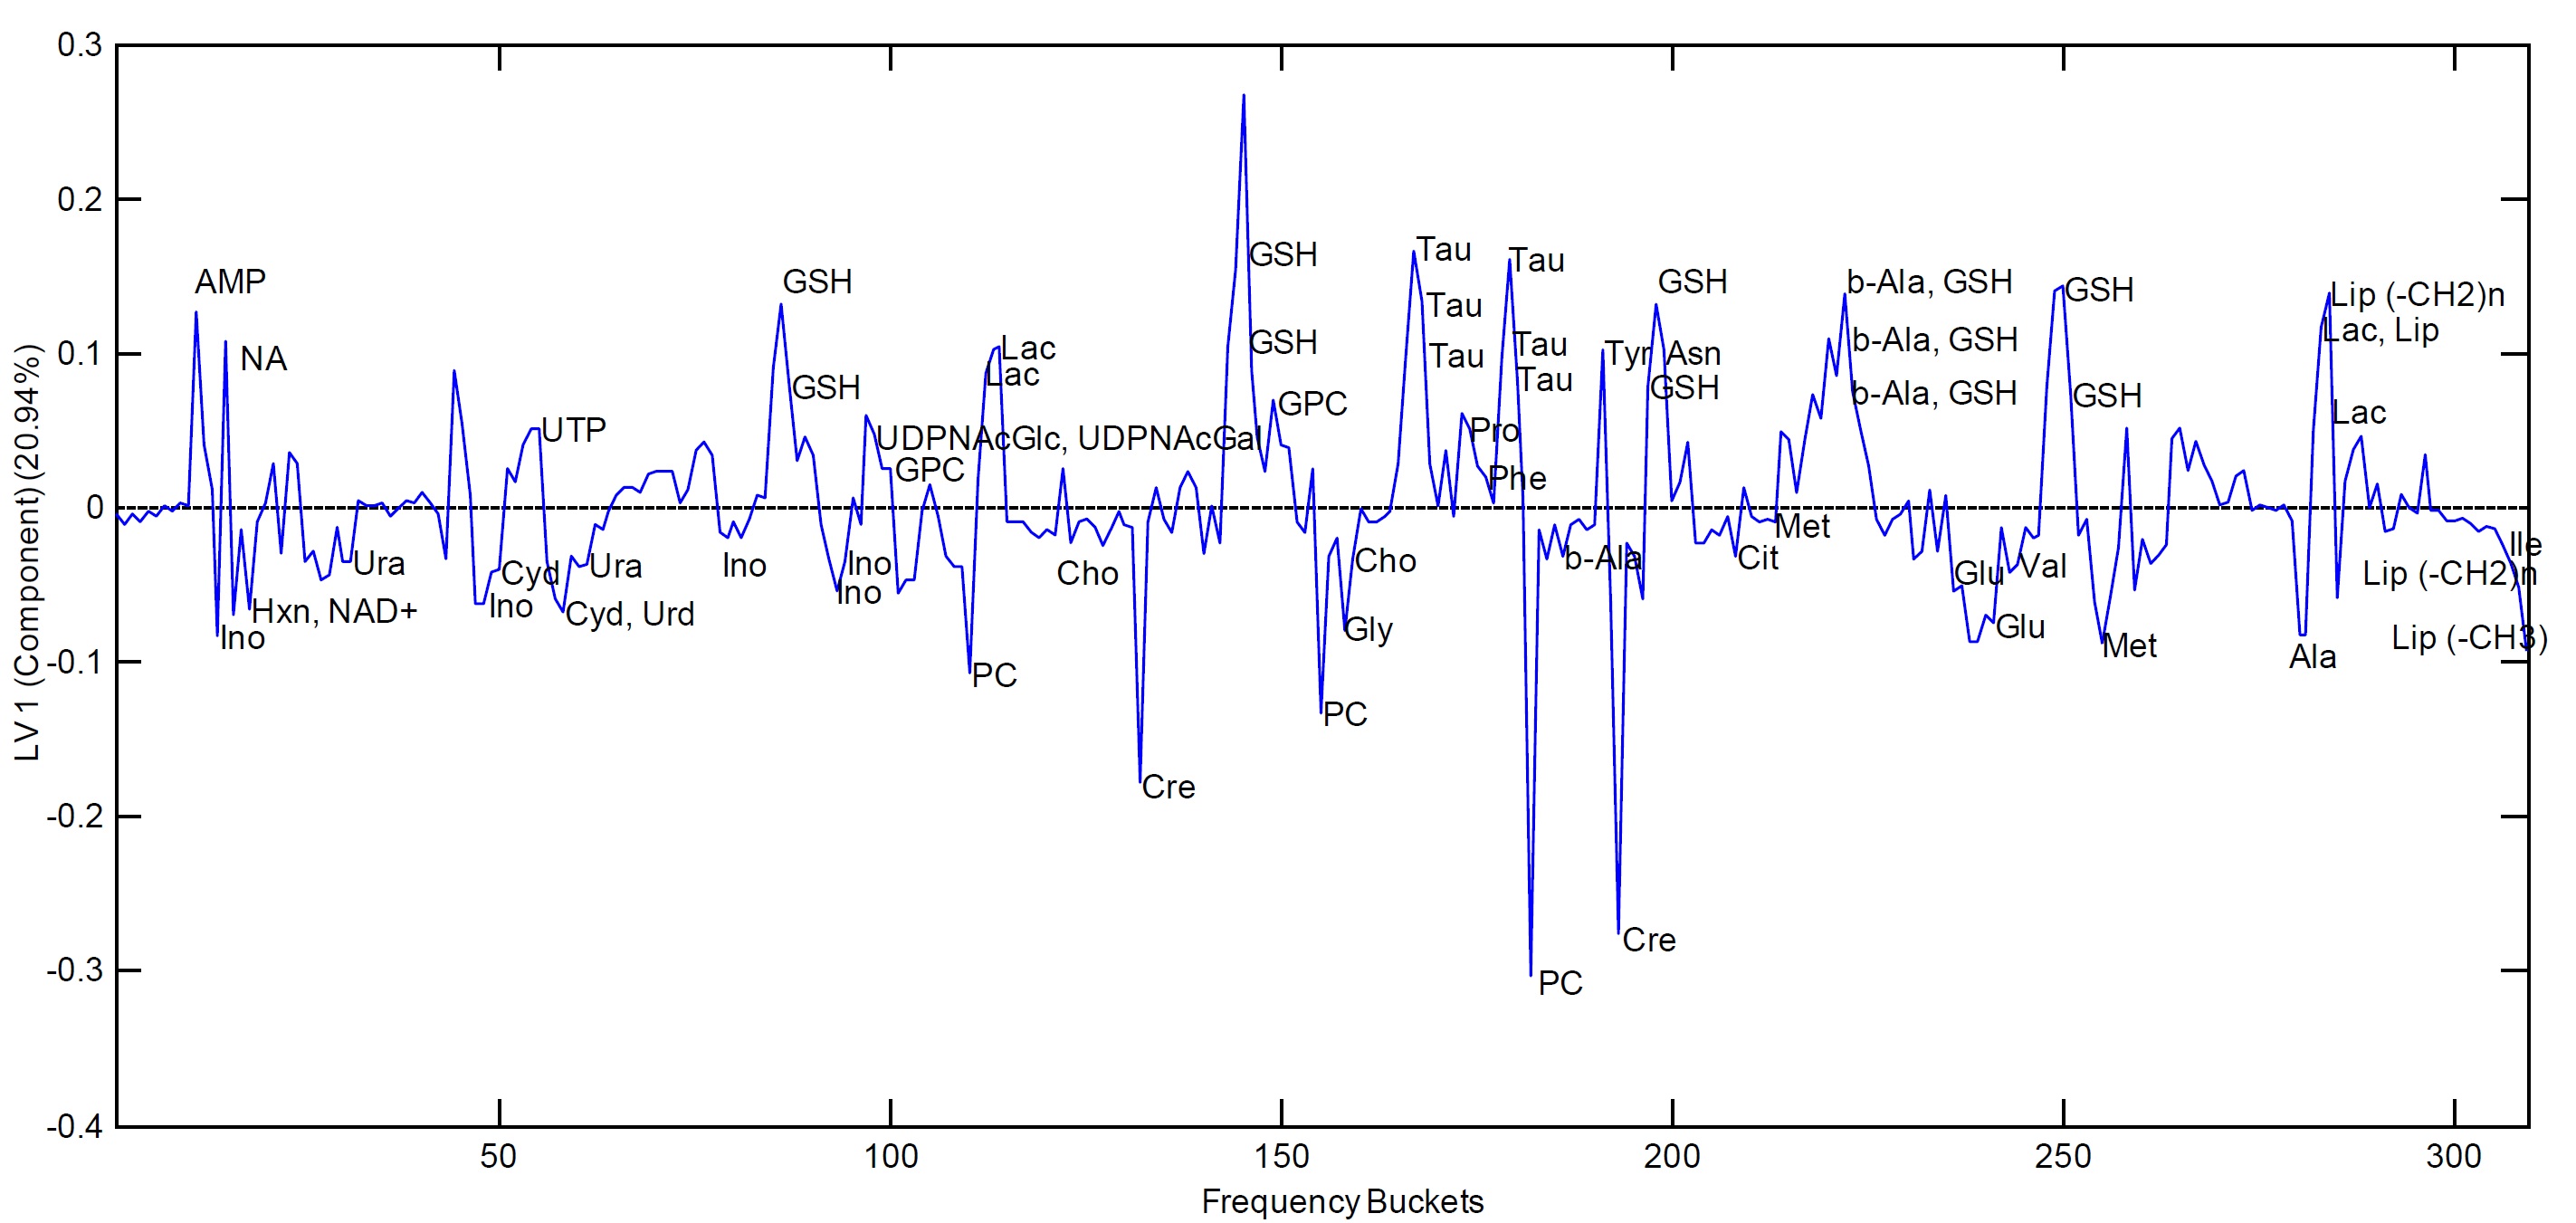
Figure 5:
PLS-loadings of the first PLS component (LV 1), which was mainly separating the samples according to resistance. Positive LV components indicate higher metabolite concentrations in cells with increased cisPt resistance.