1220
HIV Theranostics Based on Intrinsic CEST Contrasts of Antiretroviral Drugs1Pharmacology and Exp Neuroscience, University of Nebraska Medical Center, Omaha, NE, United States, 2Radiology, University of Nebraska Medical Center, Omaha, NE, United States
Synopsis
HIV theranostics that enables the in vivo imaging of antiretroviral drugs is a powerful tool for the development of antiretrovirals (ARVs) targeting HIV reservoirs, and the development of long-acting ARVs that affect drug adherence and as such reduce viral transmission, prevent new infections, and limit the emergence of viral drug resistance. We tested the possibility to develop HIV theranostics based on the intrinsic CEST contrasts of ARVs. Herein, we measured the CEST effects of first-line ARVs including 3TC (lamivudine) and FTC (emtricitabine) and developed CEST MRI methods for in vivo detection of ARVs in the central nervous system (CNS).
INTRODUCTION
Human immunodeficiency virus (HIV) theranostics that enables the in vivo imaging of antiretroviral drugs will be a powerful tool for the development of antiretrovirals (ARVs) targeting HIV reservoirs1-5, and the development of long-acting ARVs that affect drug adherence and as such reduce viral transmission, prevent new infections, and limit the emergence of viral drug resistance6-9. In this study, we tested the possibility to develop HIV theranostics based on the intrinsic chemical exchange saturation transfer (CEST) contrasts of ARVs. Herein, we measured the CEST effects of first-line ARVs including 3TC (lamivudine) and FTC (emtricitabine) and developed CEST MRI methods for in vivo detection of ARVs in the central nervous system (CNS).MATERIALS AND METHODS
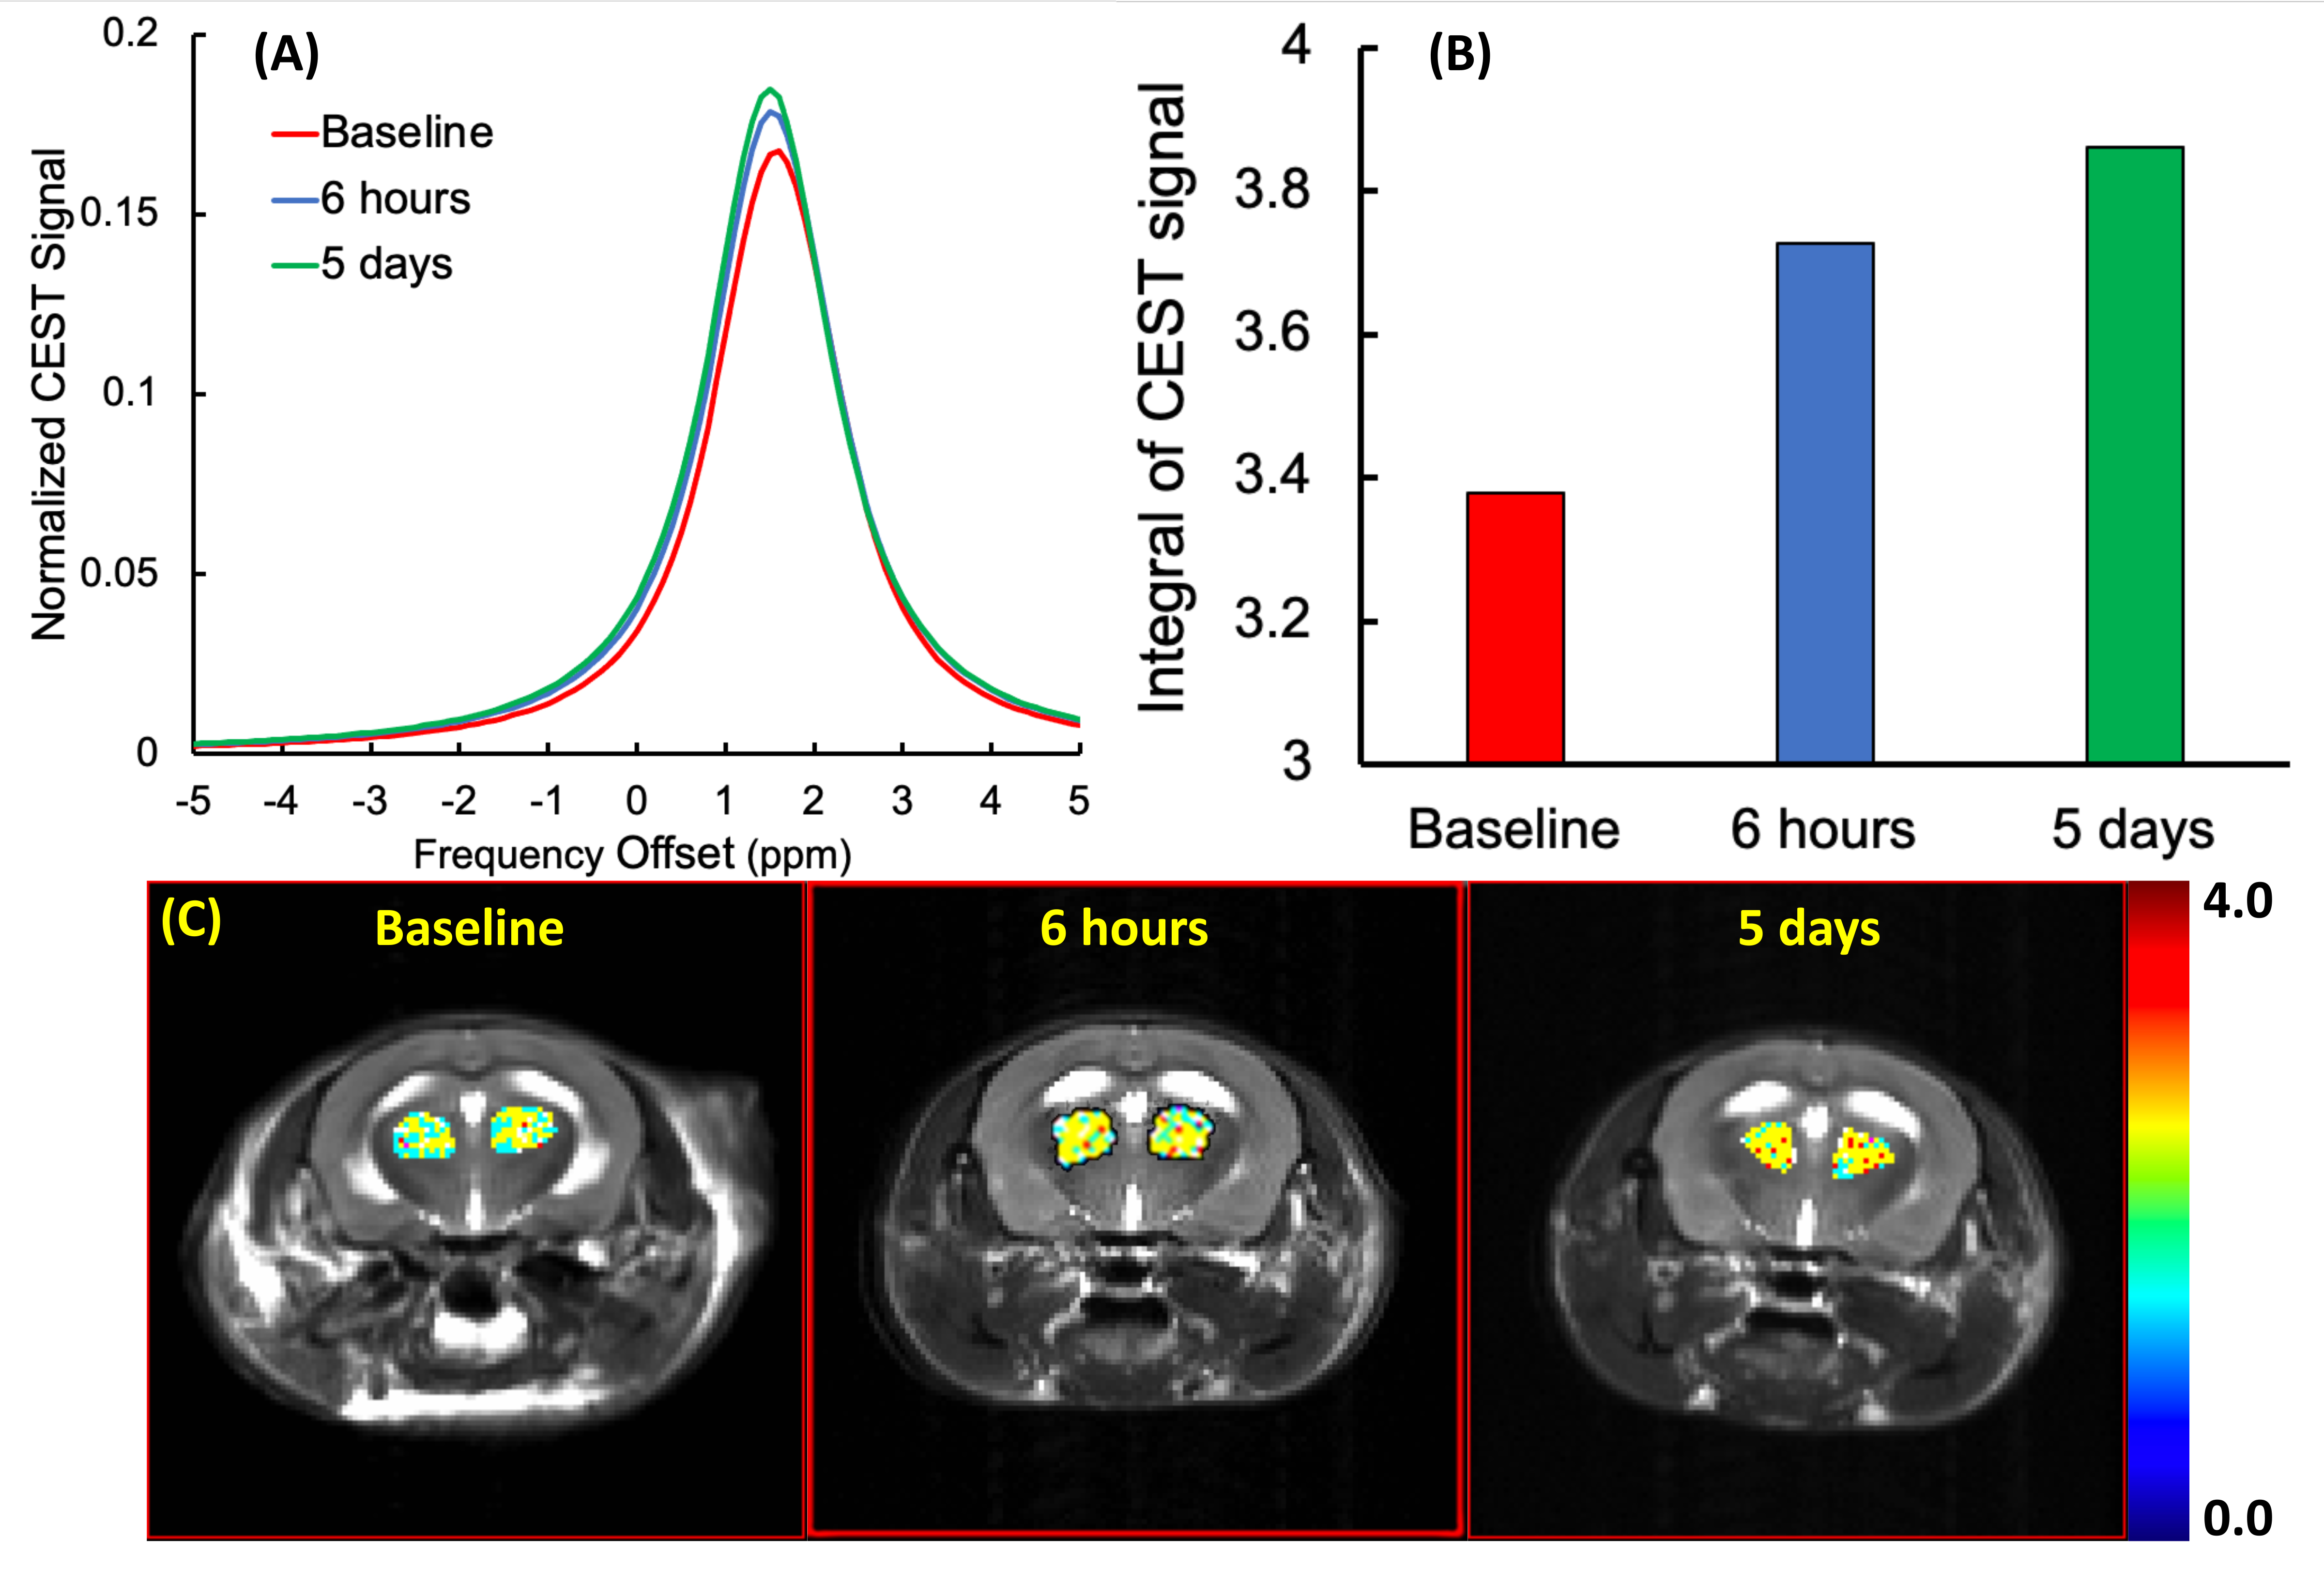
CEST contrasts of 3TC and FTC were measured in PBS saline on a 7 Tesla scanner (Bruker PharmaScan). The with a Bruker quadrature RF coil. Z-spectra were built using a RARE sequence with saturation RF power = 3.6 mT and length = 3 s, saturation frequencies = -8 to +8 ppm, step = 0.2 ppm. B0 correction was done using WASSR10. Asymmetric magnetization transfer ratios (MTRasym) was calculated from the Z-spectra. A C57BL/6 mouse was administrated with 3TC (250 mg/kg) by oral gavage. The mouse brain was scanned using CEST MRI before drug administration and at 6 hours and 5 days post-drug administration. Lorentzian fitting11-16 was used to analyze the CEST signals of the amino protons of 3TC.RESULTS
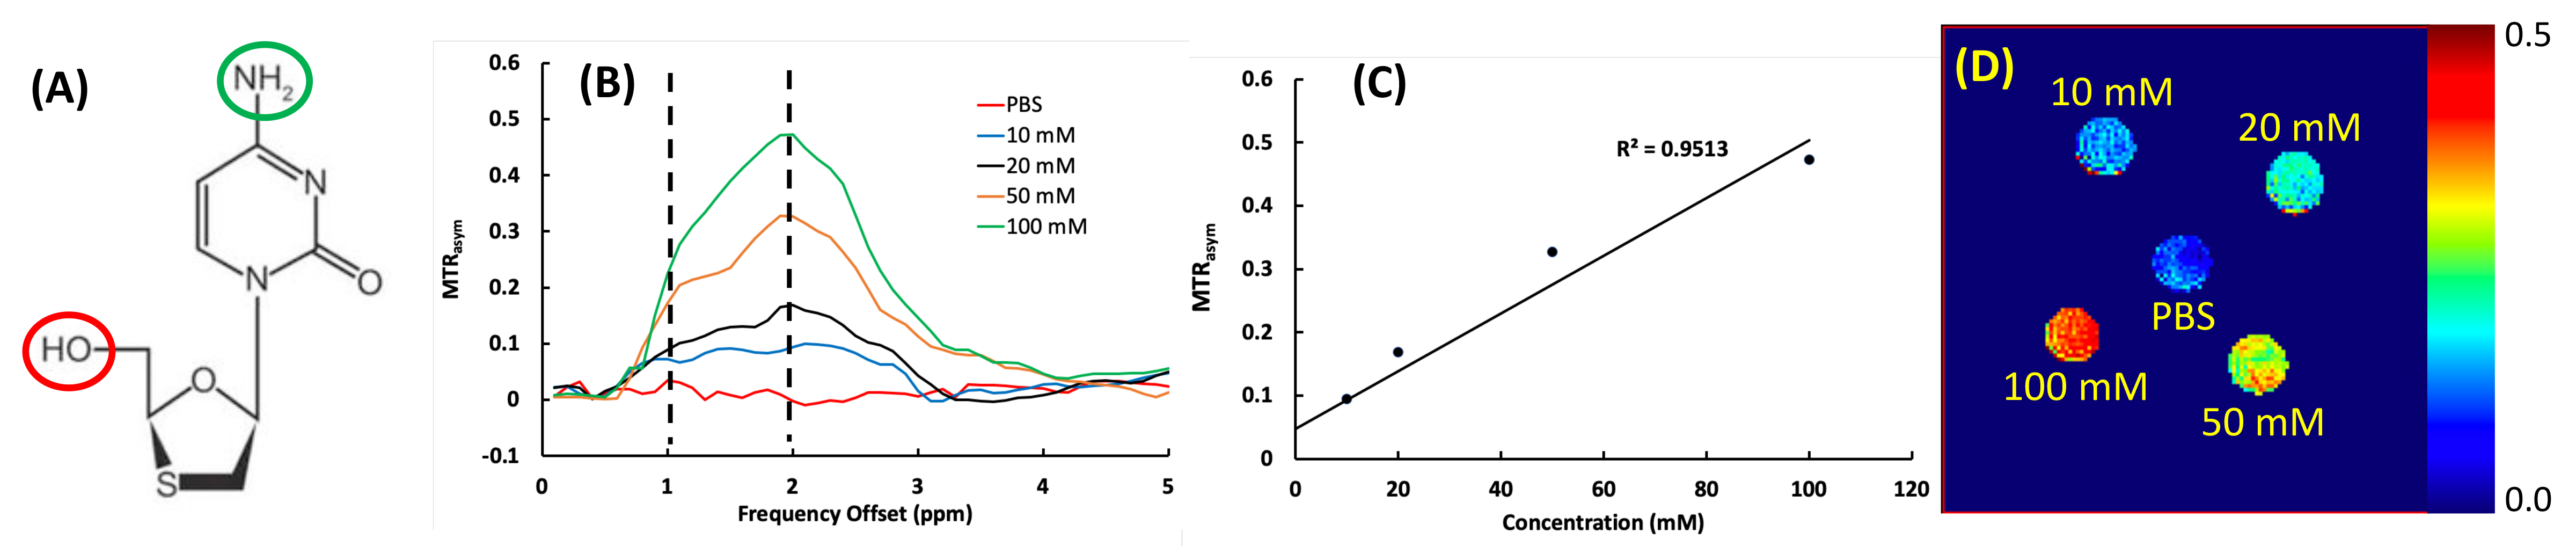
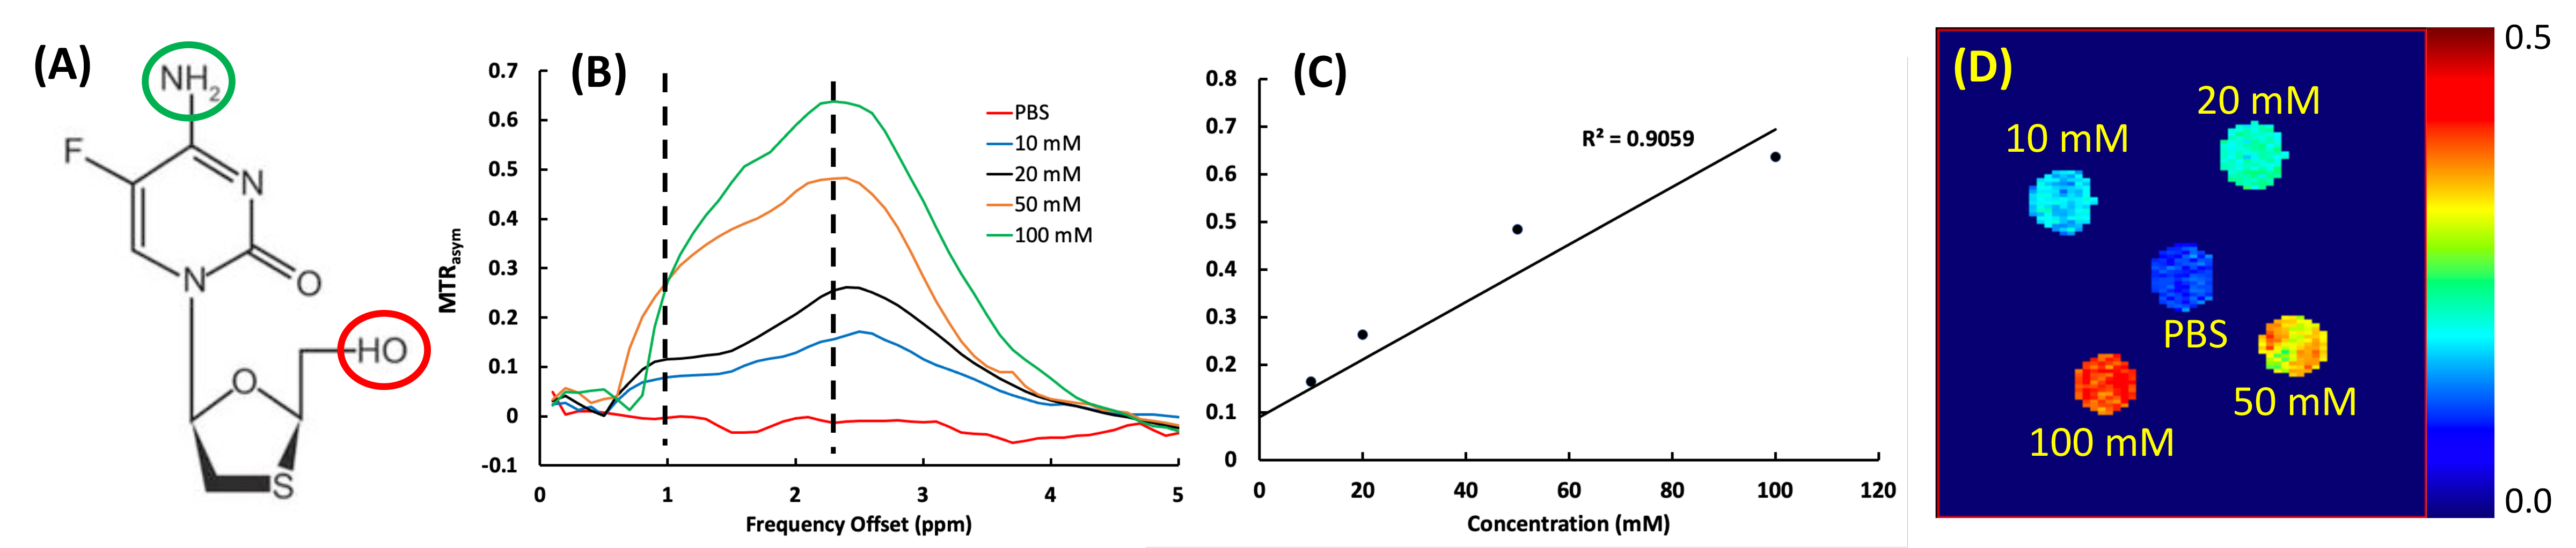
Figure 1 shows the CEST contrasts of 3TC in PBS at 37oC. The CEST effects of the hydroxyl and amino protons (Figure 1A) were detected at 1 and 2 ppm, respectively on the MTRasym plot (Figure 1B). The concentration-dependent effect was observed. Figure 1C shows the CEST effect of the amino proton (MTR@2ppm) linearly proportional to the 3TC concentration with a correlation coefficient R2 = 0.95. The color map showing increase in MTR@2ppm with 3TC concentration is presented in Figure 1D. Similar CEST effects were observed for FTC as shown in Figure 2. CEST effects of FTC were more prominent compared to 3TC (Figure 1B vs. Figure 2B) under similar experimental parameters. Further, in mice administered with 3TC, thalamus region of CNS was analyzed for in vivo evaluation of CEST effects. Obtained data was analyzed using Lorentzian functions, and CEST signal of amino protons of 3TC was detected at ~ 2 ppm on thalamus region (Figure 3A). Compared to baseline, CEST signals were higher at 5 days and 6 hours post-administration of 3TC (Figure 3A), signifying the measurement of CEST signal of 3TC in vivo. The CEST signal from baseline resulted from brain metabolites such as creatine and glutamate15,17. The integrals of the CEST signals in Figure 3A are shown in Figure 3B. The color maps of CEST signal integrals on thalamus are presented and superimposed on anatomical images in Figure 3C.DISCUSSION
Traditional theranostic technologies tag drugs with imaging agents or load drugs and agents into one nanoparticle enabling the detection using in vivo imaging. The limitations of the methods are obvious. First, the toxicity of the imaging agents has to be addressed. Second, the chemical properties of the drugs tagged with imaging agents may be altered. Third, the loading rate of nanoparticles are usually limited to achieve effective therapy and/or imaging sensitivity18. Compared to traditional theranostic technologies, CEST is an intrinsic property of an ARV, therefore no other chemical agents are required for its imaging. This eliminates the limitations associated with imaging agents including limited therapy effectiveness and imaging sensitivity, and possible toxicity.HIV theranostics benefits the research of antiretroviral therapy in many ways. First, it is now well accepted that long-acting ARVs could affect drug adherence and as such reduce viral transmission, prevent new infections, and limit the emergence of viral drug resistance6-9. In vivo imaging of long term pharmacokinetics and biodistribution is critical for the development of long-acting drugs. Second, even though ARVs have greatly reduced HIV viral load and helped prolong the life of infected patients, viral eradication has not been realized1-5. The viral reservoirs in the CNS elicits neuroimmune activation underlying HIV-associated neurocognitive disorders (HAND) ranging from asymptomatic neurocognitive impairment (ANI) and mild neurocognitive disorder (MND) to HIV-associated dementia (HAD)19-21. HIV theranostics will be a powerful tool for the development of treatment targeting the CNS reservoirs. Third, the off-target effects of ARVs on the CNS can be quite substantial22-24. HIV theranostics will help develop strategies to minimize the off-target effects.
Acknowledgements
This study was partially supported by Nebraska Research Initiative, NIH P01DA028555, R01MH121402, and P20GM103480-09.References
1. Henderson LJ, Reoma LB, Kovacs JA, Nath A. Advances toward Curing HIV-1 Infection in Tissue Reservoirs. Journal of virology. 2020;94(3).
2. Kramer-Hammerle S, Rothenaigner I, Wolff H, Bell JE, Brack-Werner R. Cells of the central nervous system as targets and reservoirs of the human immunodeficiency virus. Virus research. 2005;111(2):194-213.
3. Marban C, Forouzanfar F, Ait-Ammar A, et al. Targeting the Brain Reservoirs: Toward an HIV Cure. Frontiers in immunology. 2016;7:397-397.
4. Nath A. Eradication of human immunodeficiency virus from brain reservoirs. Journal of neurovirology. 2015;21(3):227-234.
5. Wong JK, Yukl SA. Tissue reservoirs of HIV. Current opinion in HIV and AIDS. 2016;11(4):362-370.
6. Dash PK, Gendelman HE, Roy U, et al. Long-acting nanoformulated antiretroviral therapy elicits potent antiretroviral and neuroprotective responses in HIV-1-infected humanized mice. Aids. 2012;26(17):2135-2144.
7. Dash PK, Kaminski R, Bella R, et al. Sequential LASER ART and CRISPR Treatments Eliminate HIV-1 in a Subset of Infected Humanized Mice. Nature communications. 2019;10(1):2753.
8. Canetti D, Spagnuolo V. An evaluation of cabotegravir for HIV treatment and prevention. Expert Opin Pharmacother. 2020:1-12.
9. Flexner C, Owen A, Siccardi M, Swindells S. LONG-ACTING DRUGS AND FORMULATIONS FOR THE TREATMENT AND PREVENTION OF HIV. Int J Antimicrob Agents. 2020:106220.
10. Kim M, Gillen J, Landman BA, Zhou J, van Zijl PC. Water saturation shift referencing (WASSR) for chemical exchange saturation transfer (CEST) experiments. Magnetic resonance in medicine. 2009;61(6):1441-1450.
11. Kim J, Wu Y, Guo Y, Zheng H, Sun PZ. A review of optimization and quantification techniques for chemical exchange saturation transfer MRI toward sensitive in vivo imaging. Contrast Media Mol Imaging. 2015;10(3):163-178.
12. Liu G, Song X, Chan KWY, McMahon MT. Nuts and bolts of chemical exchange saturation transfer MRI. NMR in biomedicine. 2013;26(7):810-828.
13. Liu Y, Kevadiya BD, Herskovitz J, Gendelman HE. Novel HIV Detection by Chemical Exchange Saturation Transfer (CEST). 2019 World Molecular Imaging Congress; September, 2019, 2019; Montreal, Canada.
14. McMahon MT, Gilad AA. Cellular and Molecular Imaging Using Chemical Exchange Saturation Transfer. Topics in magnetic resonance imaging : TMRI. 2016;25(5):197-204.
15. Vinogradov E, Sherry AD, Lenkinski RE. CEST: from basic principles to applications, challenges and opportunities. Journal of magnetic resonance (San Diego, Calif : 1997). 2013;229:155-172.
16. Zaiss M, Xu J, Goerke S, et al. Inverse Z-spectrum analysis for spillover-, MT-, and T1 -corrected steady-state pulsed CEST-MRI--application to pH-weighted MRI of acute stroke. NMR in biomedicine. 2014;27(3):240-252.
17. Pankowska A, Kochalska K, Lazorczyk A, et al. Chemical exchange saturation transfer (CEST) as a new method of signal obtainment in magnetic resonance molecular imaging in clinical and research practice. Polish journal of radiology. 2019;84:e147-e152.
18. Dreifuss T, Betzer O, Shilo M, Popovtzer A, Motiei M, Popovtzer R. A challenge for theranostics: is the optimal particle for therapy also optimal for diagnostics? Nanoscale. 2015;7(37):15175-15184.
19. Hong S, Banks WA. Role of the immune system in HIV-associated neuroinflammation and neurocognitive implications. Brain, behavior, and immunity. 2015;45:1-12.
20. Katuri A, Bryant J, Heredia A, Makar TK. Role of the inflammasomes in HIV-associated neuroinflammation and neurocognitive disorders. Experimental and Molecular Pathology. 2019;108:64-72.
21. Saylor D, Dickens AM, Sacktor N, et al. HIV-associated neurocognitive disorder--pathogenesis and prospects for treatment. Nat Rev Neurol. 2016;12(4):234-248.
22. Delicio AM, Lajos GJ, Amaral E, et al. Adverse effects of antiretroviral therapy in pregnant women infected with HIV in Brazil from 2000 to 2015: a cohort study. BMC Infect Dis. 2018;18(1):485-485.
23. Dorjee K, Baxi SM, Reingold AL, Hubbard A. Risk of cardiovascular events from current, recent, and cumulative exposure to abacavir among persons living with HIV who were receiving antiretroviral therapy in the United States: a cohort study. BMC Infect Dis. 2017;17(1):708-708.
24. Rather ZA, Chowta MN, Prakash Raju GJK, Mubeen F. Evaluation of the adverse reactions of antiretroviral drug regimens in a tertiary care hospital. Indian J Pharmacol. 2013;45(2):145-148.
Figures