1218
Characterization of a Novel Hypomyelination Mouse Model Using Microstructural Imaging of Myelin Volume Fraction and Axon g-ratio1McConnell Brain Imaging Centre, Montreal Neurological Institute and Hospital, Montreal, QC, Canada, 2Department of Neurology and Neurosurgery, McGill University, Montreal, QC, Canada, 3Techna Institute, University Health Network, Toronto, ON, Canada, 4Department of Human Genetics, McGill University, Montreal, QC, Canada, 5Russell H. Morgan Department of Radiology & Radiological Science, Johns Hopkins University, Baltimore, MD, United States, 6Gerald Bronfman Department of Oncology, McGill University, Montreal, QC, Canada, 7Department of Biomedical Engineering, McGill University, Montreal, QC, Canada
Synopsis
We investigated a novel mouse model of CNS hypomyelination using T2* weighted mGRE and diffusion weighted imaging. By integrating a recently developed method for MWF estimation from mGRE data (BSS-rPCA), we observed strong correlations between Mbp/Golli mRNA expression levels and MVF in select WM tracts in the brain. In addition, WM tract g-ratio values computed from BSS-rPCA MVF combined with NODDI-derived parameters were consistent with those found in the literature computed using differing methods. These results support integrating BSS-rPCA MWF estimates into quantitative microstructure evaluation workflows.
Introduction
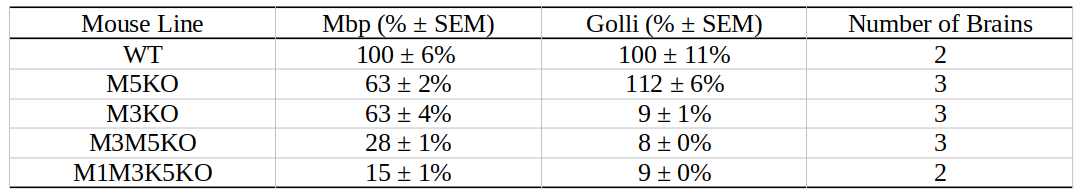
Well-characterized mouse models of central nervous system (CNS) hypomyelination constitute an invaluable resource for benchmarking imaging approaches to quantify myelin in the brain. By selectively deleting one or more of the M1, M3, and M5 transcription enhancer domains in the myelin basic protein(Mpb)/Golli locus, a graded hypomyelination signal can be achieved in the mouse CNS.1 The resulting relative decrease in Mbp/Golli mRNA expression achieved in this way is summarized in Table 1. In this study, we investigated the application of a recently developed, blind-source separation robust principal component analysis (BSS-rPCA) to gradient echo-based myelin water imaging of the aforementioned Mbp knockout (Mbp KO) hypomyelination mouse model.2 BSS-rPCA estimates myelin water fraction in brain tissue by separating the fast decaying, myelin water T2* component from the remaining intra/extra-cellular water and artefactual noise signals. It represents a valuable method for ex-vivo myelin water fraction (MWF) imaging given the shortened T2* of myelin water in fixed brain tissue.3 In addition, we investigate BSS-rPCA within the context of the MRI g-ratio paradigm.4 This was done by combining MWF estimates from BSS-rPCA with axon water fraction (AWF) estimates obtained by fitting the neurite orientation dispersion and density (NODDI)5 model to diffusion weighted data acquired from the Mbp KO hypomyelinated mouse brain.Methods
Gluteraldehyde fixed brains of 13 adult mice (P30) were used in this study. The number of brains corresponding to each enhancer KO line is detailed in Table 1. All imaging was performed using the Bruker (Rheinstetten, Germany) Pharmascan 7T MRI system. Diffusion weighted volumes (b-values: 30 directions at 2500 s/mm2; 60 directions at 4000 s/mm2; matrix size 80x64x90; 150 um isotropic spatial resolution) were acquired using a custom diffusion-weighted gradient and spin echo (dwGRASE) sequence.6 Multi-exponential T2* weighted volumes (2 msec first echo time and 2 ms echo spacing; 24 echoes; matrix size of 135x106x120; 100 um isotropic spatial resolution) were acquired using a 3D multi-echo gradient recalled echo (mGRE) sequence. Whole brain MWF maps were reconstructed using the BSS-rPCA method.2 These were converted to myelin volume fraction (MVF) maps using a previously-described volumetric model of white matter.7 The NODDI model (Din=0.75x10⁻³mm2/s; Diso=2.0x10⁻³mm2/s) was implemented using AMICO software.8,9 In combination with MVF, NODDI-derived parameter maps were used to compute whole brain axon volume fraction (AVF) and g-ratio maps.10 AVF, MVF, and g-ratio maps were then registered to a high resolution (matrix size of 315x478x241; 40 um isotropic) anatomical atlas11 using linear affine registration followed by non-linear symmetric diffeomorphic registration.12 The resulting registered image volumes were used for region of interest (ROI) analysis. Anterior commissure (AC), internal capsule (IC), and splenium of the corpus callosum (CC) ROI masks were obtained using semi-automated segmentation using ITK-SNAP [13]. Finally, Pearson’s correlation coefficient was computed to evaluate the quantitative relationship between Mbp/Golli mRNA accumulation and MVF within the chosen ROIs.Results and Discussion
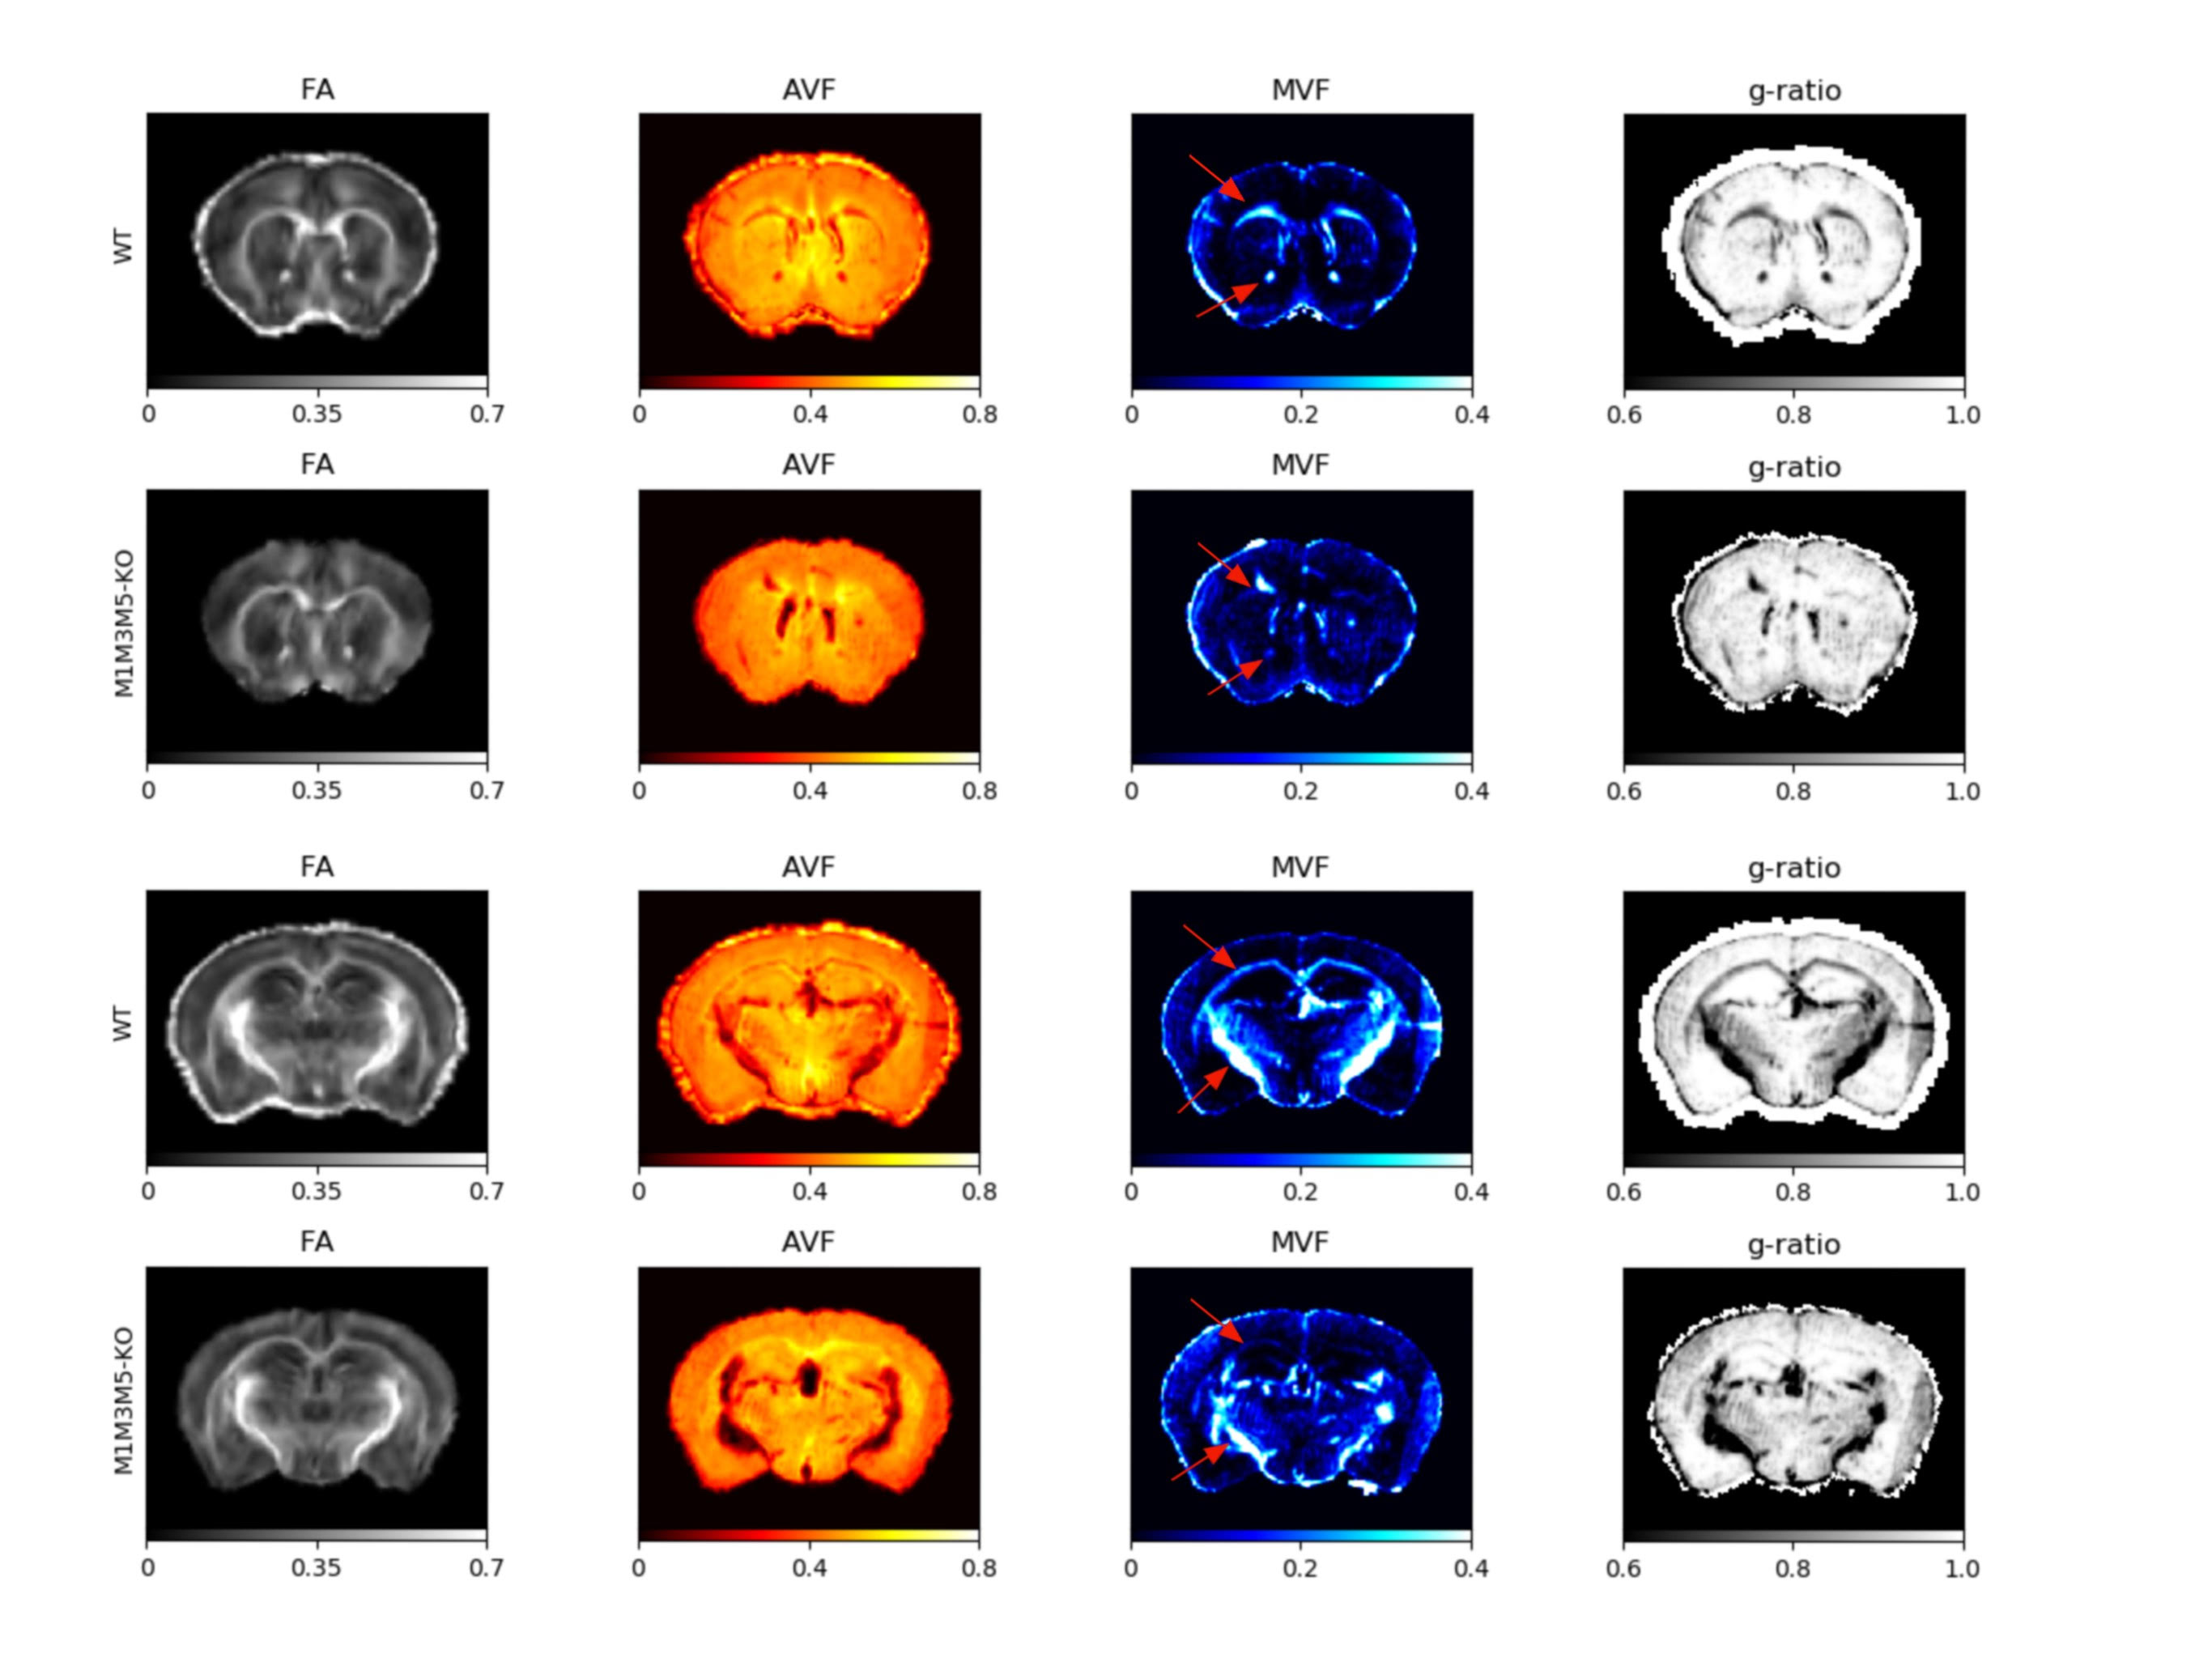
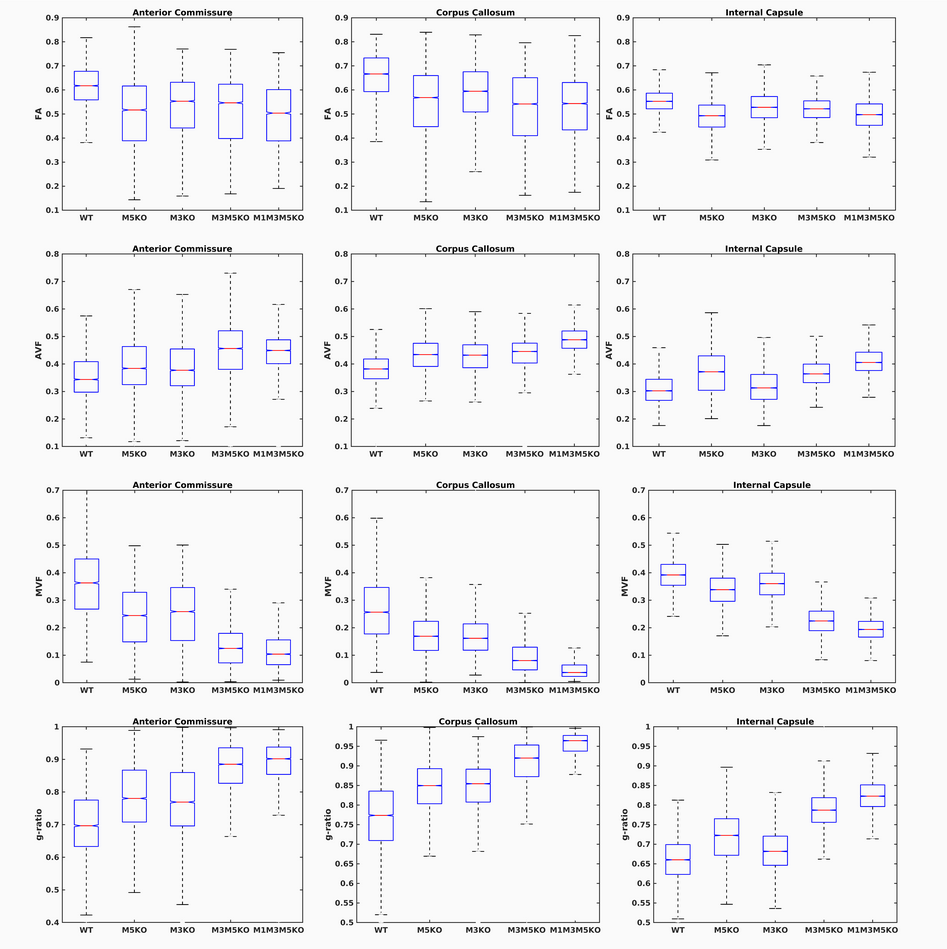
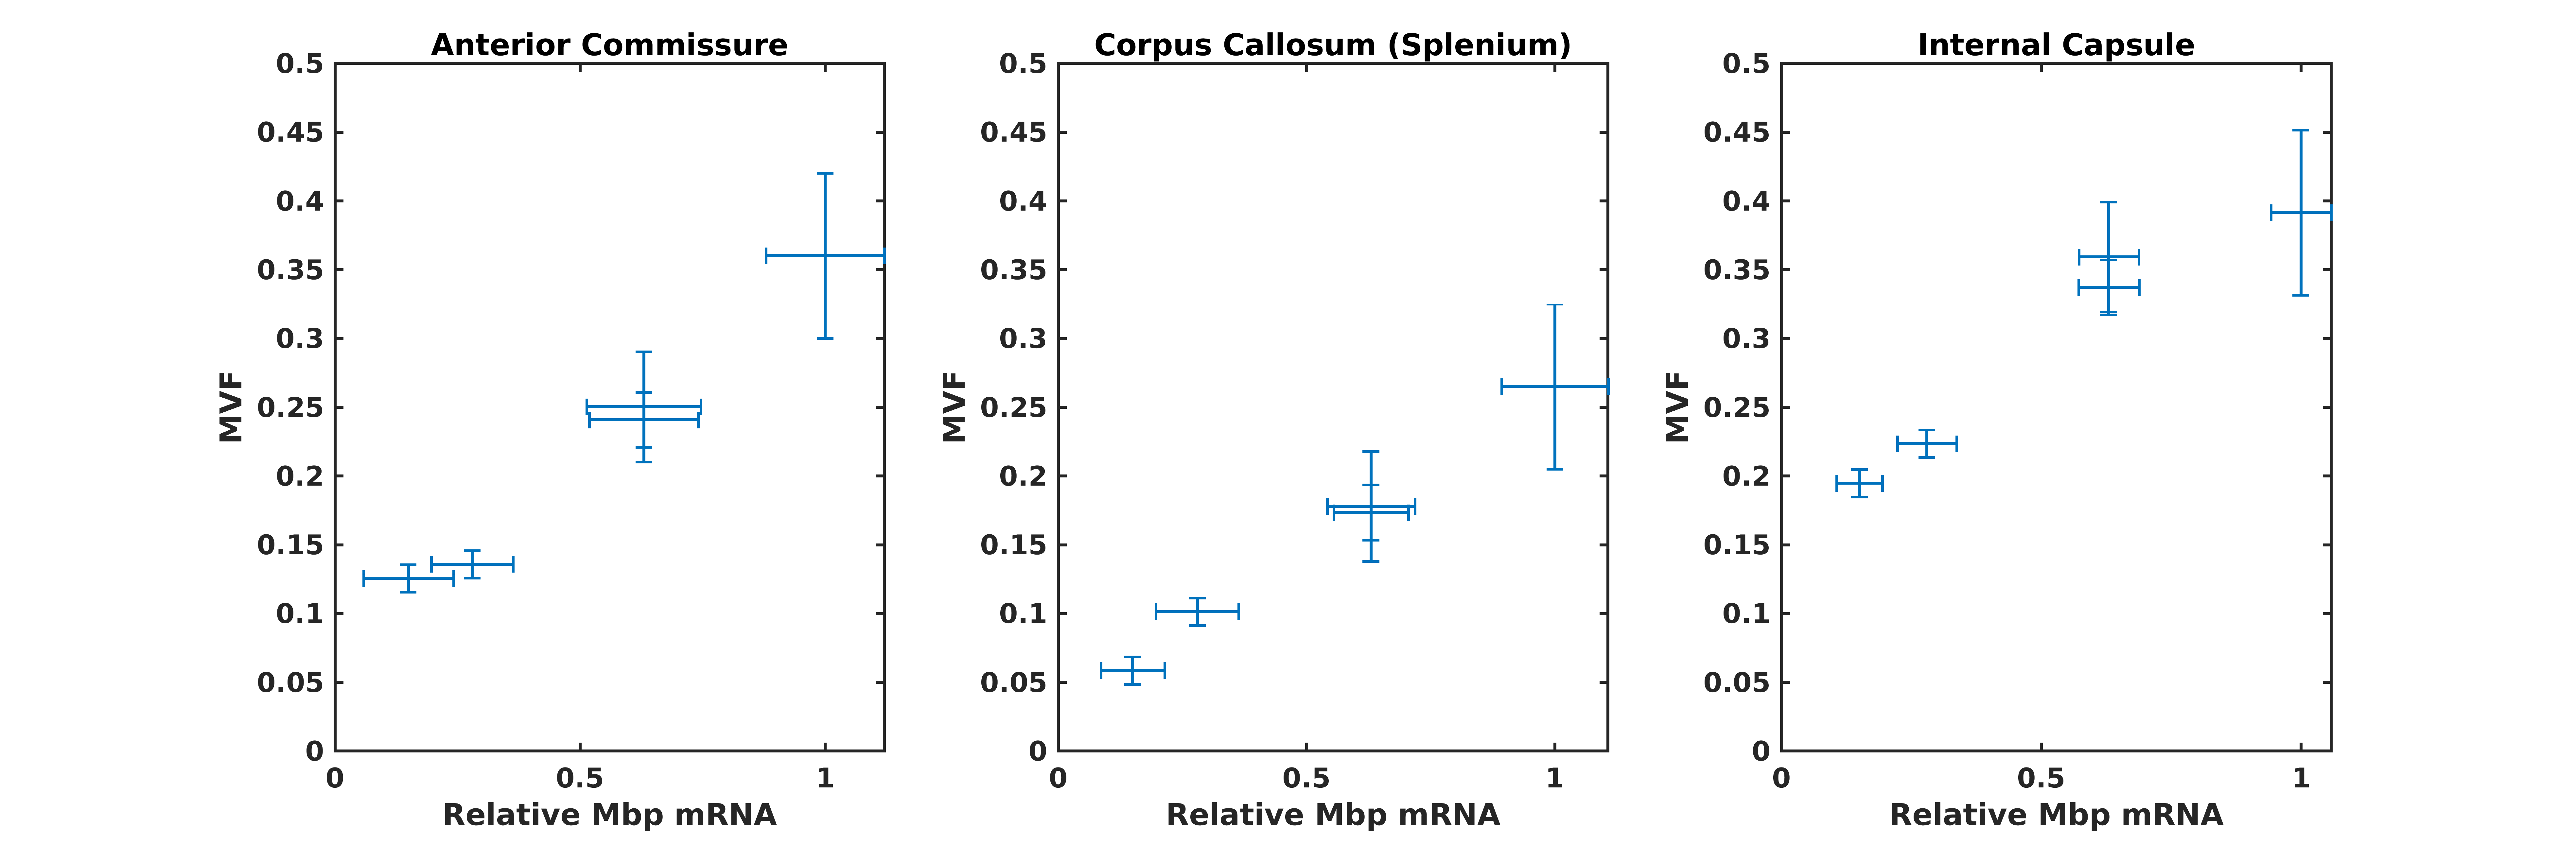
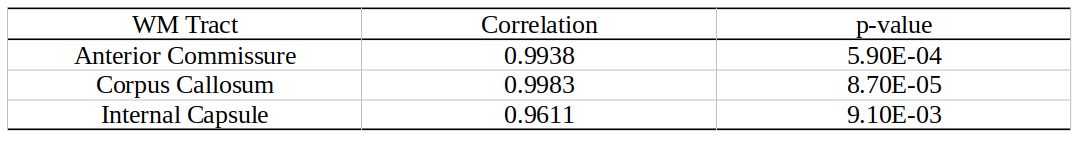
Whole brain parameter maps of AVF, MVF, and g-ratio were computed for all enhancer knockout mouse lines. When comparing coronal MVF slices calculated from the wild-type and the most severely hypomyelinated (M1M3M5KO) brains, a pronounced decrease in white matter (WM) tract myelination is evident from visual inspection (Figure 1). High fractional anisotropy (FA) values were observed in major white matter tracts of all genotypes reflecting the limited sensitivity of FA to microstructural changes in the hypomyelinating mouse lines. Decreased MVF with decreasing Mbp/Golli transcription was evident in all WM tract ROIs. Since AVF and g-ratio are mathematically dependent on MVF, the opposite trend was observed in those parameter maps (Figure 2). The Wilcoxon rank sum z-statistic in MVF between WT and M1M3M5KO brains evaluated to 49.7, 75.4, and 80.7 in the AC, CC, and IC respectively, indicating a large difference based on the underlying distributions of voxel values. There was a strong linear correlation between Mbp/Golli mRNA expression and MVF in white matter ROIs. Specific Pearson’s linear correlation coefficients relating mRNA expression to MVF are shown in Table 2 and the data is plotted in Figure 3. Our g-ratio estimates are in line with those reported in previous literature.10 It should be noted, however, that our study used multi-exponential T2* decay and BSS-rPCA to measure MWF, rather than more conventional CPMG-based MWF approaches.10 This encouraging result supports the integration of BSS-rPCA derived MWF maps for ultra-high resolution mapping of MVF in pre-clinical models of human neurological disorders. Moreover, it supports the concept that multi-exponential T2* decay mapping may represent a surrogate method for high resolution myelin water imaging and voxel g-ratio estimation.Conclusion
MRI microstructure-based characterization of a novel hypomyelination mouse model with selective deletion of Mbp transcription enhancer domains revealed tract-specific reductions in MVF associated with more the severe hypomyelination phenotypes included in our study (M3M5KO and M1M3M5KO enhancer lines). Reductions in MVF in selected tracts were paralleled by corresponding increases in the voxel-averaged g-ratio calculated from MRI. The findings of our work support Mbp mRNA level as a very important determinant of myelin bilayer formation. Our study also provides evidence that multi-exponential T2* decay-based MWF mapping using BSS-rPCA is a robust alternative for high resolution myelin water and voxel g-ratio quantification in pre-clinical models.Acknowledgements
The authors gratefully acknowledge the support of the McConnell Brain Imaging Centre staff and funding for the study from the NSERC Discovery Grant of Dr. David Rudko.References
1. Bagheri H, Friedman H, Siminovitch KA, and Peterson AC.
Transcriptional regulators of the Golli/myelin basic protein locus
integrate additive and stealth activities. PloS Genet. 2020;
16(8):e1008752.
2. Song JE, Shin J, Lee H, Lee HJ, Moon WJ, and Kim DH. Blind source separation for myelin water fraction mapping using multi-echo gradient echo imaging. IEEE Trans Med Imaging. 2020; 39(6):2235-2245.
3. Shatil AS, Uddin MN, Matsuda KM, and Figley CR. Quantitative ex-vivo MRI changes due to progressive formalin fixation in whole human brain specimens: longitudinal characterization of diffusion, relaxometry, and myelin water fraction measurements at 3T. Frontiers in Medicine. 2018.
4. Stikov N et al. In vivo histology of the myelin g-ratio with magnetic resonance imaging. Neuroimage. 2015; 118:397-405
5. Zhang H, Schneider T, Wheeler-Kingshott CA, and Alexander DC. NODDI: practical in vivo neurite orientation dispersion and density imaging of the human brain. Neuroimage. 2012; 16;61(4):1000-16.
6. Wu D, Xu J, McMahon MT, van Zijl PCM, Mori S, Northington FJ, and Zhang J. In vivo high-resolution diffusion tensor imaging of the mouse brain. Neuroimage. 2013; 83: 18-26.
7. West KL, Kelm ND, Carson RP, Gochberg DF, Ess KC, and Does MD. Myelin volume fraction imaging with MRI. Neuroimage. 2018; 182:511-521.
8. Wang N, Zhang J, Cofer G, Qi Y, Anderson RJ, White LE, and Johnson GA. Neurite orientation dispersion and density imaging of mouse brain microstructure. Brain Structure and Function. 2019; 224:1797-1813.
9. Daducci A, Canales-Rodriguez EJ, Zhang H, Dyrby TB, Alexander DC, and Thiran JP. Accelerated microstructure imaging via convex optimization (AMICO) from diffusion MRI data. Neuroimage. 2015; 105:32-44.
10. West KL, Kelm ND, Carson RP, Alexander DC, Gochberg DF, and Does MD. Experimental studies of g-ratio in ex vivo mouse brain. Neuroimage. 167:366-371.
11. Dorr-Steadman-Ullman-Richards-Qui-Egan (40 micron DSURQE) atlas (2016); Mouse Imaging Center, Toronto, Ontario, Canada. Retrieved from https://wiki.mouseimaging.ca/display/MICePub/Mouse+Brain+Atlases
12. Avants BB, Tustison N, and Song, G. (2011). Advanced Normalization Tools (ANTS), 1-35.
13. Yushkevich PA, Piven J, Hazlett HC, Gimpel Smith R, Ho S, Gee JC, and Gerig G. User-guided 3D active contour segmentation of anatomical structures: Significantly improved efficiency and reliability. Neuroimage. 2006; 31(3):1116-28.
Figures