1217
CNS Involvement in a Non-human Primate Model Infected with Aerosolized Ebola Virus
Byeong-Yeul Lee1, Jeffrey M. Solomon2, Marcelo Castro1, Dong-Yun Kim3, Joseph Laux1, Matthew G. Lackemeyer1, Jordan K. Bohannon4, Anna N. Hanko5, Dima Hammoud6,7, and Ji Hyun Lee1
1Integrated Research Facility at Fort Detrick, National Institute of Allergy and Infectious Diseases, National Institutes of Health, Frederick, MD, United States, 2Clinical Monitoring Research Program Directorate, Frederick National Laboratory for Cancer Research sponsored by the National Cancer Institute, Frederick, MD, United States, 3Office of Biostatistics Research, National Heart, Lung and Blood Institute, Bethesda, MD, United States, 4National Biodefense Analysis and Countermeasures Center, Frederick, MD, United States, 5Microbiology, Boston University School of Medicine, Boston, MA, United States, 6Radiology and Imaging Sciences, Clinical Center, National Institutes of Health, Bethesda, MD, United States, 7Center for Infectious Disease Imaging, National Institutes of Health, Bethesda, MD, United States
1Integrated Research Facility at Fort Detrick, National Institute of Allergy and Infectious Diseases, National Institutes of Health, Frederick, MD, United States, 2Clinical Monitoring Research Program Directorate, Frederick National Laboratory for Cancer Research sponsored by the National Cancer Institute, Frederick, MD, United States, 3Office of Biostatistics Research, National Heart, Lung and Blood Institute, Bethesda, MD, United States, 4National Biodefense Analysis and Countermeasures Center, Frederick, MD, United States, 5Microbiology, Boston University School of Medicine, Boston, MA, United States, 6Radiology and Imaging Sciences, Clinical Center, National Institutes of Health, Bethesda, MD, United States, 7Center for Infectious Disease Imaging, National Institutes of Health, Bethesda, MD, United States
Synopsis
We performed a quantitative neuroimaging study to determine central nervous system involvement following exposure with Ebola virus (EBOV) variant Makona via the aerosolized route in a rhesus monkey model. Using MR relaxometry, we found increases in T1 and R2* values in multiple brain regions. Notably, R2* changes corresponding to the deep cerebral venous system highly correlated with viral loads in CSF. These results provide in vivo evidence of brain involvement with EBOV and emphasize the potential of advanced imaging techniques to better understand the pathophysiology of organ involvement in various infectious diseases, including the brain.
Introduction
Ebola virus disease (EVD) is a severe and often lethal disease caused by Ebola virus (EBOV) 1. Despite reports of headaches, cognitive impairment, hypoactivity or hyperactivity in EVD patients 2, there is little in vivo neuroimaging evidence to support central nervous system (CNS) involvement. Characterization of CNS pathophysiology in the setting of EBOV infection is necessary to better understand the long term sequelae of the infection in survivors. Using quantitative T1 and R2* relaxometry techniques, we evaluated brain changes in a small-particle aerosol nonhuman primate model of EVD. Quantitative Imaging findings were then correlated with plasma, brain tissue, and cerebral spinal fluid (CSF) viral load.Methods
Magnetic resonance (MR) imaging was performed on an Achieva 3.0T clinical MR scanner (Philips Healthcare, Cleveland, OH, USA) equipped with an 8-channel pediatric neuro-spine coil. A total of seven rhesus macaques (6.93±3.78 yr; two males, five females) were studied. All animals were exposed via small-particle aerosol to an EBOV Makona variant (particle size range 0.5–3.0 µm, averaged inhaled dose 1,150 plaque-forming units). Subjects were intubated, immobilized using isoflurane, and positioned supine on the scanner bed. For quantitative assessment of the acute viral effect on MR signal changes, MR images were obtained prior to and 8-9 days following exposure. Plasma, brain tissue, and CSF viral loads were measured using real-time reverse transcription polymerase chain reaction (RT-qPCR).Image Acquisition
T1-weighted (T1w) anatomical whole-brain images were acquired using a magnetization‑prepared rapid gradient echo (MP-RAGE) sequence (Repetition time (TR) = 9.8 ms, echo time (TE) = 4.7 ms, Inversion time (TI) = 1,100 ms, flip angle (FA) = 8°, resolution = isotropic 0.5 mm, 2 average, field-of-view (FOV) = 96 mm x 96 mm x 68 mm, and acquisition time = 4.5 min). For T1 measurement, a fast field echo (FFE) sequence with a dual-flip-angle method 3 was performed (TR/TE = 27 ms/3.4 ms, FA 1/FA 2 = 5°/27°, resolution = isotropic 0.5 mm, 1 average, 136 slices, acquisition time = 12 min). For R2* measurement, T1w FFE sequence was performed (TR/TE = 27 ms/34 ms, FA = 5°, resolution = isotropic 0.5 mm, 1 average, and acquisition time = 6 min), and principles of echo shifting with R2* (PRES R2*) in combination with T1 imaging data (FA=5°) was used to create R2* maps.
Image Processing and Statistical Analysis
For the quantitative analysis, all MR images were processed using an in-house built pipeline, comprising non-linear image registration to an INIA19 template, skull stripping, Gaussian smoothing (1.5 mm full width at half maximum (FWHM)), and voxel-based statistical analysis within a general linear model. A paired t-test was applied for group differences between pre-and post-EBOV exposure and the false discovery rate was applied for correcting multiple comparisons. A statistical significance was considered at p < 0.05. Finally, Pearson correlation (r) was used to examine the relationship between quantitative MR results and viral RNA load.
Results
Comparison of the averaged pre-exposure and post-exposure T1 maps (n = 7) (Fig. 1) showed increasing T1 values in multiple brain regions, including the cerebellum, occipital lobe, and frontal cortex, which was confirmed by voxel-based whole-brain analysis (p < 0.005, Fig. 2). The averaged R2* maps (n = 7) showed increased values post-exposure compared to pre-exposure (Fig. 3). Voxel-based R2* analysis displayed a widespread increase in R2* values (Fig. 4), including gray matter, white matter, and ventricles. Viral RNA was detected in brain tissue samples, CSF, and plasma (Fig 5). R2* changes overlapping the central venous system were positively correlated with the viral load in CSF (r = 0.79, p = 0.018, Fig. 5).Discussion and Conclusion
We demonstrated acute alterations of quantitative T1 and R2* values in rhesus macaque brain 8–9 days after small-particle aerosol exposure to EBOV. Several pathological EVD features may cause a change in brain tissue characteristics, contributing to T1 and R2* changes. Pathological features contributing to the T1 changes may include endothelial injury and edema induced by EBOV infection 4. The significant R2* elevation after infection may reflect the altered microenvironment in the brain tissue, such as accumulation of iron-containing although it’s more likely those changes are due to venous congestion (data not shown here). In line with the increased viral load in brain tissue samples, CSF, and plasma, a significant correlation between the central venous R2* changes and the CSF viral load reinforces in vivo imaging evidence of CSF involvement proportional to disease severity. Taken together, these results present evidence of CNS involvement in EBOV infection and provide new insights into the pathogenesis of aerosol-induced EBOV disease.Acknowledgements
The authors thank David Thomasson and Margaret Lentz and the Integrated Research Facility at Fort Detrick (IRF-Frederick) team for their support. With the U.S. National Institute of Allergy and Infectious Diseases (NIAID), this work was supported in part through the prime contract of Laulima Government Solutions, LLC, under contract (HHSN272201800013C), Tunnell Government Services, a subcontractor of Laulima Government Solutions, LLC under contract (HHSN272201800013C), and Battelle Memorial Institute’s former prime contract under contract (HHSN272200700016I). This work was further supported in part by federal funds from the National Cancer Institute and National Institutes of Health (NIH) under contract (75N91019D00024, Task Order no. 75N91019F00130). The content of this publication does not necessarily reflect the views or policies of the U.S. Department of Health and Human Services or of the institutions and companies affiliated with the authors, nor does mention of trade names, commercial products, or organizations imply endorsement by the U.S. Government.References
1. Jacob ST, Crozier I, Fischer WA, 2nd, et al. Ebola virus disease. Nat Rev Dis Primers. 2020;6(1):13.2. Chertow, D.S., et al., Ebola Virus Disease in West Africa - Clinical Manifestations and Management. New England Journal of Medicine, 2014. 371(22): p. 2054-2057.
3. Deoni SC, Peters TM, Rutt BK. High-resolution T1 and T2 mapping of the brain in a clinically acceptable time with DESPOT1 and DESPOT2. Magn Reson Med. 2005;53(1):237-241.
4. Fu, Y., K. Tanaka, and S. Nishimura, Evaluation of brain edema using magnetic resonance proton relaxation times. Adv Neurol, 1990. 52: p. 165-76
Figures
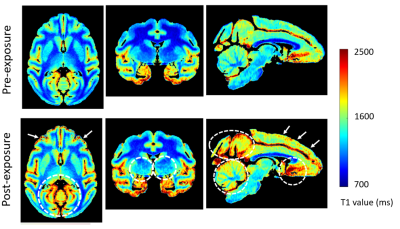
Figure 1. Averaged T1 map (n=7) of the rhesus macaque brain before and
after EBOV exposure: Compared to pre-exposure (top row), the post-exposure T1
map (bottom row) showed noticeable increases in multiple regions, including cerebellum, occipital lobes, deep gray matter, and frontal cortices (white
arrows and dotted circles).
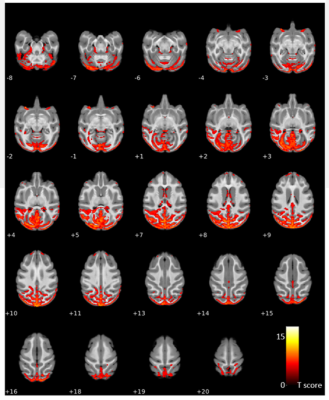
Figure
2. A voxel-based statistical comparison of T1 of the rhesus macaque brain
before and after EBOV exposure: There were significant increases in T1 values in
various brain regions, in particular in the cerebellum and occipital lobes. Statistical
significance was considered at corrected p < 0.001 (one-tailed
paired t-test, false discovery rate correction). The colorbar shows a T-score range.
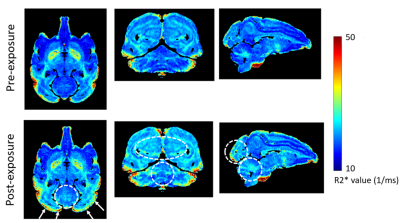
Figure 3. Averaged R2* map (n=7) of the rhesus macaque brain
before and after EBOV exposure: Compared to pre-exposure (top panel), there was
an increase in R2* values post-exposure (bottom row) mainly seen in the cerebellum
and occipital lobes (white arrows and dotted circles).
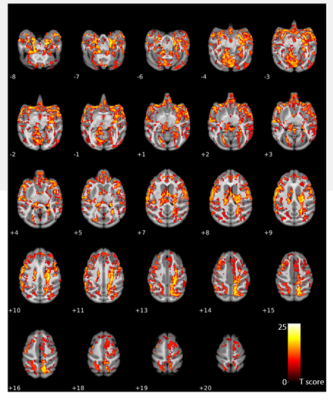
Figure
4. A voxel-based statistical comparison of R2* of the rhesus macaque brain
before and after EBOV exposure: There was a widespread increase in R2* values in
multiple brain regions. Statistical significance was considered at corrected p
< 0.001 (one-tailed paired t-test, false discovery rate correction). The colorbar shows a T-score range.
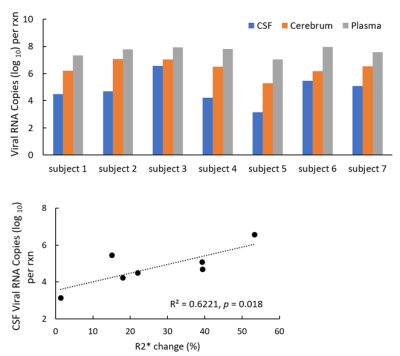
Figure
5. Viral load analysis (top) and correlation (bottom). The top panel shows an
increased concentration of EBOV RNA in the cerebral spinal fluid (CSF), cerebrum,
and plasma. The R2* changes corresponding to the deep cerebral venous system (% = (post-infection –
pre-infection)/pre-infection x 100) highly correlated with viral loads in CSF (r = 0.79, p = 0.018).