1216
Validation of OxFlow Measurements of Whole-Brain CBF, OEF and CMRO2 by Simultaneous PET/MRI
Lucas Narciso1,2, Tracy Ssali1,2, Linshan Liu1, Heather Biernaski1, John Butler1, Laura Morrison1, Jennifer Hadway1, Jeffrey Corsaut1, Justin W. Hicks1, Michael C. Langham3, Felix W. Wehrli3, Hidehiro Iida4, and Keith St Lawrence1,2
1Lawson Health Research Institute, London, ON, Canada, 2Department of Medical Biophysics, Western University, London, ON, Canada, 3University of Pennsylvania Perelman School of Medicine, Philadelphia, PA, United States, 4University of Turku and Turku PET Centre, Turku, Finland
1Lawson Health Research Institute, London, ON, Canada, 2Department of Medical Biophysics, Western University, London, ON, Canada, 3University of Pennsylvania Perelman School of Medicine, Philadelphia, PA, United States, 4University of Turku and Turku PET Centre, Turku, Finland
Synopsis
OxFlow is a non-invasive MRI method for measuring whole-brain oxidative metabolism. This study presents its validation in an animal model by comparing to a PET-only method, as well as its sensitivity to alterations in cerebral metabolism. Strong correlations were observed between measurements from the MRI and PET techniques, with no significant differences. Furthermore, OxFlow proved sensitive to changes in metabolism induced by an increase in anesthetics.
Introduction
The cerebral metabolic rate of oxygen (CMRO2) is an important metric of brain health given the brain’s high metabolic rate – 20% of whole-body oxygen utilization – and lack of energy stores. Positron emission tomography (PET) remains the gold standard for imaging CMRO2; however, the lengthy and invasive procedure requires a minimum of two tracers ([15O]oxygen to image the cerebral oxygen extraction fraction (OEF) and [15O]water to image the cerebral blood flow (CBF)) in addition to invasive arterial sampling1. Non-invasive magnetic resonance imaging (MRI) techniques have been proposed as alternatives by taking advantage of the magnetic properties of blood2,3.The MRI technique known as OxFlow (oxygenation and flow2) measures whole-brain (WB) CMRO2 by combining measurements of CBF from the feeding arteries with venous oxygen saturation (SvO2) measured in the superior sagittal sinus (SSS). OxFlow can be acquired with scan times as short as 8 seconds and has a reproducibility of 2% for SvO2 and 6% for WB CMRO24. However, OxFlow measurements have yet to be compared to PET methods. Thus, the aim of this study was to validate OxFlow on a hybrid PET/MRI scanner that enabled simultaneous PET measurements. Additionally, the OxFlow sensitivity to anesthetics-driven changes in metabolism was evaluated.
Methods
PET and MRI data from eight juvenile pigs (age range 8-10 weeks; weight, 19 ± 2 kg; 5 female) were collected on a 3 T Siemens Biograph mMR system using a 12-channel PET-compatible receiver head coil (Siemens GmbH). Animals were anesthetized with 3% isoflurane and 6 mL/kg/min propofol infusion rate. PET imaging involved injecting [15O]H2O (470 ± 60 MBq) to measure CBF, followed by inhalation of [15O]O2 (2,200 MBq) to measure OEF. For DBFM, arterial input functions were determined by continuously withdrawing blood from a femoral artery and measuring the activity using an MR-compatible system (Swisstrace GmbH). Both 5-min long PET acquisitions were reconstructed into dynamic images. Standard PET image corrections were applied. CBF measurements were obtained by fitting the one-tissue compartment model to WB [15O]H2O time activity curves, while WB OEF estimates were obtained with dual-basis function method (DBFM), as described by Kudomi et al.5 Finally, CMRO2 was determined as the product of CBF, OEF and the arterial content of oxygen (CaO2).Concurrent to PET, WB CMRO2 was obtained by the MRI-sequence OxFlow2 (TR, 35ms; TE, 7.025 ms; DTE, 2.5 ms; α, 25º; FoV, 208×208 mm; voxel size, 1.6×1.6×5.0 mm3), which combines phase-contrast MRI measurements4 of CBF ($$$f_{wb}$$$) from the internal carotid arteries (ICA) and basilar artery (BA), with SvO2 measurements from the SSS acquired with susceptibility-based oximetry3. OxFlow data were analyzed following the approach outlined by Jain et al.3 Briefly, regions-of-interest were semi-automatically drawn in and surrounding the vessels on the magnitude image (Fig. 1A and C), transferred to the phase image (Fig. 1B and D) to measure the mean phase difference in the feeding arteries, and between the SSS and the surrounding tissue to determine SvO2.3 WB-CMRO2 was calculated as $$$CMRO_{2_{wb}}=C_aO_2\cdot f_{wb} \left( \frac{S_aO_2-S_vO_2}{S_aO_2} \right)$$$, where the arterial saturation of oxygen (SaO2) was determined from the partial pressure of oxygen.6 All values were averaged from two acquisitions. OxFlow measurements were repeated after an increase of propofol infusion rate to 20 mL/kg/min.
Results
Mean WB estimates of CBF, OEF and CMRO2 from OxFlow were 54.1 ± 16.7 mL/100g/min, 0.30 ± 0.09 and 1.78 ± 0.27 mLO2/100g/min, respectively, which were in good agreement with the DBFM values (55.3 ± 20.0 mL/100g/min, 0.31 ± 0.09, and 1.86 ± 0.31 mLO2/100g/min, respectively), with no significant differences between techniques. Intraclass correlation coefficients were obtained to assess data reliability, and values of 0.94, 0.99 and 0.77 were obtained for WB CBF, OEF and CMRO2 measurements, respectively. Linear regression (Fig. 2A-C) indicated a significant correlation for WB CBF, OEF and CMRO2 when comparing the two techniques, with Pearson correlation coefficients of 0.95 (p < 0.01), 0.93 (p < 0.01) and 0.79 (p < 0.02), respectively. Fig. 2D-F show significant changes in WB CBF, OEF and CMRO2 with the increase in anesthetics.Discussion and Conclusion
The current study presents the first simultaneous comparison of OxFlow to [15O]H2O and [15O]O2 PET, which is a non-invasive, rapid MRI method for tracking dynamic changes in cerebral oxidative metabolism. Good agreement and significant correlation between measurements from the two techniques were found, and OxFlow was able to detect anesthetics-induced changes in metabolism. The present observations are in accordance with two recent studies comparing MR measurements of SvO2 to either PET or direct measures of venous oxygenation from the jugular blub7,8. Furthermore, these results indicate that MRI oximetry could be used to calibrate PET/MR methods of imaging CBF9 and CMRO210. This hybrid approach retains the ability of PET to directly measure OEF, while substantially reducing the invasiveness and complexity of PET-only methods.Acknowledgements
This work was supported by the Canadian Institutes of Health Research (grant 148600).References
- Mintun M, Raichle ME, Martin WR, et al. Brain oxygen utilization measured with O-15 radiotracers and positron emission tomography. J Nucl Med 1984; 25: 177–87.
- Wehrli FW, Rodgers ZB, Jain V, et al. Time-resolved MRI oximetry for quantifying CMRO2 and vascular reactivity. Acad Radiol 2014; 21: 207–214.
- Jain V, Langham MC, Wehrli FW. MRI estimation of global brain oxygen consumption rate. J Cereb Blood Flow Metab 2010; 30: 1598–607.
- Barhoum S, Langham MC, Magland JF, et al. Method for rapid MRI quantification of global cerebral metabolic rate of oxygen. J Cereb Blood Flow Metab 2015; 35: 1616–1622.
- Kudomi N, Hirano Y, Koshino K, et al. Rapid quantitative CBF and CMRO2 measurements from a single PET scan with sequential administration of dual 15O-labeled tracers. J Cereb Blood Flow Metab 2013; 33: 440–448.
- Severinghaus JW. Simple, accurate equations for human blood O2 dissociation computations. J Appl Physiol Respir Environ Exerc Physiol. Epub ahead of print 1979. DOI: 10.1152/jappl.1979.46.3.599.
- Miao X, Nayak KS, Wood JC. In vivo validation of T2- and susceptibility-based SvO2 measurements with jugular vein catheterization under hypoxia and hypercapnia. Magn Reson Med 2019; 82: 2188–2198.
- Jiang D, Deng S, Franklin CG, et al. Validation of T2-based oxygen extraction fraction measurement with 15O positron emission tomography. Magn Reson Med 2020; 00: 1–8.
- Ssali T, Anazodo UC, Thiessen JD, et al. A noninvasive method for quantifying cerebral blood flow by hybrid PET/MRI. J Nucl Med 2018; 59: 1329–1334.
- Narciso L, Ssali T, Anazodo UC, et al. Initial assessment of a reference-based non-invasive hybrid PET/MRI method for imaging CMRO2. In: Brain PET Poster Sessions PP01-M01 to PP02-N07. Yokohama, 2019, pp. 572–573.
Figures
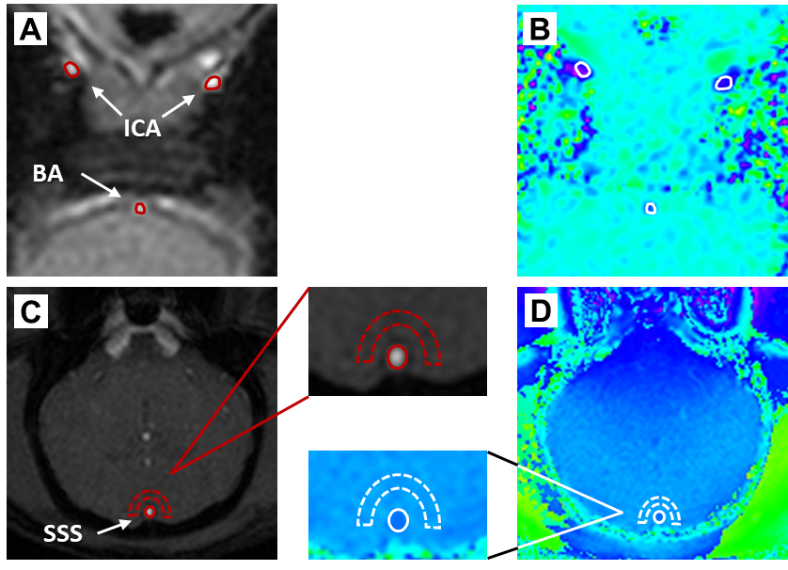
Figure
1. Magnitude and phase images from the slices used
to estimate (A)-(B) WB CBF and (C)-(D) SvO2. The regions-of-interest
(red dashed) were transferred from the magnitude to the phase image (in white).
Images are from one representative animal.
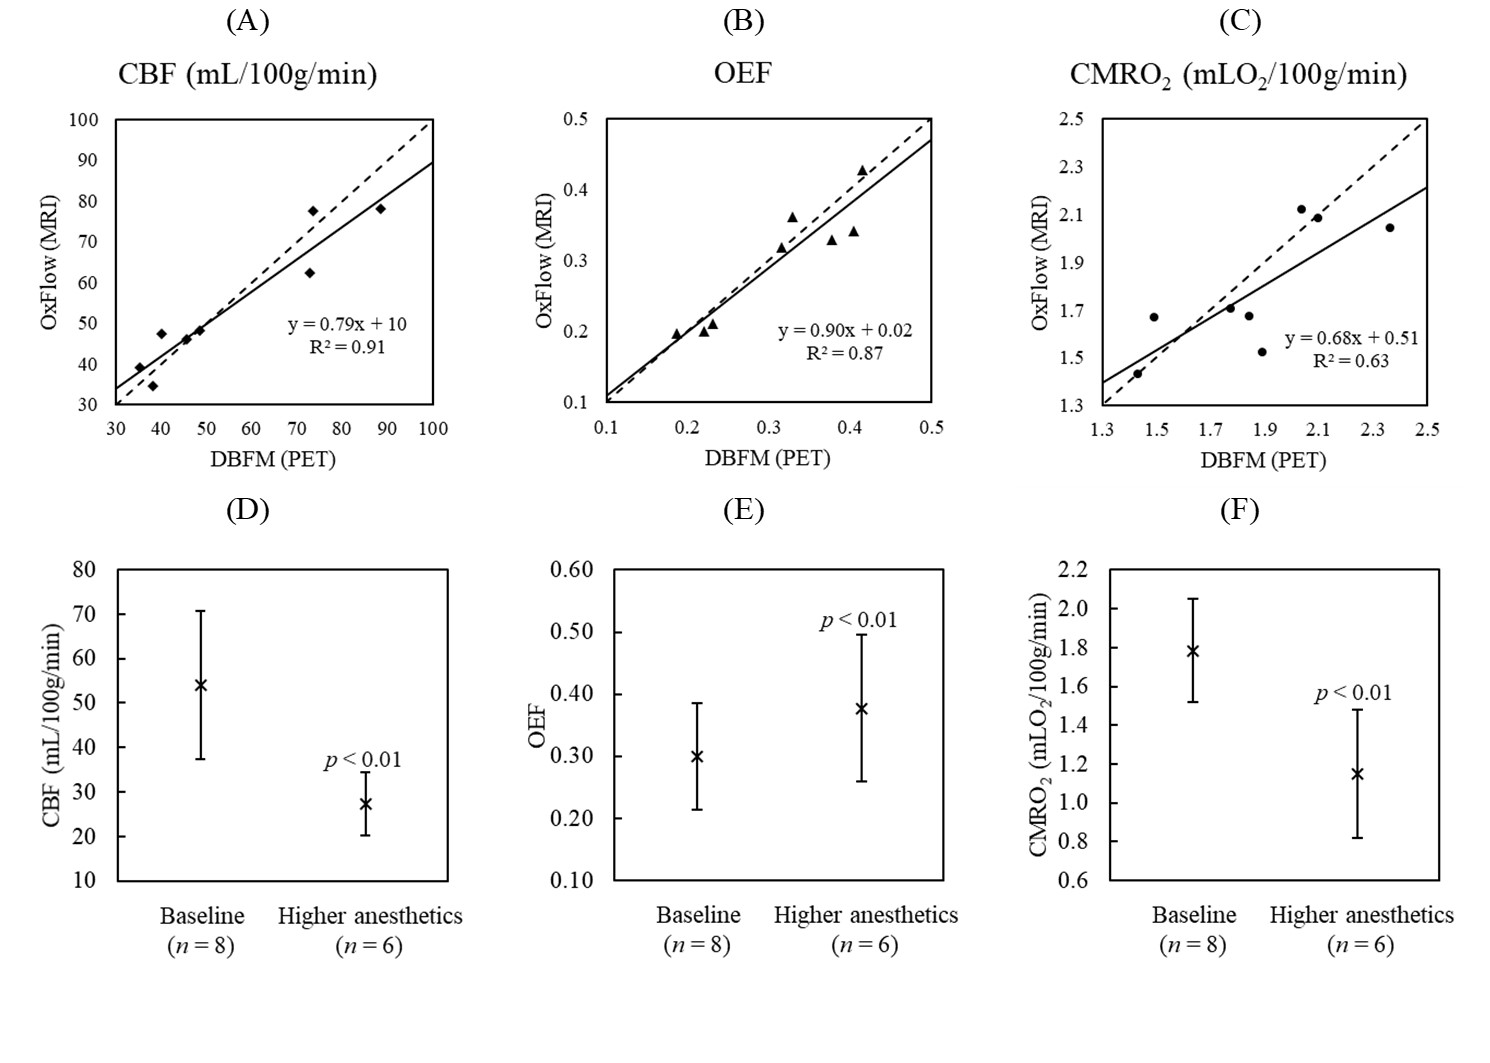
Figure
2. Comparison between (A) CBF, (B) OEF and (C) CMRO2
estimates from DBFM (PET-only technique) and OxFlow (n = 8). No significant difference was observed for all
three measurements. The dashed and solid lines represent the identify and
regression lines, respectively. A significant anesthetics-induced reduction in
(D) WB CBF (27.3 ± 7.0 mL/100g/min) was accompanied by an
increase in (E) WB OEF (0.38 ± 0.12), resulting in a significant
decrease in (F) CMRO2 (1.15 ± 0.33 mLO2/100g/min).