1212
Deuterium MRI for HDO Imaging of the Rat Brain Following Metabolism of [2H7]glucose1Biochemistry and Molecular Biology, University of Florida, Gainesville, FL, United States, 2Advanced Magnetic Resonance Imaging and Spectroscopy (AMRIS) Facility, University of Florida, Gainesville, FL, United States, 3Department of Biochemistry and Molecular Biology, University of Florida, Gainesville, FL, United States
Synopsis
In this study, we demonstrate the application of deuterium MRS(I) for in vivo rat brain imaging. Administration of [2H7]glucose via the tail vein produced deuterated lactate and glx analogous to earlier reports, but here we show for the first time that HDO generated from metabolism can be imaged in the rodent brain. By using HDO evolution as a metric of glucose utilization, we introduce a biomarker of cerebral glycolysis and oxidative flux that is imaged with superior sensitivity and resolution.
Introduction
Metabolic imaging using MR based methods has traditionally been limited to via chemical shift imaging (CSI) or single voxel spectroscopy.1 While these methods have been of immense use in clinical research, sensitivity issues have made their translation to the clinic problematic. Recently, hyperpolarized (HP) 13C imaging has been used to study heart, liver, and brain metabolism.2 However, HP is limited to molecules having long relaxation times and many metabolites such as glucose have short relaxation times, making clinical translation more challenging.3 In this work, we proposed [2H7]glucose as an alternative agent to study brain metabolism, in analogy to FDG-PET, but with detection of downstream metabolism and without the use of ionizing radiation.Methods
Animal Experiments: Rat tail vein was catheterized and [2H7]glucose (1.95 g/kg body weight) was administered. Animals were handled in compliance with the UF IACUC regulations.MRI System: MRS(I) experiments were performed on 11.1 T magnet interfaced to a Bruker Avance III HD console and ParaVision 6.0.1 (Bruker Instruments, Billerica, MA). A home-built 14 mm diameter surface coil tuned to 72.26 MHz was used to acquire 2H spectra and images.
Deuterium Magnetic Resonance Spectroscopy: A single pulse acquire sequence was used to obtain 2H NMR spectra with a repetition time of 300ms, and a flip angle of 60° with 256 averages. A total of 30 spectra were acquired for a 38-minute time period and 2 2H NMR spectra from the rat brain were acquired at 2 hours and 2.5 hours following [2H7]glucose infusion.
Deuterium Magnetic Resonance Imaging: Axial 1H and natural abundance (NA) deuterium images of the rat brain were acquired using the FLASH sequence. Multi-gradient echo (MGE) imaging experiment was utilized to acquire the echo images for separating HDO-only and [2H7]glucose-only images in the rat brain. Matrix size of 32x32, FOV of 40x40mm2, slice thickness of 14mm, repetition time of 100ms, and 256 signal averages were used to acquire echo images.
NMR and MRI data processing: 2H NMR data analysis was performed using MestReNova v14.0.1-23284 (Mestrelab Research, Spain). 1H and 2H images were processed in the ImageJ software (NIH, Bethesda, MD). MGE images were imported to MATLAB and the Dixon reconstruction algorithm4 was applied to reconstruct HDO-only and [2H7]glucose-only images from the MGE images.
Results
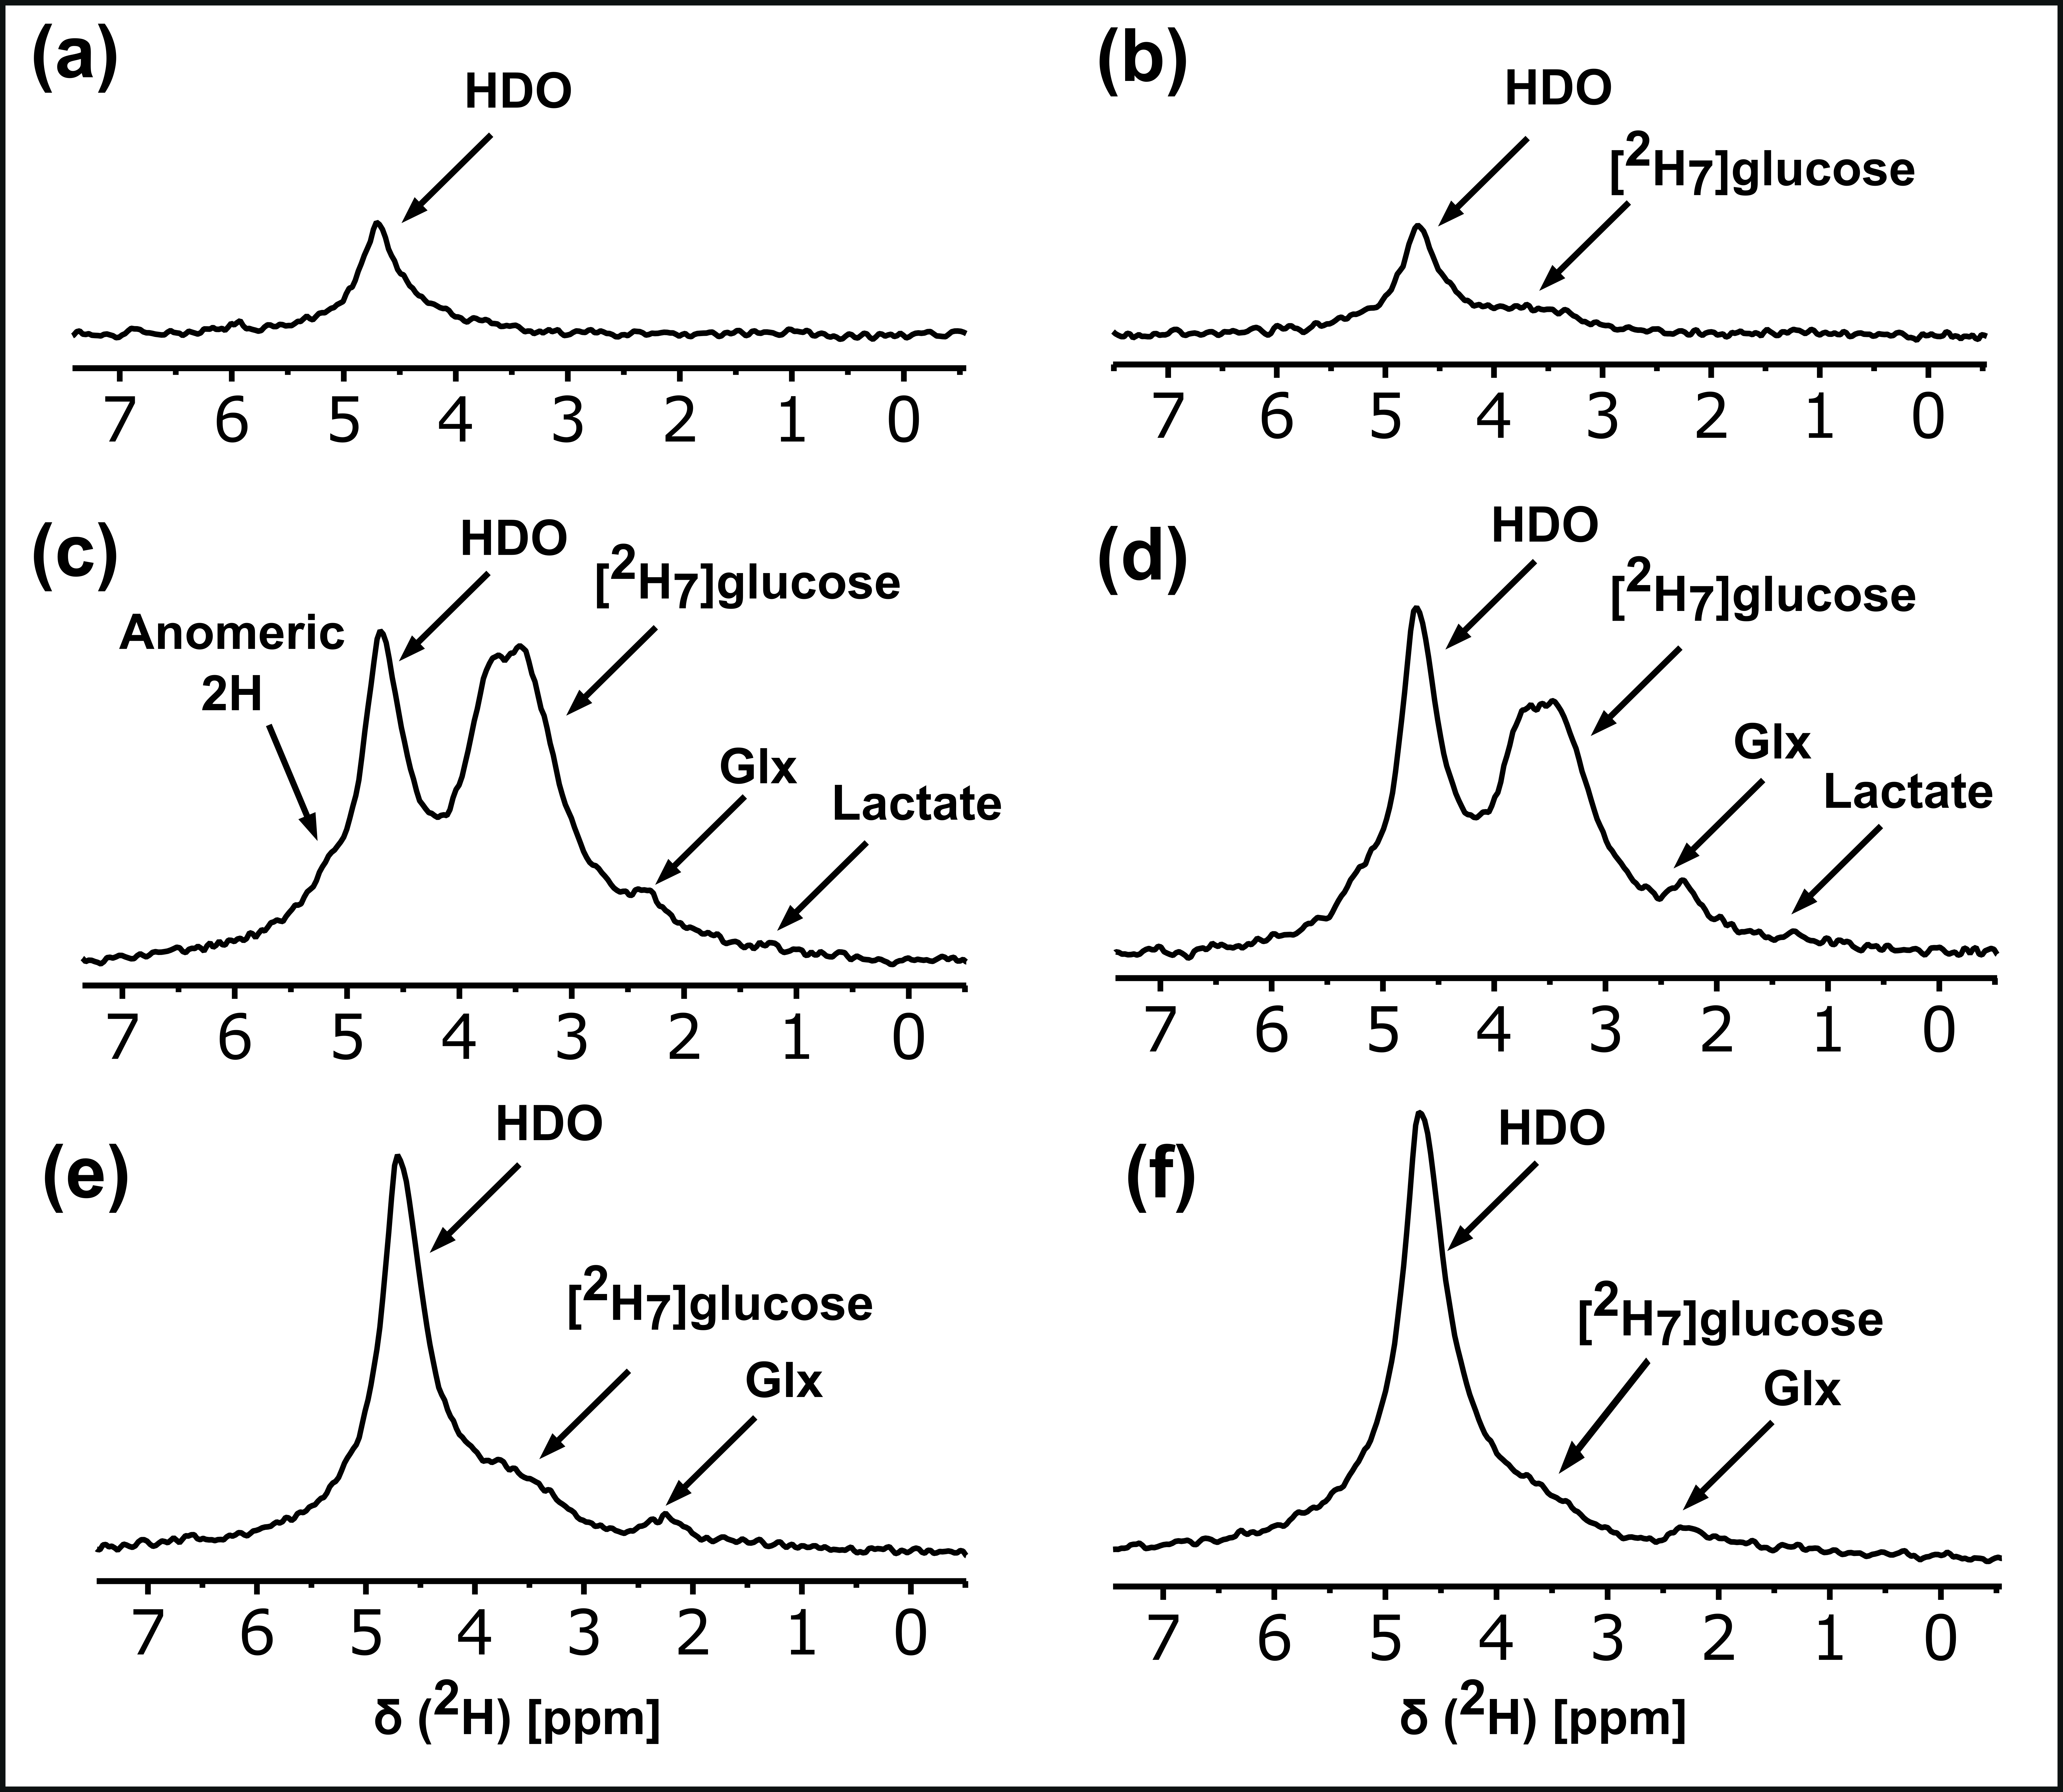
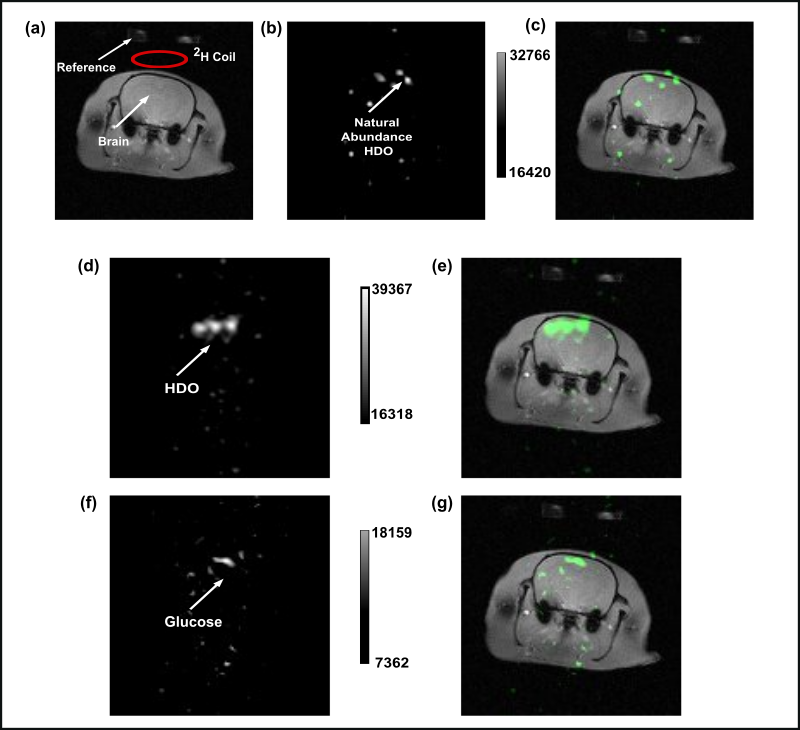
The 2H NMR spectra in Figure 1A reflect 0.015% enrichment of HDO in brain water (~13.2mM, assuming 75% of volume is water), arrival of [2H7]glucose, and its metabolism to glx and lactate. Over the course of 2.5 hours, the glucose bolus is almost completely metabolized and the HDO signal continued to rise as metabolism continued. At longer time points (Figure 1B-1E), the HDO signal continues to increase to a final estimated concentration of 48±10mM (greater than ~3.5x of NA HDO) (Figure 1F). To distinguish the HDO signal from the [2H7]glucose substrate, an MGE based two-point Dixon method was implemented during the initial time period (~10-24 minutes) of the post-[2H7]glucose infusion and metabolism (Figure 2). Figure 2D and 2F are the HDO-only and [2H7]glucose-only images, respectively. The final body plasma water HDO enrichment was determined to be 86.9±5.16mM.Discussion
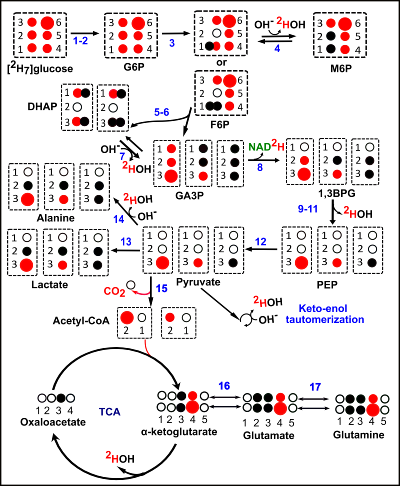
Metabolism of [2H7]glucose can produce HDO via flux into the 3-carbon glycolytic intermediates, and via oxidation of the downstream deuterated acetyl-CoA (Figure 3). The stoichiometry of the metabolism of the deuterated tracer is such that the number of HDO molecules produced by glycolysis versus those deposited into glx is either 6 to 1 or 5 to 2 (Figure 3). The average stoichiometric ratio of HDO produced to the deuterons of the C4 position of glx is therefore 4.25. This ratio was maintained during the time-period of 10-24 minutes. This time period (10-24 minutes) was used to implement the HDO/glucose two-point Dixon imaging (Figure 2). We have optimized a multi-gradient echo two-point Dixon method to produce HDO versus glucose images (Figure 2D and 2F) in analogy to fat-water imaging 5 The in-plane resolution was 1.25 mm2 in the raw images prior to zero-filling. CSI could not produce images of this resolution even at time periods ~4 times as long for acquisition.Conclusions
We demonstrate here for the first time metabolic imaging of HDO as a biomarker of [2H7]glucose, lactate, and glx metabolism. Spectrally selective imaging of HDO and glucose using a two-point Dixon method was accomplished with a simple multi-gradient echo sequence. This modality facilitates higher in-plane resolution and faster acquisition of imaging data than possible with normal CSI methods.Acknowledgements
This work was performed at the National High Magnetic Field Laboratory, which is supported by National Science Foundation Cooperative Agreement number DMR-1644779, & the State of Florida and NIH P41-122698. MEM and MR acknowledge support from NIH R01-DK105346. MEM and RM acknowledge support from P41-GM122698. MEM acknowledges support from NIH 5U2C-DK119889.References
1. Frahm, J., Merboldt, K. D., Hänicke, W. & Haase, A. Stimulated echo imaging. J. Magn. Reson. 1969 64, 81–93 (1985).
2. Merritt, M. E. et al. Hyperpolarized 13C allows a direct measure of flux through a single enzyme-catalyzed step by NMR. Proc. Natl. Acad. Sci. 104, 19773–19777 (2007).
3. Kurhanewicz, J. et al. Hyperpolarized 13C MRI: Path to Clinical Translation in Oncology. Neoplasia N. Y. N 21, 1–16 (2019).
4. Ragan, D. K. & Bankson, J. A. Two-point dixon technique provides robust fat suppression for multi-mouse imaging. J. Magn. Reson. Imaging 31, 510–514 (2010).
5. Ma, J. Dixon techniques for water and fat imaging. J. Magn. Reson. Imaging 28, 543–558 (2008).
Figures