1211
Cerebral metabolic derangements as translatable biomarkers in pantothenate kinase-associated neurodegeneration mouse model via 1H MRS1Department of Diagnostic Imaging, St Jude Children's Research Hospital, Memphis, TN, United States, 2Center for In Vivo Imaging and Therapeutics (CIVIT), St Jude Children's Research Hospital, Memphis, TN, United States, 3Department of Infectious Diseases, St Jude Children's Research Hospital, Memphis, TN, United States
Synopsis
Pantothenate kinase (PanK) is a metabolic enzyme that is the first and rate-controlling step in the only pathway for cellular coenzyme A (CoA) biosynthesis. A rare, life-threatening neurological disorder known as pantothenate kinase-associated neurodegeneration (PKAN), formerly known as Hallervorden-Spatz disease, arises from mutations in the human PANK2 gene. Here, we studied the neurochemical effects of a drug capable of allosterically activating PanK protein isoforms as a potential PKAN therapeutic. We applied 1HMRS to quantify changes in cerebral metabolites including Glx, GABA, lactate, and NAA in a mouse model of CoA deficiency employing the neuron-specific deletion of Pank1 and Pank2 genes.
Intorduction
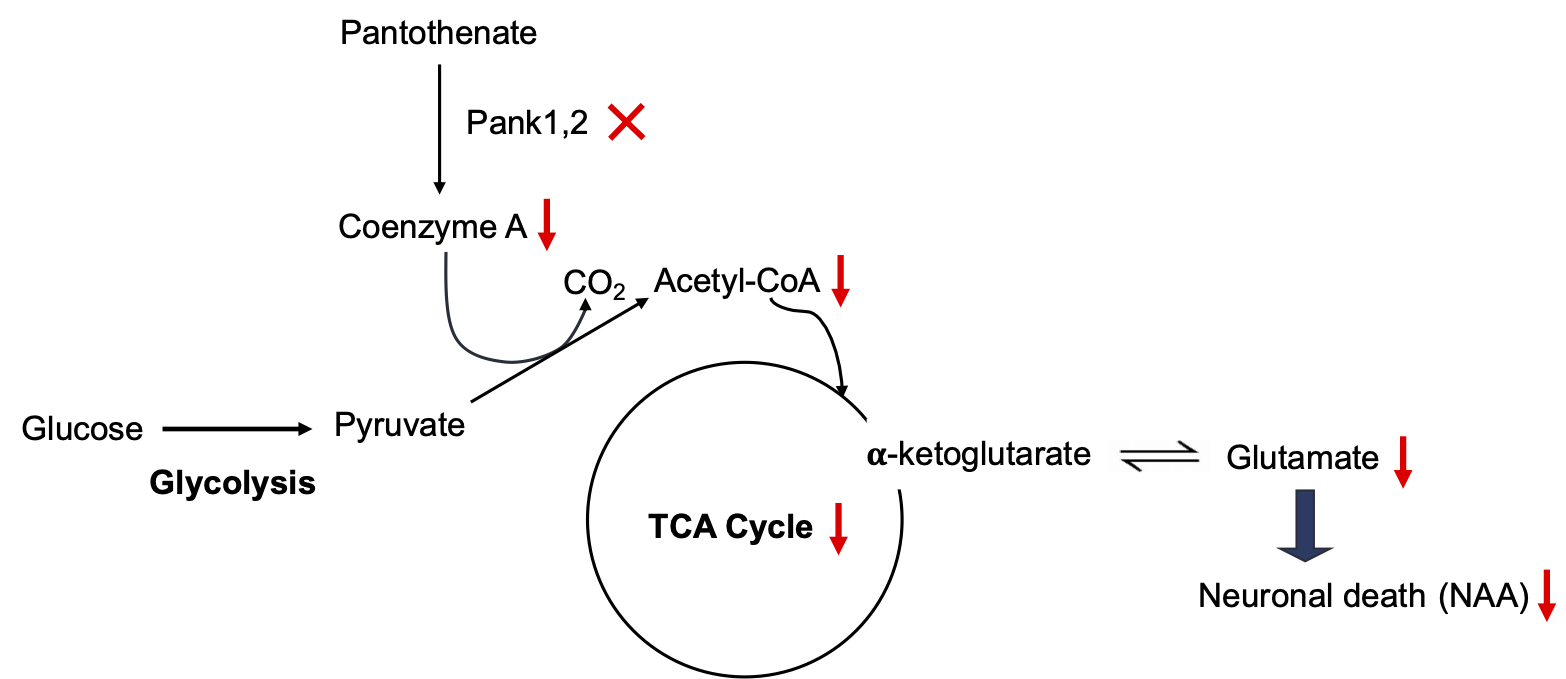
Pantothenate kinase (PanK) is the first and rate-controlling step in the only pathway for coenzyme A (CoA) biosynthesis1. CoA is essential for hundreds of metabolic reactions including the tricarboxylic acid cycle, fatty acid oxidation and synthesis, amino acid metabolism, and neurotransmitter synthesis1,2. A rare, life-threatening neurological disorder known as pantothenate kinase-associated neurodegeneration (PKAN) arises from mutations in the human PANK2 gene leading to a prominent extrapyramidal movement disorder and a characteristic deposition of iron in the basal ganglia3. Figure 1 depicts the effects of loss of CoA synthesis due to disruption of murine Pank1 and Pank2 genes in neurons. Pyruvate produced from glycolysis requires CoA to form acetyl-CoA, a substrate for the mitochondrial TCA cycle, and reduced CoA can lead to disrupted TCA cycling and hence reduce glutamate levels in the neurons, thereby causing cell death. There are no disease-modifying treatments for PKAN, and therapeutics are desperately needed. A newly developed drug, BBP-671, is capable of allosterically activating the alternate PanK isoforms as a potential PKAN therapeutic4. Neuronal Pank1,2 knockout (KO) mice treated with BBP-671 showed physiological improvements including weight gain, improved locomotor activity, and life span. In this study, we sought to discover neurochemical biomarkers by performing in vivo 1H MRS in mouse brains following the treatment with BBP-671. Here we report the Glx/tCr ratio as a potential biomarker for evaluating the treatment response in neuronal Pank1,2 KO mice.Material and Methods
Three groups of mice aged 6-7 weeks were used in this study: 1. Wild type (n=13), 2. Neuronal Syn-Cre+Pank1,2 KO (n=6), and 3. Syn-Cre+Pank1,2 KO + BBP-671 (n=5). The Syn-Cre+Pank1,2 KO + BBP-671 group received chow fortified with BBP-671 for 20 days post-weaning. MRI/MRS studies were performed on a Bruker Clinscan 7T magnetic resonance imaging (MRI) scanner (Bruker BioSpin MRI GmbH, Ettlingen, Germany). Mice were anesthetized using isoflurane mixed with O2 (1-2%) and the respiration rate was monitored. MRI was acquired with a mouse brain surface receive coil positioned over the mouse head and placed inside a 72 mm transmit/receive coil. After the localizer, a T2-weighted turbo spin-echo sequence was performed in the coronal (TR/TE = 2290/41 ms, matrix size = 192 × 256, slice thickness 0.5 mm, number of slices = 14) and axial (TR/TE = 3841/50 ms, matrix size = 192 × 144, slice thickness 0.4 mm, number of slices = 42) orientations. The T2-weighted scans were used to position a 3.5 mm x 4.5 mm x 2.0 mm voxel for spectroscopy in the midbrain to cover the thalamus and hippocampus. A 1H MR spectrum was generated with that voxel using a PRESS sequence (repetition time/echo time = 3000/11 ms, averages = 128, data length = 2048, spectral width = 2900 Hz). 1H MRS data were analyzed using LCModel5 with results reported as a ratio of metabolites to tCr.Results and Discussion
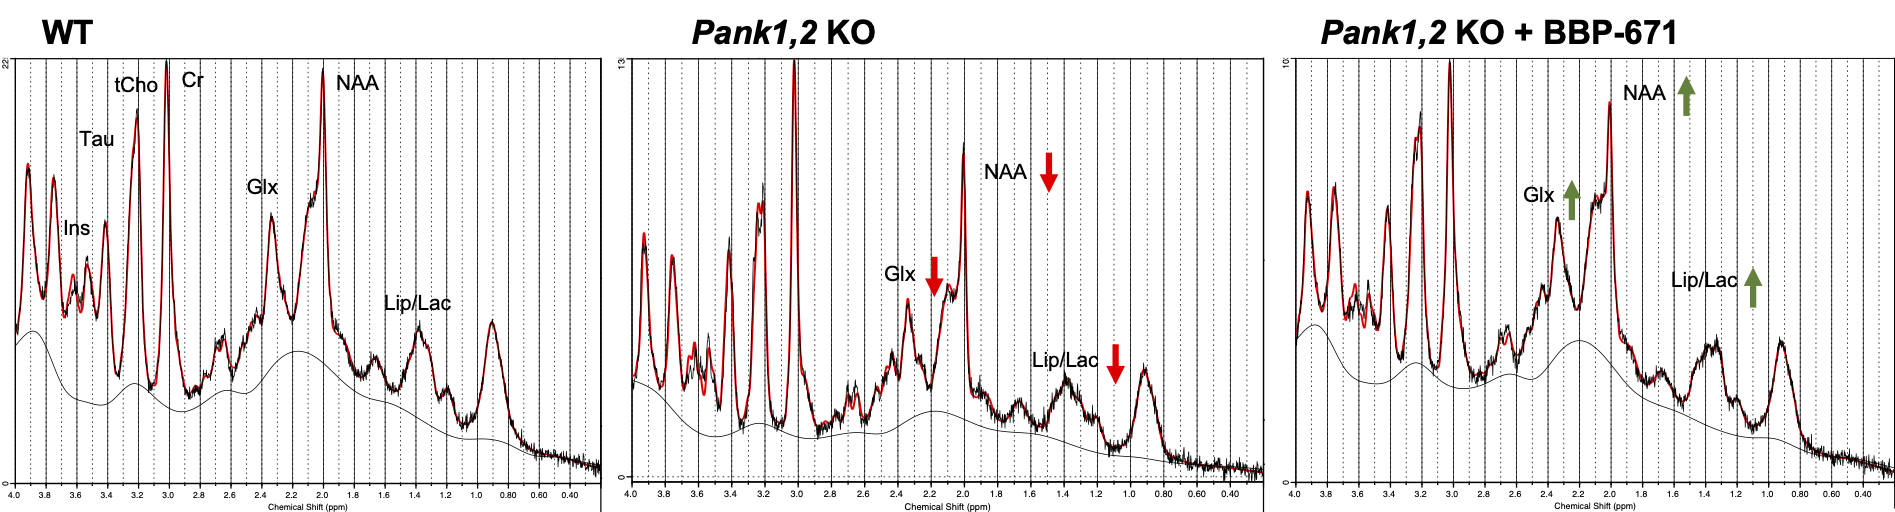
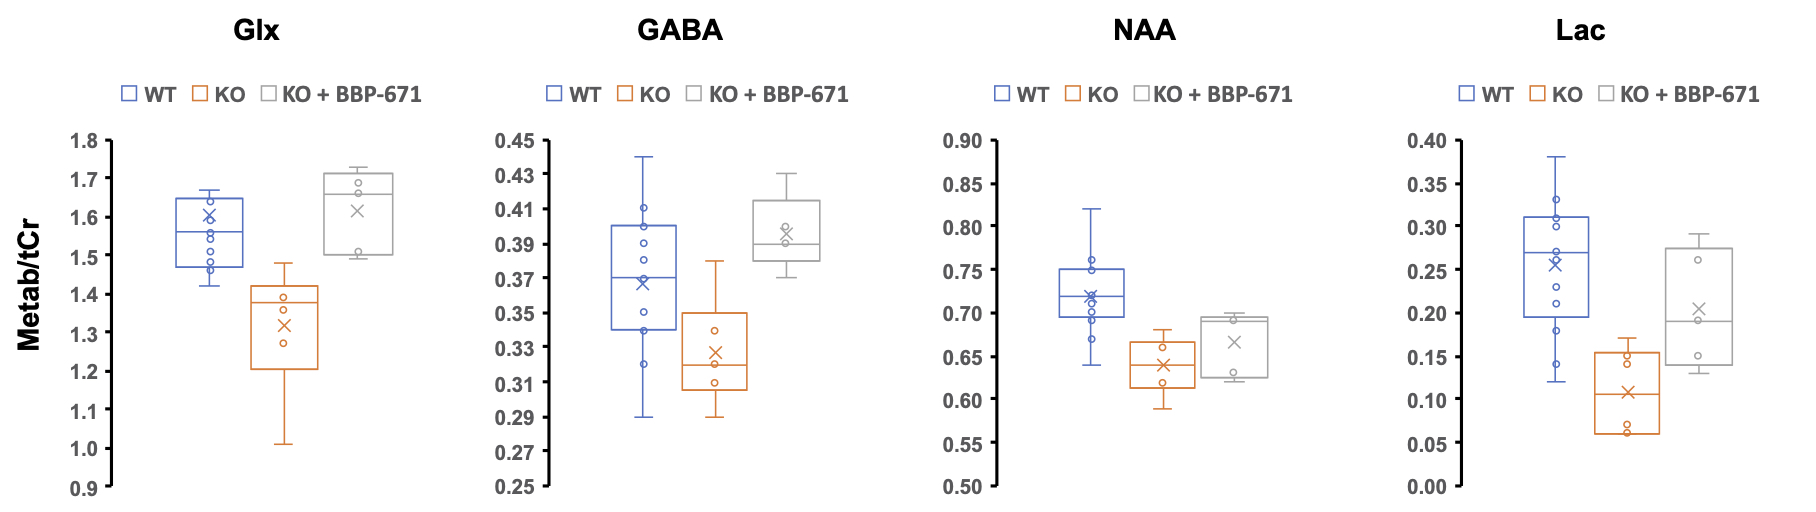
Neuronal Pank1,2 KO mice showed clear physiological symptoms of CoA deficiency such as weight loss and impaired locomotor activity. Figure 2 represents the 1H MR spectra acquired from the midbrain of representative mice in each group. We found that there is a clear reduction in the Glx and NAA signal at 2.35 and 2.0 ppm, respectively, in the neuronal Pank1,2 KO group. Additionally, the lactate peak at 1.33 ppm was also reduced in neuronal Pank1,2 KO mice. The loss of Glx and NAA in Pank1,2 KO mice was observed to be fully and partially recovered in KO mice treated with BBP-671. Further, the LCModel processing of the 1H MRS data confirmed that Glx/tCr ratio was lower in neuronal Pank1,2 KO mice; which was found to be higher in neuronal Pank1,2 KO mice treated with BBP-671 (WT: 1.60 ± 0.21; Pank1,2 KO: 1.32 ± 0.17; Pank1,2 KO + BBP-671: 1.62 ± 0.11) (Figure 3a). We also found a similar trend for GABA/tCr ratio in the three groups (WT: 0.37 ± 0.04; Pank1,2 KO: 0.33 ± 0.03; Pank1,2 KO +BBP-671: 0.40± 0.02) (Figure 3b). Reduction of both Glx and GABA points towards impaired excitatory and inhibitory neuronal metabolism in the Pank1,2 KO mice. Interestingly, NAA was found to be lower in KO mice, but the treated group did not show a complete recovery of NAA (WT: 0.72 ± 0.03; Pank1,2 KO: 0.64 ± 0.03; Pank1,2 KO + BBP-671: 0.67 ± 0.04) (Figure 3c). Counter to a previous report6 we found that the lactate level was lower in the KO mice, indicating that there might be impaired cellular glycolysis. Further studies are needed to confirm that the lactate signal is indeed lower in the KO mouse brain.Acknowledgements
This research was supported by CoA Therapeutics, Inc., St. Jude Children’s Research Hospital, and American Lebanese Syrian Associated Charities (ALSAC)
*PB and JS contributed equally to this work
References
- Leonardi R, Zhang YM, Rock CO, Jackowski S (2005) Prog Lipid Res 44:125–1532.
- Srinivasan B, Sibon OCM (2014) Biochem Soc Trans. 42:1075-10793.
- Zhou B, Westaway SK, Levinson B, Johnson MA, Gitschier J, Hayflick SJ (2001) Nat Genet 28:345–3494.
- Sharma LK., Subramanian C, Yun MK. Frank MW, White SW, Rock CO, Lee RE, Jackowski S. (2018) Nat Commun 9, 43995.
- Provencher, S. W. Automatic quantitation of localized in vivo 1H spectra with LCModel. (2001) NMR Biomed. 14, 260-2646.
- Arber C, Angelova PR, Wiethoff S, Tsuchiya Y, Mazzacuva F, Preza F, Bhatia KP, Mills K, Gout I, Abramov AY, Hardy J, Duce JA, Houlden H, Wray S. (2017) PLoS One 12(9): e0184104
Figures