1210
Phenotyping a Mouse Model of TRAPPC9-Associated Intellectual Disability using Magnetic Resonance Imaging1Molecular and Clinical Cancer Medicine, University of Liverpool, Liverpool, United Kingdom, 2Cellular and Molecular Physiology, University of Liverpool, Liverpool, United Kingdom
Synopsis
Loss of function mutations in the TRAPPC9 gene causes autosomal recessive intellectual disability and microcephaly. A mouse model was generated to investigate the effects of TRAPPC9 knockout in mice. In vivo and ex vivo MRI were used alongside behavioural tests to probe differences in brain volume and learning ability. In vivo MRI demonstrated significant differences between the whole brain, cerebellar and corpus callosum volumes of adult TRAPPC9 knockout mice and wildtype controls. Behavioural assays also revealed significant differences in learning ability. These results align with the human condition and suggest the model is appropriate for further study of TRAPPC9 knockout.
Introduction
Homozygous mutation of the gene encoding the protein Trafficking Protein Particle Complex Subunit C9 (TRAPPC9) causes TRAPPC9 Associated Autosomal Recessive Intellectual Disability (AR-ID) characterised by microcephaly, cerebellar hypoplasia, intellectual disability, obesity, poor sociability and stereotactic movement in humans1–4. However, the exact mechanism by which AR-ID arises is unknown, providing grounds for a controlled study to characterize the phenotypic brain abnormalities in a knockout (KO) model of TRAPPC9 AR-ID. In this study ex vivo and in vivo MRI along with behaviour assays were performed at different ages to evaluate age-dependent differences between KO and wild type (WT) mice.Methods
AnimalsA knockout (KO) mouse model was obtained from the Wellcome Trust Sanger Centre UK. Genotyping PCR was used for confirmation of the homozygous KO. For ex vivo MRI, 17 Neonatal pups (P0-P1) were used, of which, 8 were KOs and 9 were (WT) controls.
For the in vivo MRI 44 adult mice were used, of which 23 were KOs and 21 WTs.
Ex Vivo MRI
Neonatal mouse heads were fixed in 4% PFA. The samples were immersed in a 10mM solution of the gadolinium contrast agent Multihance (Bracco Diagnostic Inc., Italy) for 20 hours prior to imaging. The samples were placed in Fomblin (Solvay Solexis, UK). Imaging was performed using a 27mm loop gap resonator and a 9.4 Tesla MR scanner (Bruker, Germany).
T1-weighted 3D images were acquired (TR/TE:70.8/8ms, averages: 2, flip angle: 60°, FOV: 12mm3, isotropic resolution: 0.05mm3, acquisition time: 2.5 hours).
In Vivo MRI
Imaging was performed twice in each animal (12-16 weeks old reflecting young adult age and 36-40 weeks old reflecting an aged adult). The mouse was anaesthetised using 1.5-2.0% isoflurane. A 4-channel phased array receiver coil was used in conjunction with an 86 mm birdcage coil for transmission.
T2-weighted spin-echo images were acquired covering the whole head (TR/TE:3200/33ms, averages: 8, echo spacing: 11ms, RARE Factor: 8, FOV: 18mm2, slices: 15, slice thickness: 0.5mm, acquisition matrix: 256mm2, acquisition time: 14 minutes).
Image Analysis
After conversion from DICOM to NIFTI and bias field correction, segmentation of the whole brain and of regions of interest (ROIs) was carried out in the 3D slicer software package (https://www.slicer.org/) using a combination of thresholding tools and manual segmentation of the images.
Behavioural Assays
The rotarod, elevated plus maze, and plug puzzle tests were performed as previously described5-7, in a brightly lit (500-700 lux) environment on young adult mice (12-16 weeks old).
Results
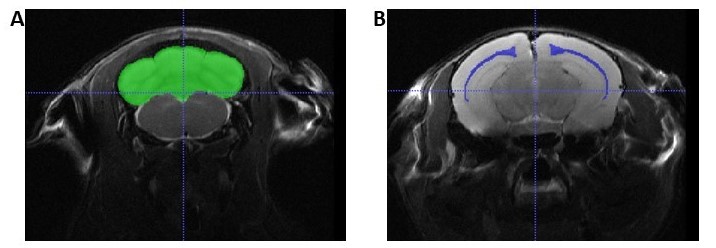
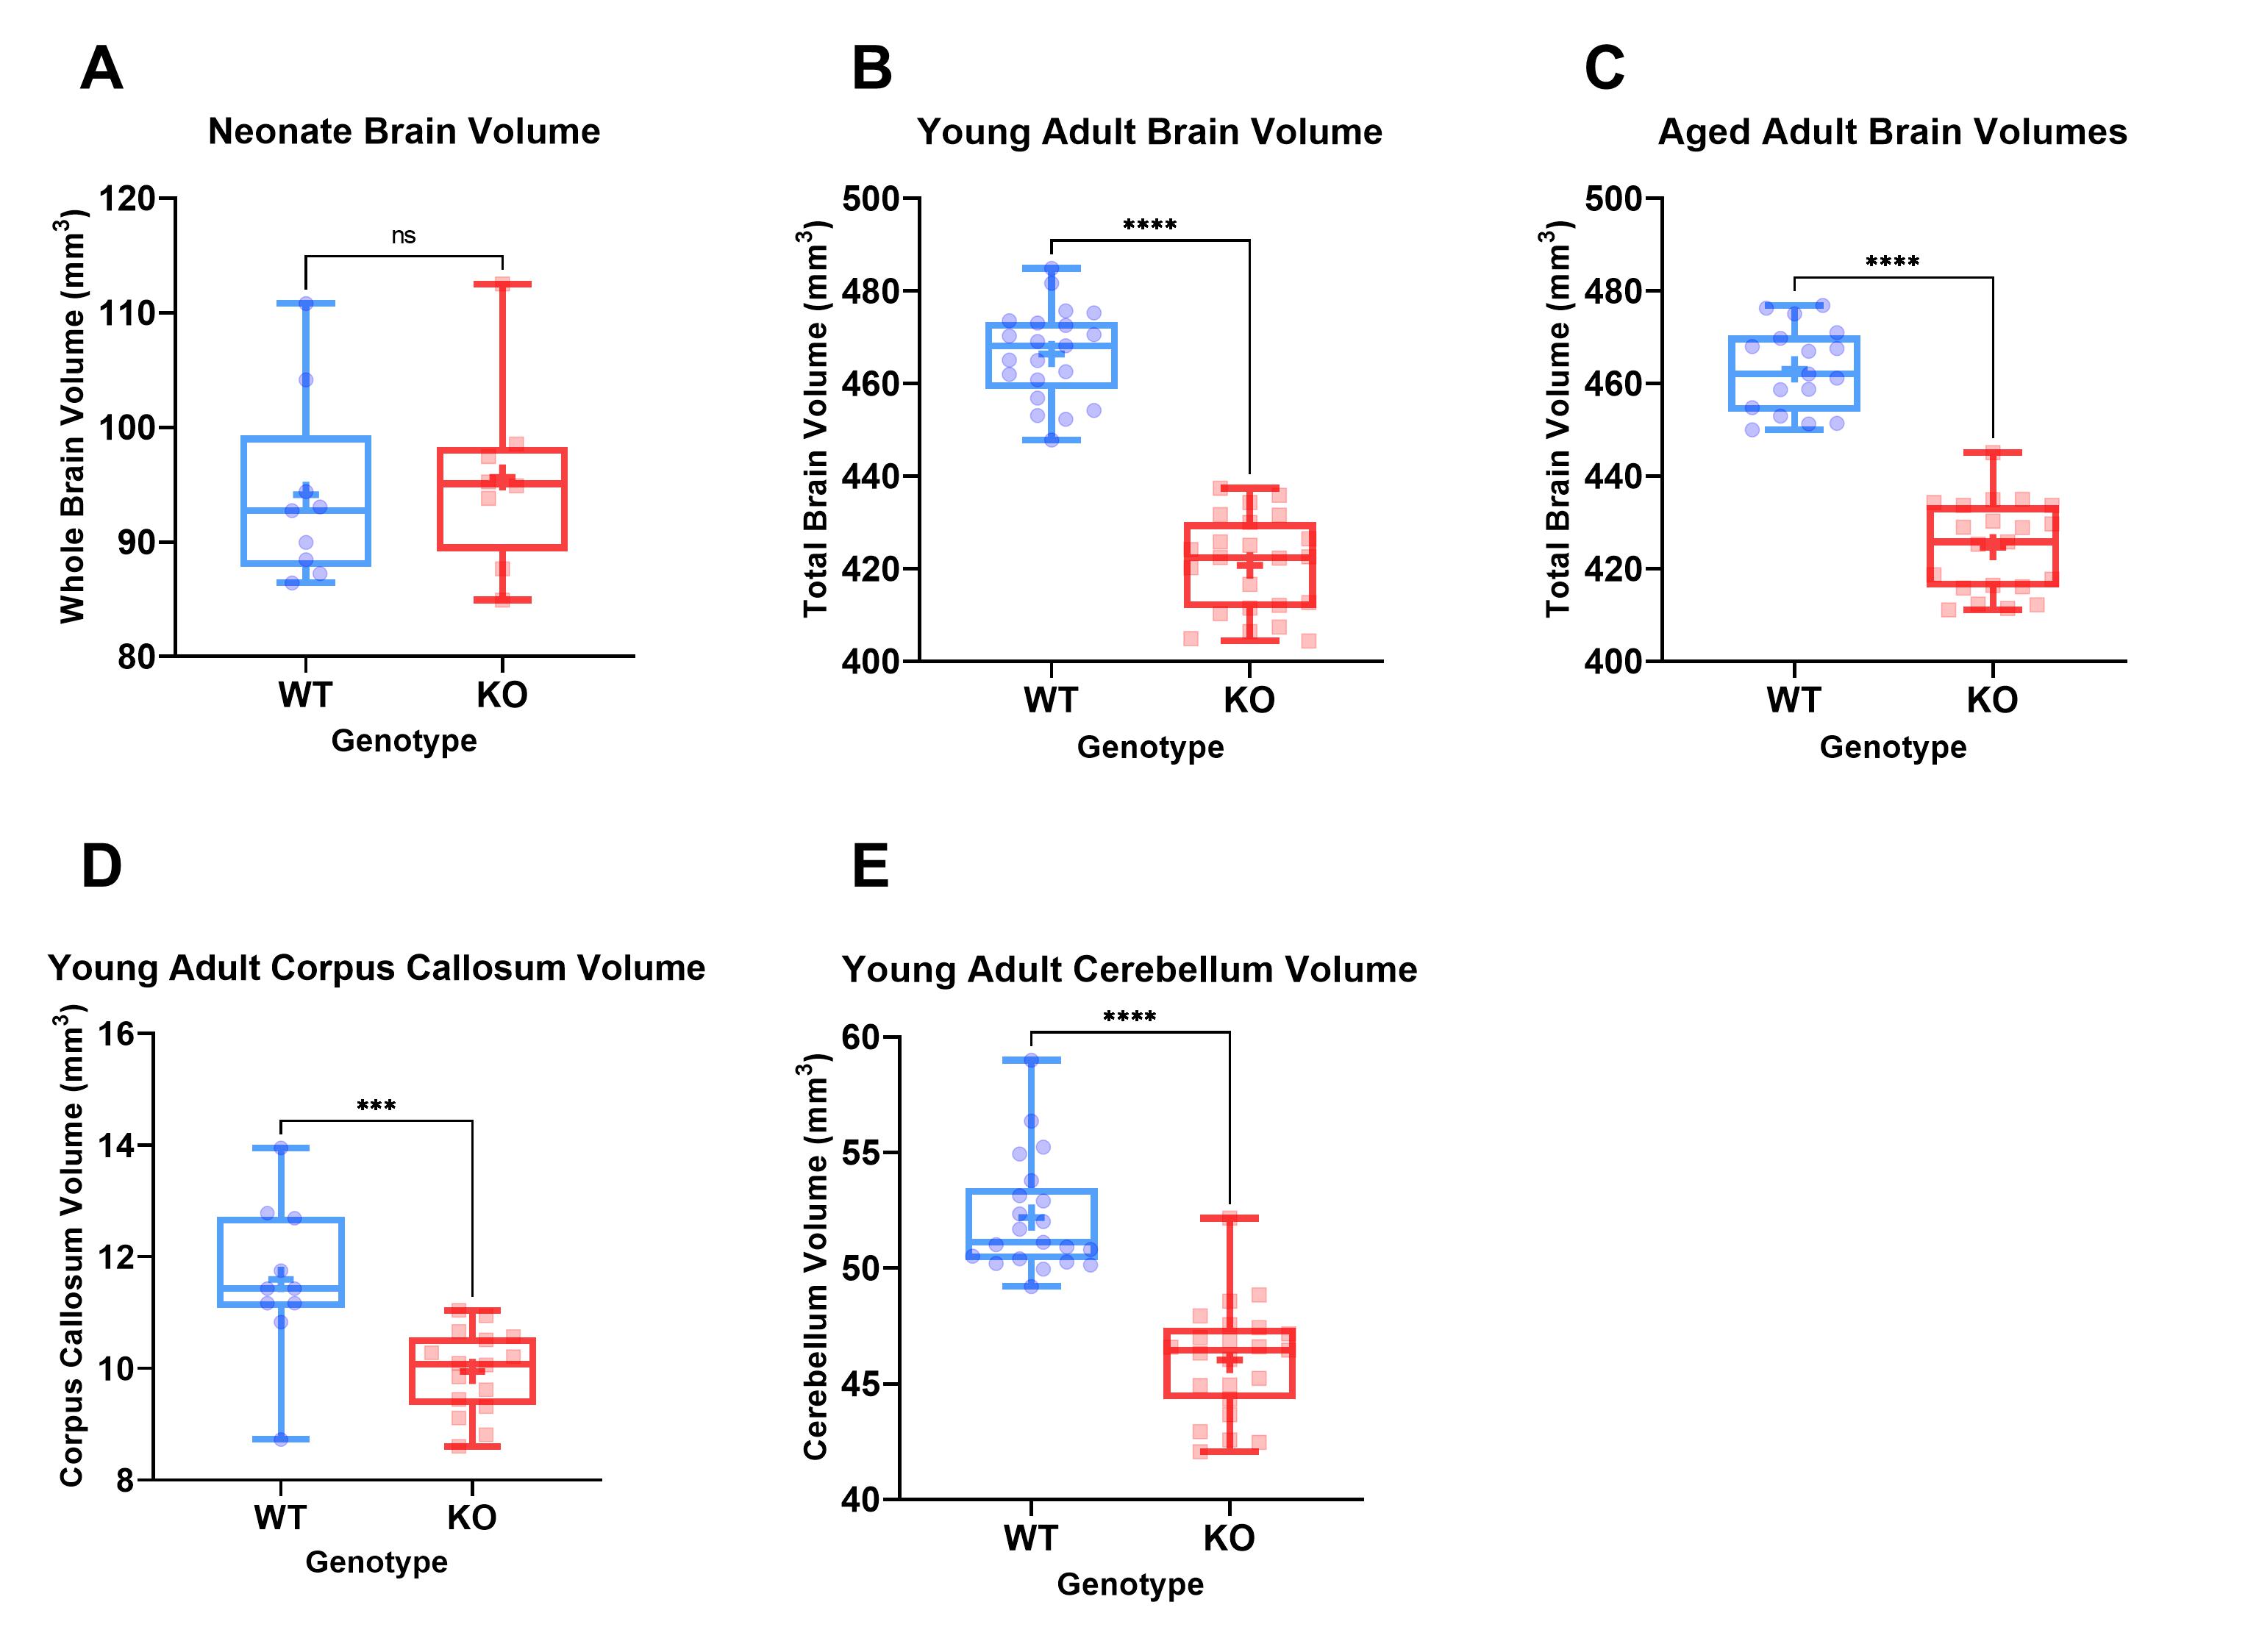
Brain VolumesFigure 1 shows an example slice of the in vivo T2-weighted images, with the ROI segmentation masks overlaid.
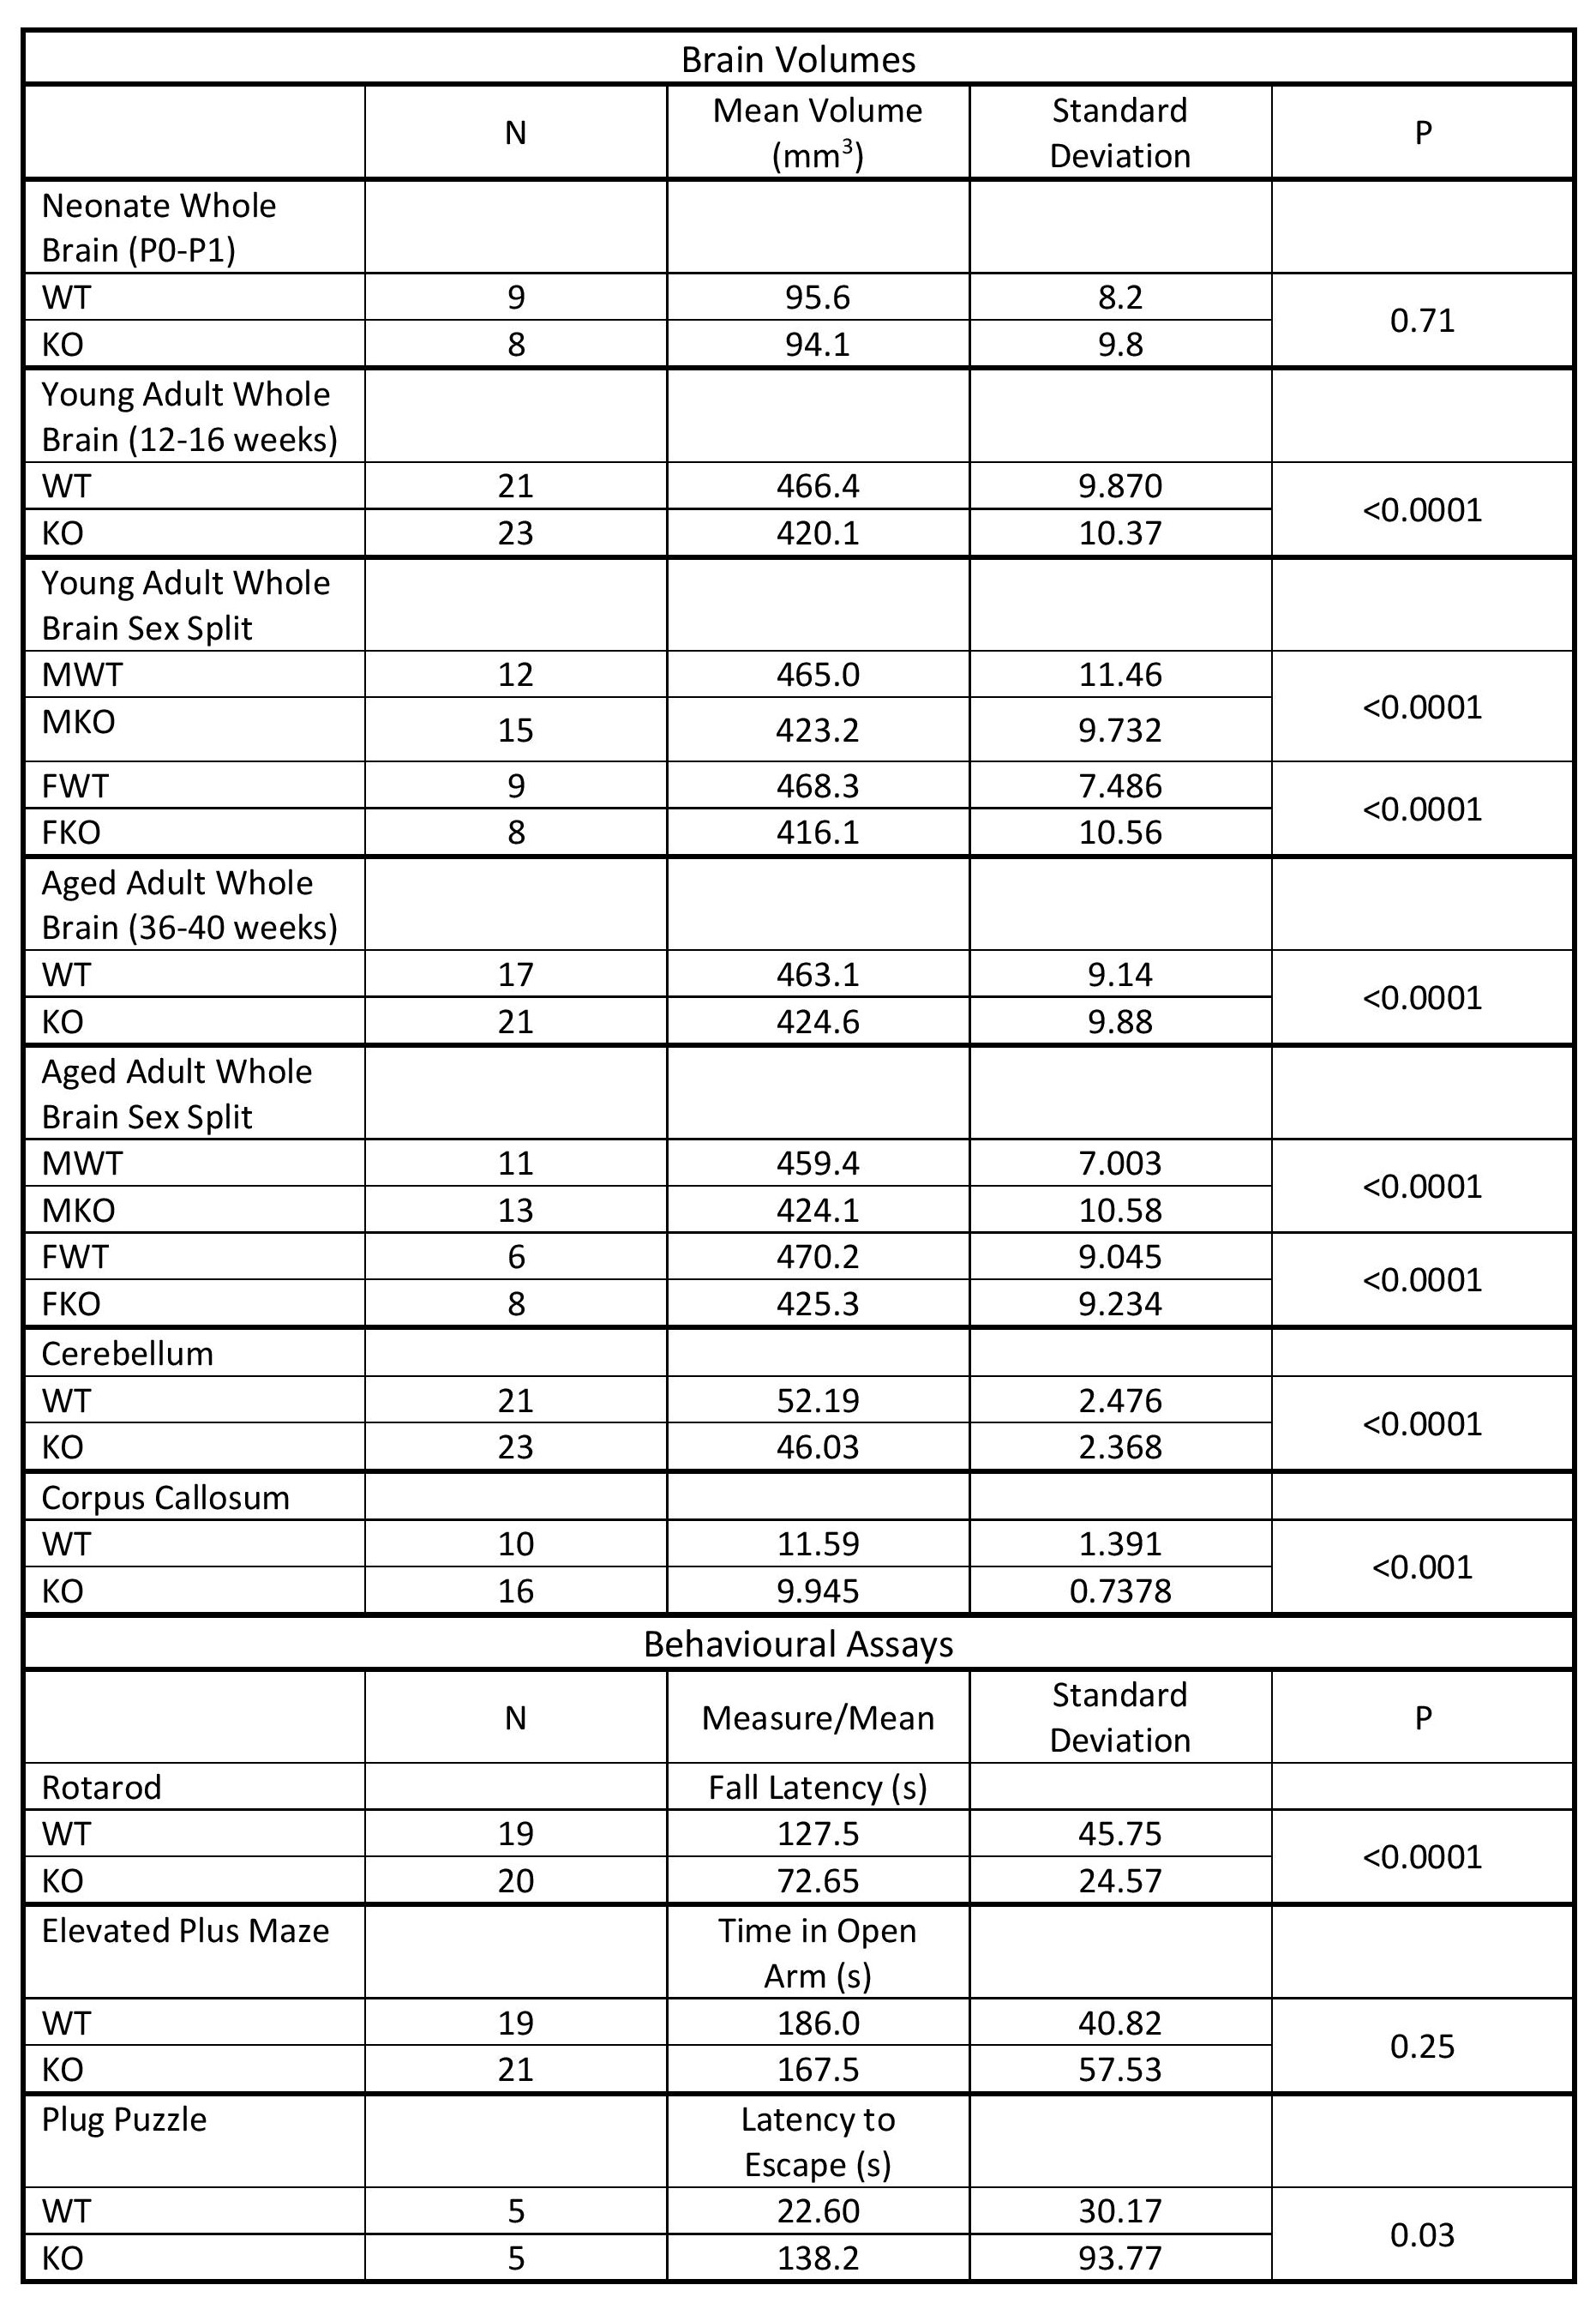
Table 1 shows whole brain volume measurements for the neonates, young adults and aged adults as well as the regional brain volumes. These results demonstrate no significant differences between KOs and WT mice at neonatal age, yet significant differences at all other timepoints were observed. These differences survive controlling for sex by comparing male WT (MWT) with male KO (MKO) and also for comparing female WT (FWT) to female KO (FKO). The regional brain analysis revealed significant differences between both corpus callosum and cerebellum volumes (Figure 2).
Behavioural Assays
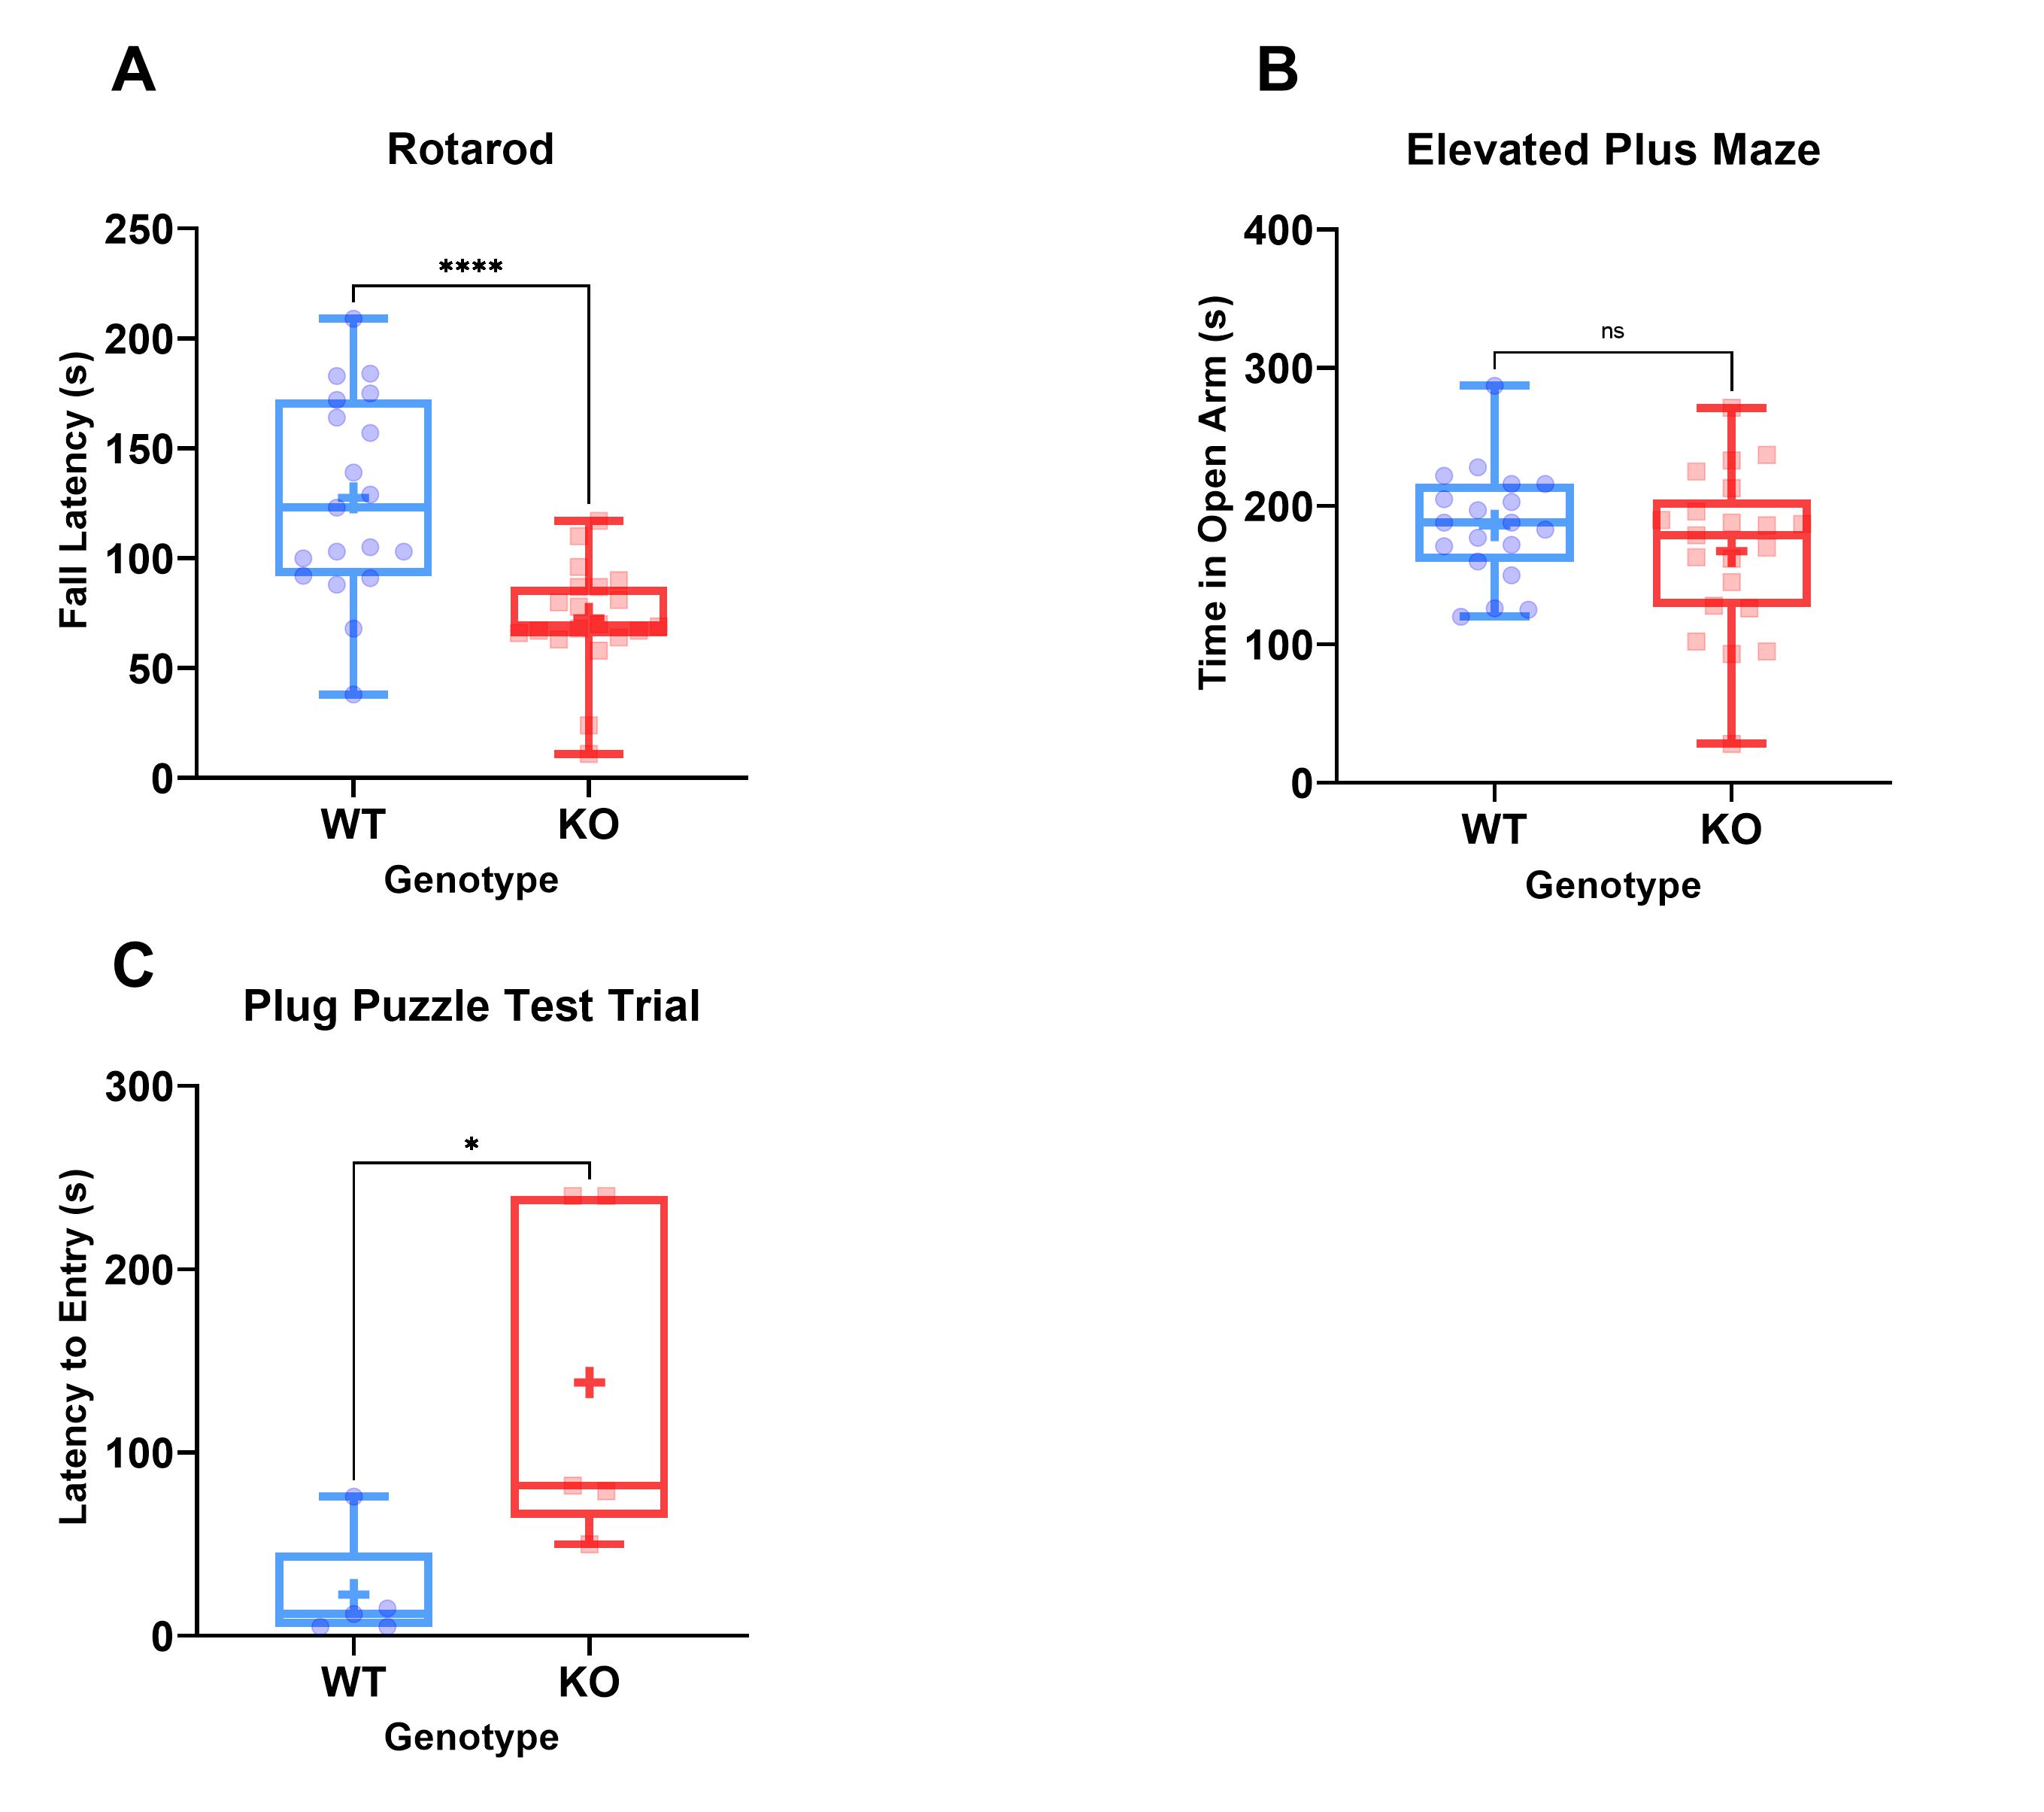
Table 1 shows results of the behavioural assays, demonstrating significant differences in rotarod fall latency and escape latency in the plug puzzle. No significant differences were seen in anxiety as measured by the elevated plus maze (Figure 3).
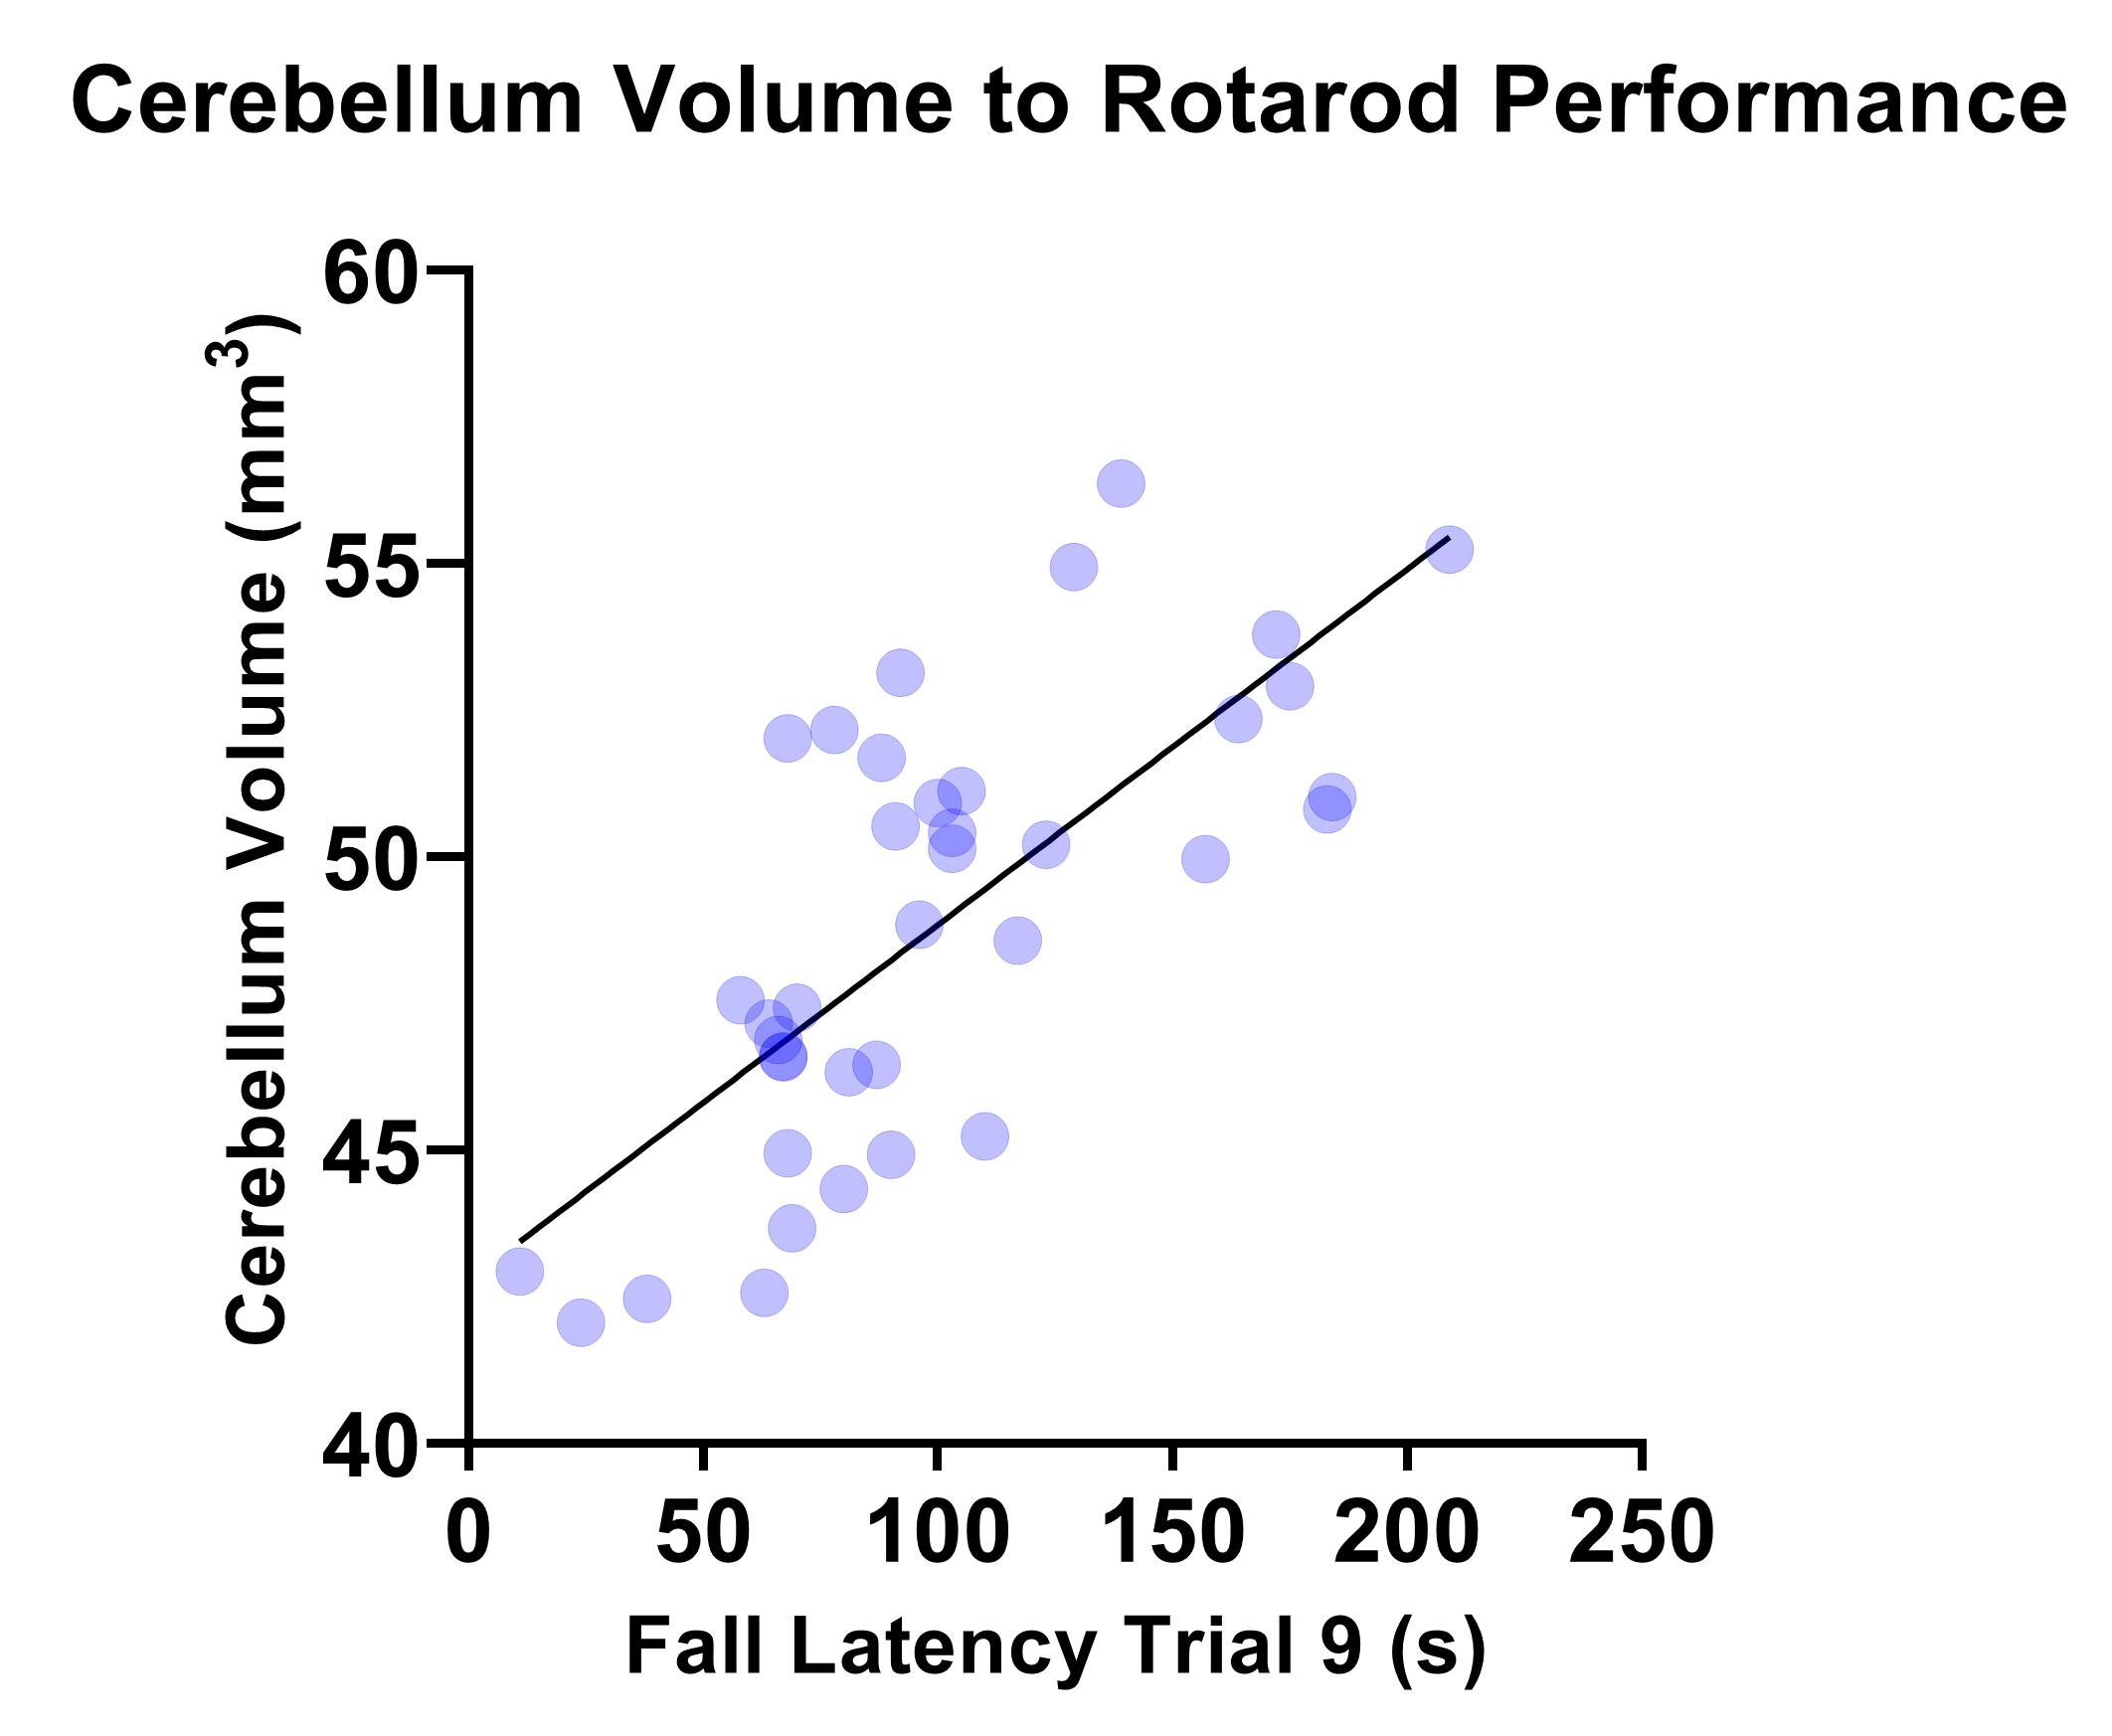
Figure 4 shows correlation between rotarod performance and cerebellum volume measured by MRI where a significant correlation was observed (r=0.7250, R2=0.5256, P=<0.001).
Discussion
MRI demonstrated significantly reduced brain volume in KO mice compared to WT controls. In addition, a significant reduction in both cerebellum and corpus callosum volume was noted, both of which have been reported to be underdeveloped in TRAPPC9 mutant patients1-4. As no volumetric differences were observed at the neonatal timepoint, it suggests that microcephaly is secondary and occurs during post-natal brain development. The in vivo imaging at the later time point show that the differences remain consistent into aged adulthood, with no significant recovery of brain volume for the KOs.The accelerating rotarod examines motor co-ordination5. Our results demonstrated that KO mice fall earlier than their WT counterparts. Given the well-known role of the cerebellum in motor co-ordination, it is not surprising that mice with an underdeveloped cerebellum perform worse. Reduced cerebellum volume correlated with the rotarod fall latency (Figure 4) confirming the imaging findings.
The differences in plug puzzle performance indicate deficient problem solving and learning ability in the KOs as reported in AR-ID. No observable differences in anxiety in the KO mice are in line with the findings in human TRAPPC9 patients and indicate that learning disabilities are intrinsic to the model and are not confounded by anxiety underlying the phenotypes observed.
Conclusion
The KO mice display the microcephaly and reductions in specific brain regions that mirror those found in the human phenotype. This, alongside the behavioural test data provide evidence that the model is appropriate for further investigation of AR-ID and highlights the role MRI can play in phenotyping studies.Acknowledgements
MP was supported by an MRC-DiMeN Doctoral Training Programme RTSG Grant.All work was performed in the Centre for Preclinical Imaging at the University of Liverpool. Funded by MRC grant.
References
1. Sacher, M., Shahrzad, N., Kamel, H. and Milev, M. P. (2018) TRAPPopathies: An emerging set of disorders linked to variations in the genes encoding transport protein particle (TRAPP)-associated proteins. Traffic 5–26.
2. Abbasi, A. A., Blaesius, K., Hu, H., Latif, Z., Picker-Minh, S., Khan, M. N., Farooq, S., Khan, M. A. and Kaindl, A. M. (2017) Identification of a novel homozygous TRAPPC9 gene mutation causing non-syndromic intellectual disability, speech disorder, and secondary microcephaly. Am. J. Med. Genet. Part B Neuropsychiatr. Genet. 174, 839–845.
3. Mortreux, J., Busa, T., Germain, D. P., Nadeau, G., Puechberty, J., Coubes, C., Gatinois, V., Cacciagli, P., Duffourd, Y., Pinard, J. M., et al. (2018) The role of CNVs in the etiology of rare autosomal recessive disorders: The example of TRAPPC9-associated intellectual disability. Eur. J. Hum. Genet., Springer US 26, 143–148.
4. Abou Jamra, R., Wohlfart, S., Zweier, M., Uebe, S., Priebe, L., Ekici, A., Giesebrecht, S., Abboud, A., Al Khateeb, M. A., Fakher, M., et al. (2011) Homozygosity mapping in 64 Syrian consanguineous families with non-specific intellectual disability reveals 11 novel loci and high heterogeneity. Eur. J. Hum. Genet. 19, 1161–1166.
5. Castagné, V., Hernier, A. M. and Porsolt, R. D. (2014) Rotarod Test. Ref. Modul. Biomed. Sci. 1–13.
6. Walf, A. and Fyre, C. (2007) The use of the elevated plus maze as an assay of anxiety-related behavior in rodents. Nat. Protoc. 2, 322–328.
7. O’Connor, A. M., Burton, T. J., Leamey, C. A. and Sawatari, A. (2014) The use of the puzzle box as a means of assessing the efficacy of environmental enrichment. J. Vis. Exp. 1–8.
Figures