1209
Changes in Correlation Between Brain Metabolites Due to Acute Stress in Mouse Hippocampus using Proton Magnetic Resonance Spectroscopy
Chang-Soo Yun1, Yoon Ho Hwang2, Min-Hee Lee3, Wooseung Kim2, Jehyeong Yeon1, Hyeon-Man Baek4, Dong Youn Kim2, and Bong Soo Han1
1Radiation Convergence Engineering, Yonsei University, Wonju-si, Gangwon-do, Korea, Republic of, 2Biomedical Engineering, Yonsei University, Wonju-si, Gangwon-do, Korea, Republic of, 3Institute of Human Genomic Study, Korea University, Ansan-si, Gyeonggi-do, Korea, Republic of, 4Gachon Advanced Institute for Health Sciences and Technology, Gachon University, Incheon-si, Korea, Republic of
1Radiation Convergence Engineering, Yonsei University, Wonju-si, Gangwon-do, Korea, Republic of, 2Biomedical Engineering, Yonsei University, Wonju-si, Gangwon-do, Korea, Republic of, 3Institute of Human Genomic Study, Korea University, Ansan-si, Gyeonggi-do, Korea, Republic of, 4Gachon Advanced Institute for Health Sciences and Technology, Gachon University, Incheon-si, Korea, Republic of
Synopsis
We investigated the changes in correlation between mouse brain metabolites due to acute restraint stress using magnetic resonance spectroscopy (MRS). Acquired time series MRS data of the control and acute stress groups were quantified using LCModel. Correlation coefficients between metabolites were calculated from time series metabolite concentration and metabolite pairs with statistically significant correlations were selected using one-sample Sign Test ( p < 0.05 ). We found that Gln-GSH, NAA-Glu and NAA-GSH showed new significant correlations in the acute stress group. Our findings suggest that correlation can be a useful measurement in assessing the effects of stress.
Introduction
Stress can induce changes in concentrations of brain metabolites associated with the tricarboxylic acid (TCA) cycle1 which is related to the glutamatergic and aspartate systems, and these systems are known to change under stress2. These two systems are dependent on metabolites such as glutamine (Gln), glutamate (Glu), N-acetyl aspartate (NAA), glutathione (GSH), and gamma-aminobutyric acid (GABA) which have closely connected and are affected under a stressful situation. We acquired metabolites of the mouse acute stress model using Magnetic Resonance Spectroscopy (MRS) consecutively over time. Using time-period metabolites data, we observed the changes in correlation coefficient due to acute stress.Methods
In this study, C57BL/6N male mice (n = 24, 18–25 g, 6 weeks old) were divided into control (n = 12) and stress (n = 12) groups. Stress group mice were restrained in a 50 mL conical tube for 2h3. MRS scanning was performed at a 9.4T Bruker Biospin Paravision 5.0 animal MR system (Bruker, Biospin, Ettlingen, Germany) using Point-REsolved Spectroscopy Sequence (PRESS) with acquisition parameters :TR/TE = 4000 ms/10 ms, number of data points = 4096, number of acquisitions=512 and voxel size = 1.8 x 3.4 x 1.8mm3. The MRS scan was repeated 4 times with no time interval between successive scans. Each 512 Free Induction Decay (FID) data was split into two 256 FID data to double the temporal resolution. Consequently, 8 consecutive FID data were obtained for each mouse (Fig. 1) and frequency and phase drift were corrected using FID-A software4,5. MRS data were analyzed with the LCModel6 using 17 simulated basis-set and the concentrations of 11 brain metabolites were obtained with a criterion of Cramer-Rao lower bound (CRLB) < 35%. We identified five metabolites closely related to the TCA cycle, the glutamatergic system, and the aspartate system from the 11 metabolites: Gln, Glu, NAA, GSH, and GABA. For each group, non-parametric Spearman correlation coefficients between the five metabolites were calculated at each time point related to acute stress. The non-parametric one-sample sign test was used to determine the significance of the correlation coefficients with two thresholds (0.45, 0.5) for each group.Results
At both thresholds, the control group did not show a significant correlation between the five metabolites, and the acute stress group showed significant correlations in Gln-GSH, Glu-NAA, and GSH-NAA (Fig 2).Discussion
Unlike previous MRS studies on stress that focused on changes in metabolite concentration at any point in time, this study investigated the effects of acute stress in the hippocampus based on the correlation between the metabolites related to the glutamatergic and aspartate systems through the TCA cycle. Our study showed that a new correlation was founded between Gln-GSH, Glu-NAA and NAA-GSH in the acute stress group. Acute stress expedites the release of corticosterone, which combines with glucocorticoid receptors (GRs) to accelerate the release of excitatory metabolites in the hippocampus7,8. This mechanism causes changes in the concentrations of Gln, GSH, and NAA, which are involved in the glutamatergic pathway and the TCA cycle (Fig 3). These physiological responses appear to have produced positive correlations between Gln-GSH, Glu-NAA, and NAA-GSH were observed in the acute stress group.Conclusion
This study was the first to demonstrate the effect of acute stress by evaluating changes in physiological relationships using correlation coefficients between brain metabolites using MRS time series data. Our study suggests that the correlation coefficient between metabolites can be a useful measure to investigate the effect of acute stress.Acknowledgements
This research was supported by the Brain Research Program of the National Research Foundation (NRF) funded by the Korean government (MSIT) (2016M3C7A1905385).References
- Gandhi S, Devi MM, Pal S, et al. Metabolic regulatory variations in rats due to acute cold stress & Tinospora Cordifolia intervention: high resolution 1 H NMR approach. Metabolomics. 2012;8(3):444-53.
- Xu S, Liu Y, Pu J, et al. Chronic stress in a rat model of depression disturbs the glutamine-glutamate-GABA cycle in the striatum, hippocampus, and cerebellum. Neuropsychiatr Dis Treat. 2020;16:557-70.
- Iwakabe K, Shimada M, Ohta A, et al. The restraint stress drives a shift in Th1/Th2 balance toward Th2-dominant immunity in mice. Immunol Lett. 1998;62(1):39-43.
- Simpson R, Devenyi GA, Jezzard P, et al. Advanced processing and simulation of MRS data using the FID appliance (FID-A)-an open source, MATLAB-based toolkit. Magn Reson Med. 2017;77(1):23-33.
- Near J, Edden R, Evans CJ, et al. Frequency and phase drift correction of magnetic resonance spectroscopy data by spectral registration in the time domain. Magn Reson Med. 2015;73(1):44-50.
- Provencher SW. Automatic quantitation of localized in vivo 1H spectra with LCModel. NMR Biomed. 2001;14(4):260-264.
- Franklin TB, Saab BJ, Mansuy IM. Neural mechanisms of stress resilience and vulnerability. Neuron. 2012;75(5):747-61.
- Coughlin JM, Tanaka T, Marsman A, et al. Decoupling of N-acetyl-aspartate and glutamate within the dorsolateral prefrontal cortex in schizophrenia. Curr Mol Med. 2015;15(2):176-83.
Figures
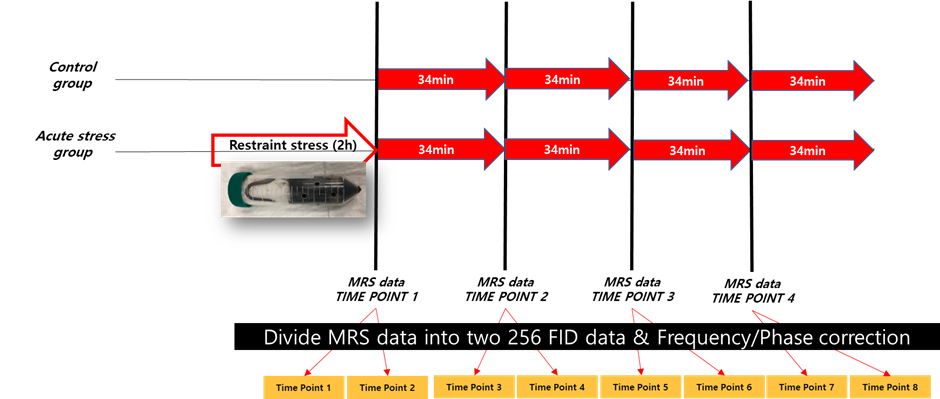
Fig.
1. The 256 FID MRS data acquisition protocol in the acute stress experiment
using 9.4T Bruker equipment.
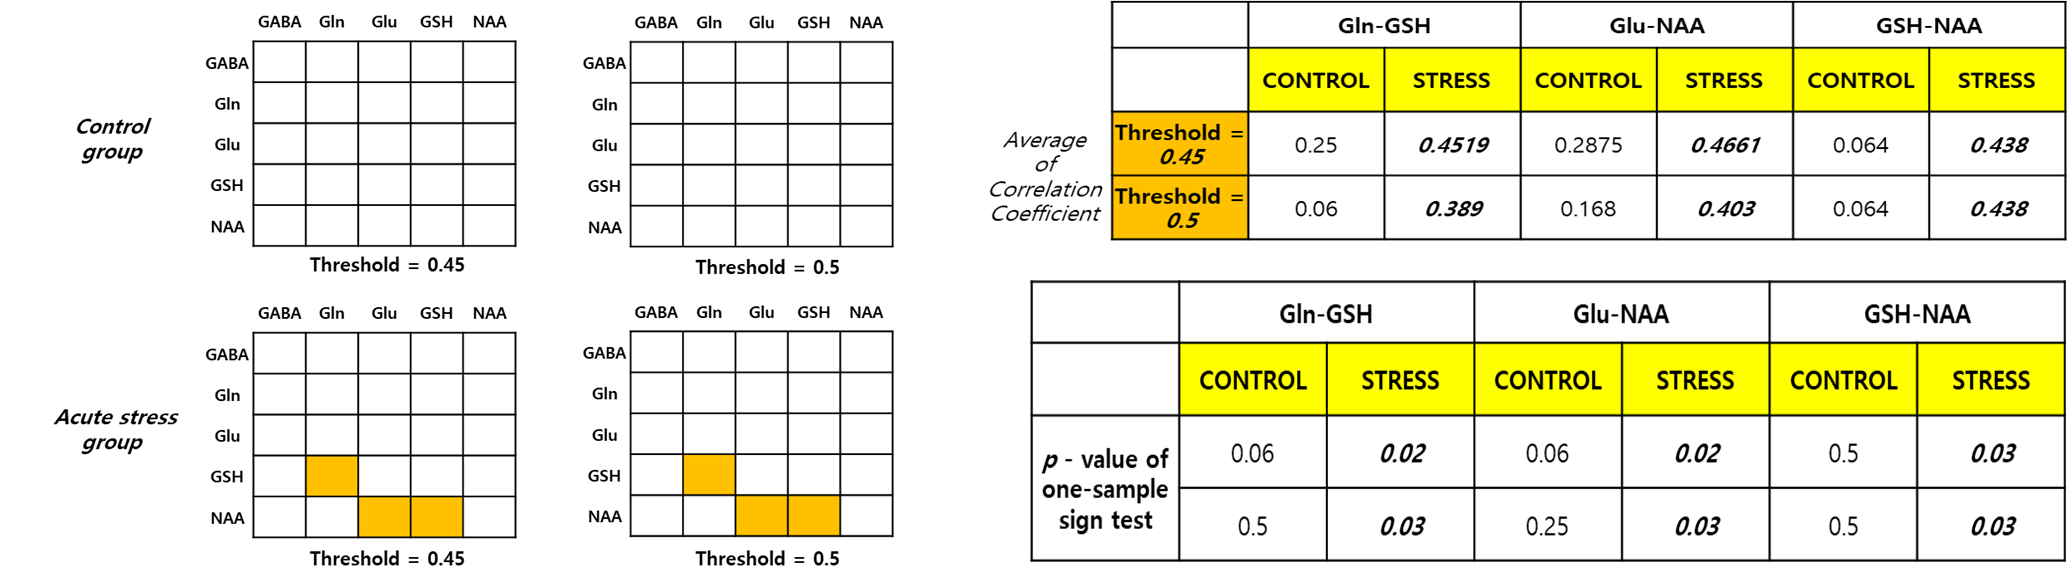
Fig. 2. Non-parametric sign test about correlation
coefficient value both of two experimental groups. The orange box is satisfied
with the statistically significant sign test p < 0.05. The Control group
has not significant correlation coefficient between
all metabolites. However, acute stress group have significant between Gln-GSH,
Glu-NAA, GSH-NAA.
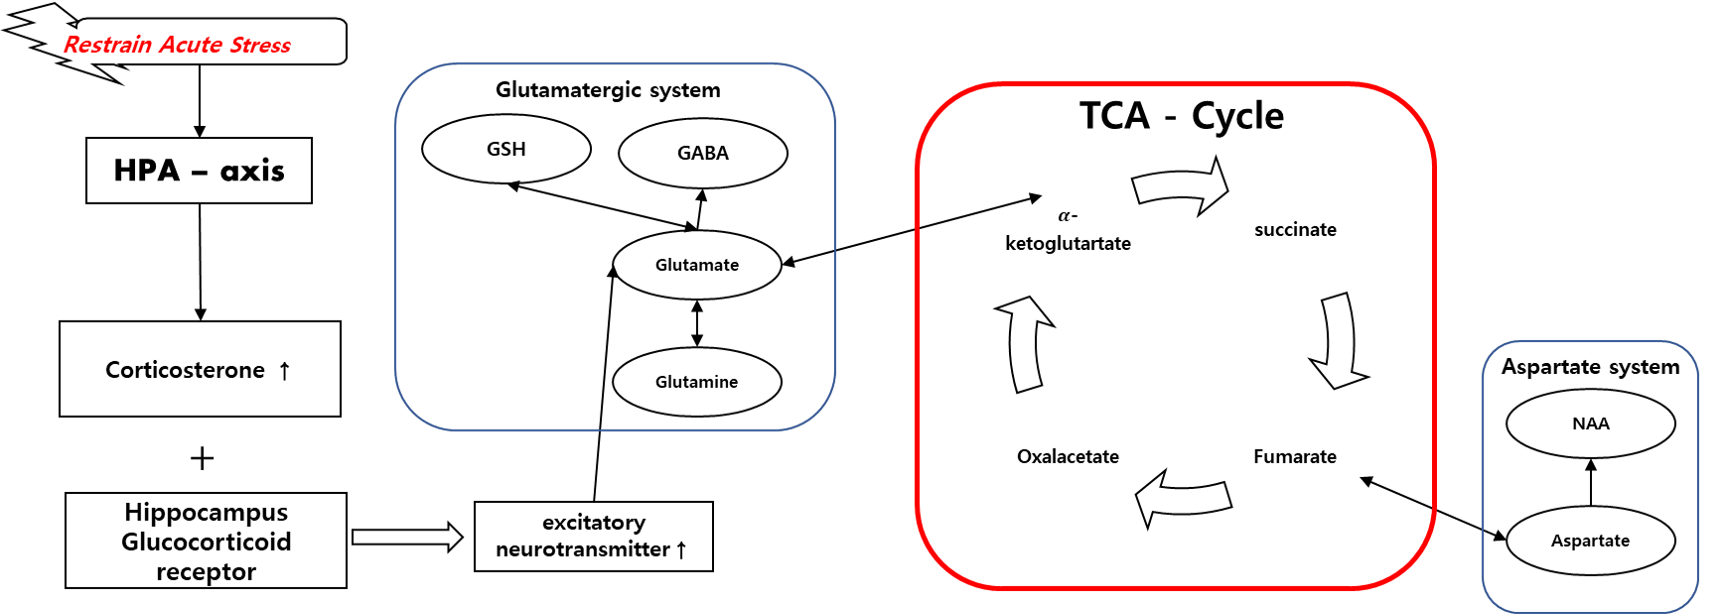
Fig. 3. Acute stress physiological protocol in hippocampus
and pathway of brain metabolites, acute stress activates the HPA-axis. This
activation effect to increase corticosterone level. Increased corticosterone
level combined with glucocorticoid receptor and hippocampus excitatory
neurotransmitter increased.