1208
Anatomical and microstructural brain alterations in the TDP-M323K mouse model of amyotrophic lateral sclerosis1Wellcome Centre for Integrative Neuroimaging, University of Oxford, Oxford, United Kingdom, 2Mouse Imaging Centre, The Hospital for Sick Children, Toronto, ON, Canada, 3Mammalian Genetics Unit, MRC Harwell Institute, Oxford, United Kingdom, 4Department of Neuromuscular Diseases, Institute of Neurology, University College London, London, United Kingdom
Synopsis
Amyotrophic lateral sclerosis is a devastating neurodegenerative disease, characterized by aggregates of TDP-43 protein in the brain of most patients. The TDP-M323K mouse has a mutation in the gene encoding the Tdp-43 protein, and presents progressive motor and neurological phenotypes. In this study, we assessed structural and microstructural alterations in the brain of TDP-M323K mice with preclinical MRI (7 tesla). High resolution images showed brain atrophy, but relative volume changes included hypertrophy in the cortex and hippocampus. Diffusion MRI revealed alterations compatible with neurodegeneration in the white matter and striatum. TDP-M323K mice recapitulate brain imaging phenotypes observed in ALS patients.
Introduction
Amyotrophic lateral sclerosis (ALS) is a progressive neurodegenerative disease that leads to death usually 3-4 years after onset. More than 30 genes have already been related to ALS, and patients show variable clinical alterations1. Despite this clinical and genetic variability, more than 98% of ALS patients present TDP-43 aggregates in the brain2. TDP-43 is an RNA-binding protein encoded by the gene TARDBP with a role on RNA processing and maturation, and mutations in TARDP account for ~5% of familial ALS3. However, the pathogenic mechanisms in ALS and how TDP-43 contributes to it are still unknown.Due to the heterogeneous nature of ALS, a range of animal models might better represent the ALS subgroups, potentially helping to better understand the disease mechanisms and in the assessment of candidate therapeutical approaches4. The TDP-M323K mouse is a model of ALS with a missense mutation in the Tardp gene (p.M323K) induced by ENU mutagenesis. Homozygous TDP-M323K mice present altered splicing in target mRNAs and altered regulation of the expression of multiple genes. These mice develop progressive neurological and motor phenotypes, with grip strength loss at 12 months of age, p62 and ubiquitin inclusions in the spinal cord and brainstem at 18 months of age, and reduction in motor units and motor neuron count in the spinal cord at 24 months of age5. However, it is not clear if they develop brain alterations similar to those observed in human ALS patients6,7.
In this study, we aimed to identify brain phenotypes in 12-month-old homozygous TDP-M323K mice using post-mortem MRI. Volumetric and microstructural changes were assessed with high-resolution structural T2w images and diffusion MRI.
Materials and Methods
Eight homozygous TDP-M323K mice and 8 wild-type (WT) littermates (females, 12-month-old, C57BL/6J-DBA/2J background) were studied (one sample excluded from the dMRI analysis due to image artefacts). Mice were anesthetized with ketamine/xylazine and intracardially perfused with PBS followed by formalin-4%, both containing a Gd-contrast agent (Gd-CA, 2mM; Gadovist, Bayer Vital GmbH, Leverkusen, Germany). Brains were kept in the skull, immersed overnight in formalin-4%/Gd-CA (2mM), and stored at 4°C in PBS/Gd-CA (2mM)/Na-azide (0.05%) until scanned.Structural MRI (Figure 1a) was performed on a 7.0 tesla MRI scanner (Agilent Inc., Palo Alto, CA), using sixteen custom-built solenoid coils in parallel8 (T2-weighted 3D-FSE, TEeff/TR=30/350ms, 6 echoes/TR, 4 averages, 40μm isotropic resolution, cylindrical acquisition of k-space9, scan time~14h). Images were registered using MBM.py10. Volumes were estimated from the Jacobian determinants and modelled as a function of genotype (mouse weight as a covariate, FDR correction). We considered both local volume changes, where a first affine registration was used to remove global scaling differences before calculating the relative Jacobian determinant, and global volume changes, where the absolute Jacobian determinant includes these global scaling differences.
Diffusion MRI was performed on a 7.0 tesla MRI scanner using a receive-only 4-channels surface cryoprobe and a volume transmit resonator (Bruker Biosystems, Etlingen, Germany). Diffusion-weighted images were acquired in 30 diffusion directions distributed across the sphere for 2 shells (b=2,500/10,000s/mm2), with four interleaved b=0 volumes (segmented EPI, TE/TR=30/500ms, 12 segments, 100μm isotropic resolution, scan time~14h). A separated b=0 volume with reversed phase encoding allowed to correct off-resonance effects using the package eddy11 (after Gibbs ringing correction12). Signal was fitted with diffusion kurtosis13 (tensor and mean kurtosis) and NODDI models14 (Figure 1b-f). The median value in regions of interest (Table 1) was extracted from the registered maps and compared between genotypes (t-tests, Bonferroni correction).
Results and Discussion
Total brain volume was 17.9% smaller in TDP-M323K mice (TDP-M323K: 382.2±7.5 mm3, WT 466.9±6.7 mm3, p=1.5e-12). However, TDP-M323K mice weighted 17.4% more than WT (TDP: 41.2±5.6 g, WT: 35.1±3.2 g, p=0.02, Figure 2), possibly recapitulating the overeating behaviour observed in ALS patients15.In the voxel-wise analysis, almost all brain regions were smaller in TDP-M323K when comparing global volumes calculated from the absolute Jacobians (Figure 3a). Multiple white matter regions presented atrophy in the relative comparison (Figure 3b). Interestingly, TDP-M323K showed increased relative volume, mainly in the cortex and hippocampus. This contrasts with the cortical thinning generally observed in ALS patients6, but is in agreement with increased grey matter volume in ALS patients without cognitive impairment7. It may reflect earlier stages of the disease, where pathological alterations such as inflammation would precede neuronal loss and atrophy, or compensatory mechanisms within the motor and extra-motor network.
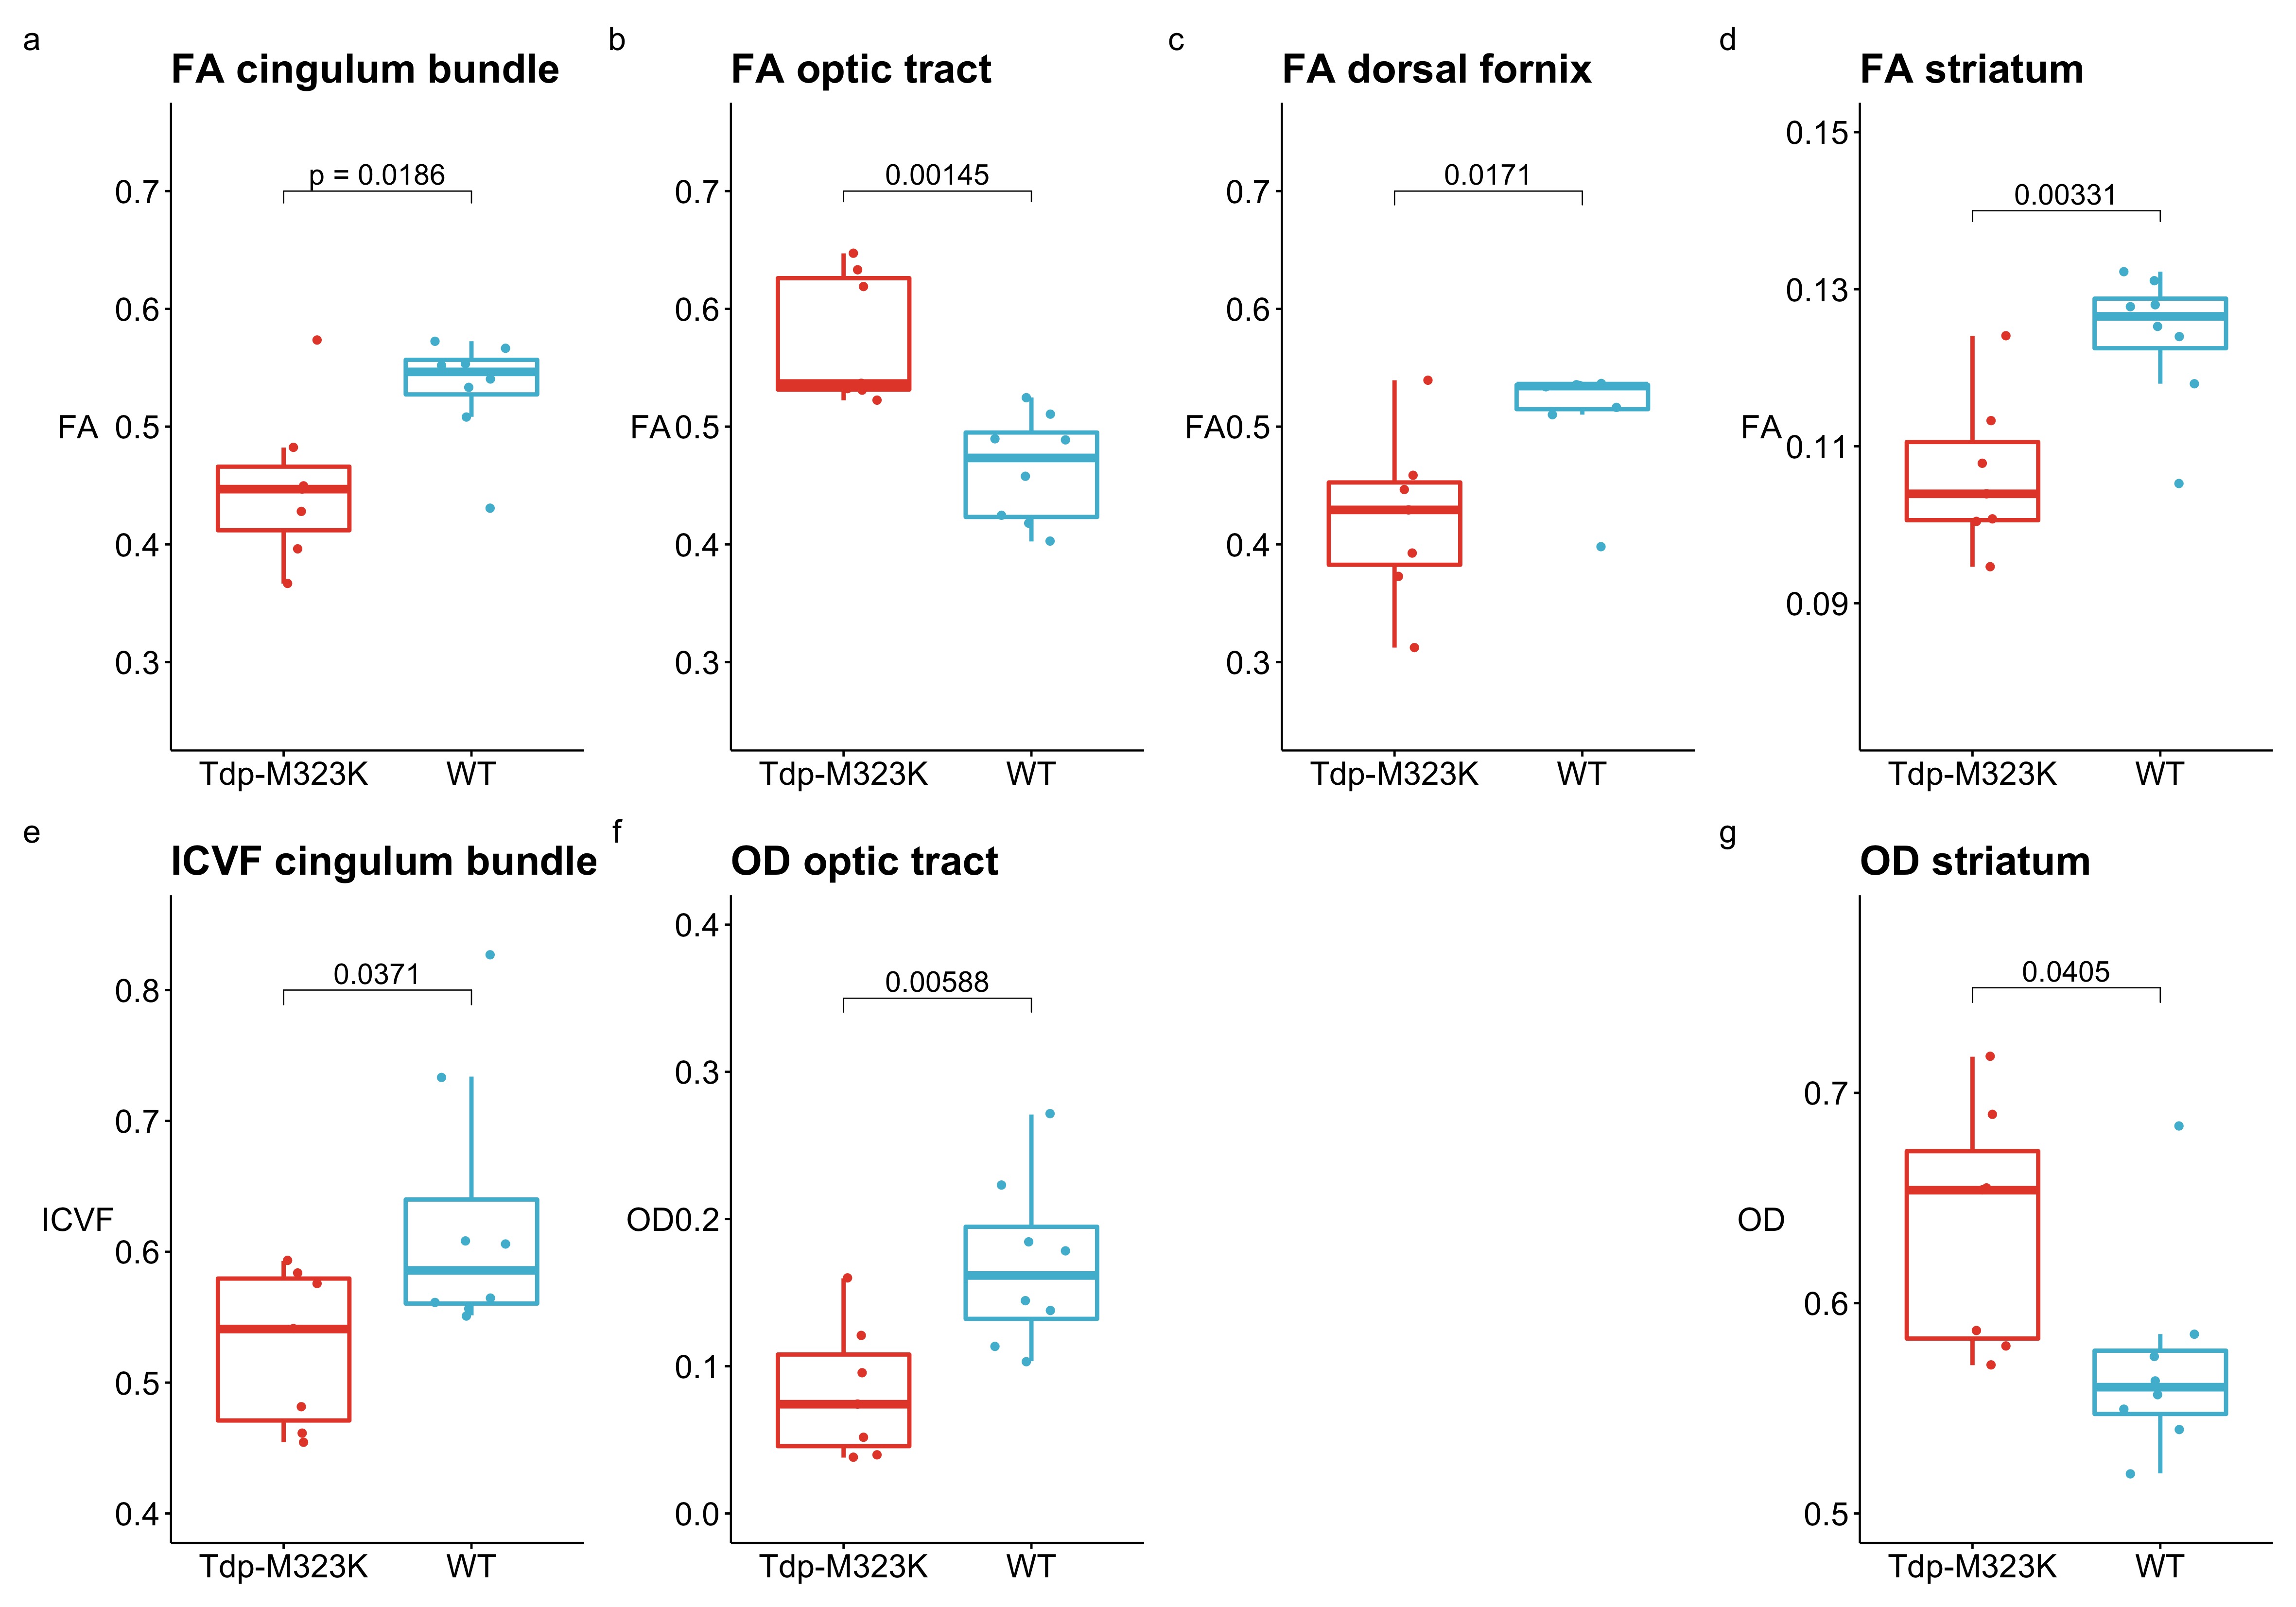
FA was reduced in the cingulum bundle, dorsal fornix and striatum of TDP-M323K mice. ICVF was also reduced in the cingulum bundle and OD was increased in the striatum (Figure 4). These alterations are in agreement with similar observations in ALS patients7 and mice16,17, and point to microstructural changes compatible with neurodegeneration and inflammation. Contrarily, TDP-M323K mice presented increased FA/reduced OD in the the optic tract. This apparently paradoxical increased FA has been already observed in neurodegeneration18, and can be associated with differential involvement of tracts in regions of crossing fibres or developmental differences.
Conclusions
TDP-M323K mice recapitulate brain imaging phenotypes observed in ALS patients, with volumetric and microstructural alterations detected with structural and diffusion MRI in 12-month-old mice. At this stage of the disease, a mild reduction in grip strength had been previously reported, indicating that earlier brain phenotypes could be detected with MRI in this mouse model.Acknowledgements
This work was supported by the Wellcome Trust (grant 202788/Z/16/Z), MRC and Harwell funding. The Wellcome Centre for Integrative Neuroimaging is supported by core funding from the Wellcome Trust (grant 203139/Z/16/Z).References
- van Es, M. A. et al. Amyotrophic lateral sclerosis. Lancet 390, 2084–2098 (2017).
- Mackenzie, I. R. A., Rademakers, R. & Neumann, M. TDP-43 and FUS in amyotrophic lateral sclerosis and frontotemporal dementia. Lancet Neurol. 9, 995–1007 (2010).
- Sreedharan, J. et al. TDP-43 Mutations in Familial and Sporadic Amyotrophic Lateral Sclerosis. Science (80-. ). 319, 1668–1672 (2008).
- Stephenson, J. & Amor, S. Modelling amyotrophic lateral sclerosis in mice. Drug Discov. Today Dis. Model. 25–26, 35–44 (2017).
- Fratta, P. et al. Mice with endogenous TDP‐43 mutations exhibit gain of splicing function and characteristics of amyotrophic lateral sclerosis. EMBO J. 37, e98684 (2018).
- Verstraete, E. et al. Structural MRI reveals cortical thinning in amyotrophic lateral sclerosis. J. Neurol. Neurosurg. Psychiatry 83, 383–388 (2012).
- Christidi, F. et al. Gray matter and white matter changes in non-demented amyotrophic lateral sclerosis patients with or without cognitive impairment: A combined voxel-based morphometry and tract-based spatial statistics whole-brain analysis. Brain Imaging Behav. 12, 547–563 (2018).
- Bock, N. A., Nieman, B. J., Bishop, J. B. & Henkelman, R. M. In vivo multiple-mouse MRI at 7 Tesla. Magn. Reson. Med. 54, 1311–1316 (2005).
- Spencer Noakes, T. L., Henkelman, R. M. & Nieman, B. J. Partitioning k -space for cylindrical three-dimensional rapid acquisition with relaxation enhancement imaging in the mouse brain. NMR Biomed. 30, e3802 (2017).
- Nieman, B. J. et al. MRI to Assess Neurological Function. Curr. Protoc. Mouse Biol. 8, e44 (2018).
- Andersson, J. L. R. & Sotiropoulos, S. N. An integrated approach to correction for off-resonance effects and subject movement in diffusion MR imaging. Neuroimage 125, 1063–1078 (2016).
- Kellner, E., Dhital, B., Kiselev, V. G. & Reisert, M. Gibbs-ringing artifact removal based on local subvoxel-shifts. Magn. Reson. Med. 76, 1574–1581 (2016).
- Jensen, J. H., Helpern, J. A., Ramani, A., Lu, H. & Kaczynski, K. Diffusional kurtosis imaging: The quantification of non-Gaussian water diffusion by means of magnetic resonance imaging. Magn. Reson. Med. 53, 1432–1440 (2005).
- Zhang, H., Schneider, T., Wheeler-Kingshott, C. A. & Alexander, D. C. NODDI: Practical in vivo neurite orientation dispersion and density imaging of the human brain. Neuroimage 61, 1000–1016 (2012).
- Ahmed, R. M. et al. Cognition and eating behavior in amyotrophic lateral sclerosis: effect on survival. J. Neurol. 263, 1593–1603 (2016).
- Gatto, R. G. et al. Unveiling early cortical and subcortical neuronal degeneration in ALS mice by ultra-high field diffusion MRI. Amyotroph. Lateral Scler. Front. Degener. 20, 549–561 (2019).
- Müller, H. P. et al. Longitudinal diffusion tensor magnetic resonance imaging analysis at the cohort level reveals disturbed cortical and callosal microstructure with spared corticospinal tract in the TDP-43 G298S ALS mouse model. Transl. Neurodegener. 8, 1–13 (2019).
- Douaud, G. et al. DTI measures in crossing-fibre areas: Increased diffusion anisotropy reveals early white matter alteration in MCI and mild Alzheimer’s disease. Neuroimage 55, 880–890 (2011).
- Dorr, A. E., Lerch, J. P., Spring, S., Kabani, N. & Henkelman, R. M. High resolution three-dimensional brain atlas using an average magnetic resonance image of 40 adult C57Bl/6J mice. Neuroimage 42, 60–69 (2008).
- Smith, S. M. et al. Tract-based spatial statistics: Voxelwise analysis of multi-subject diffusion data. Neuroimage 31, 1487–1505 (2006).
Figures
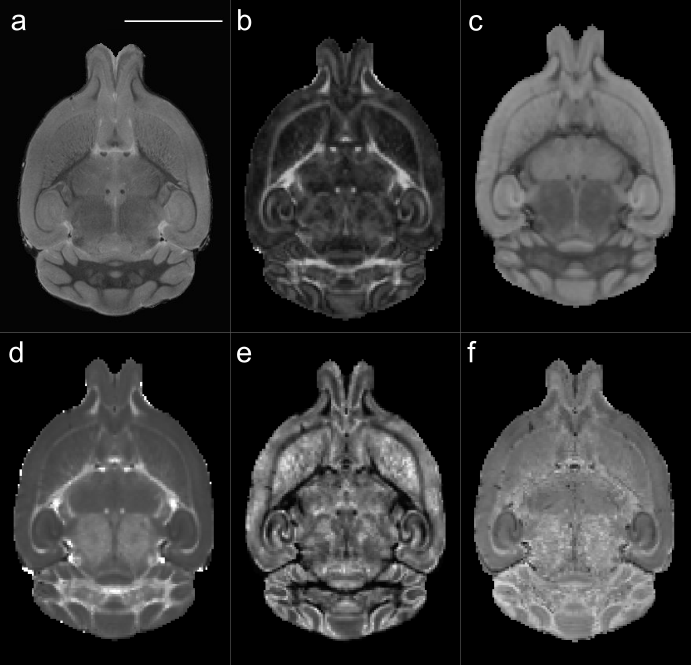

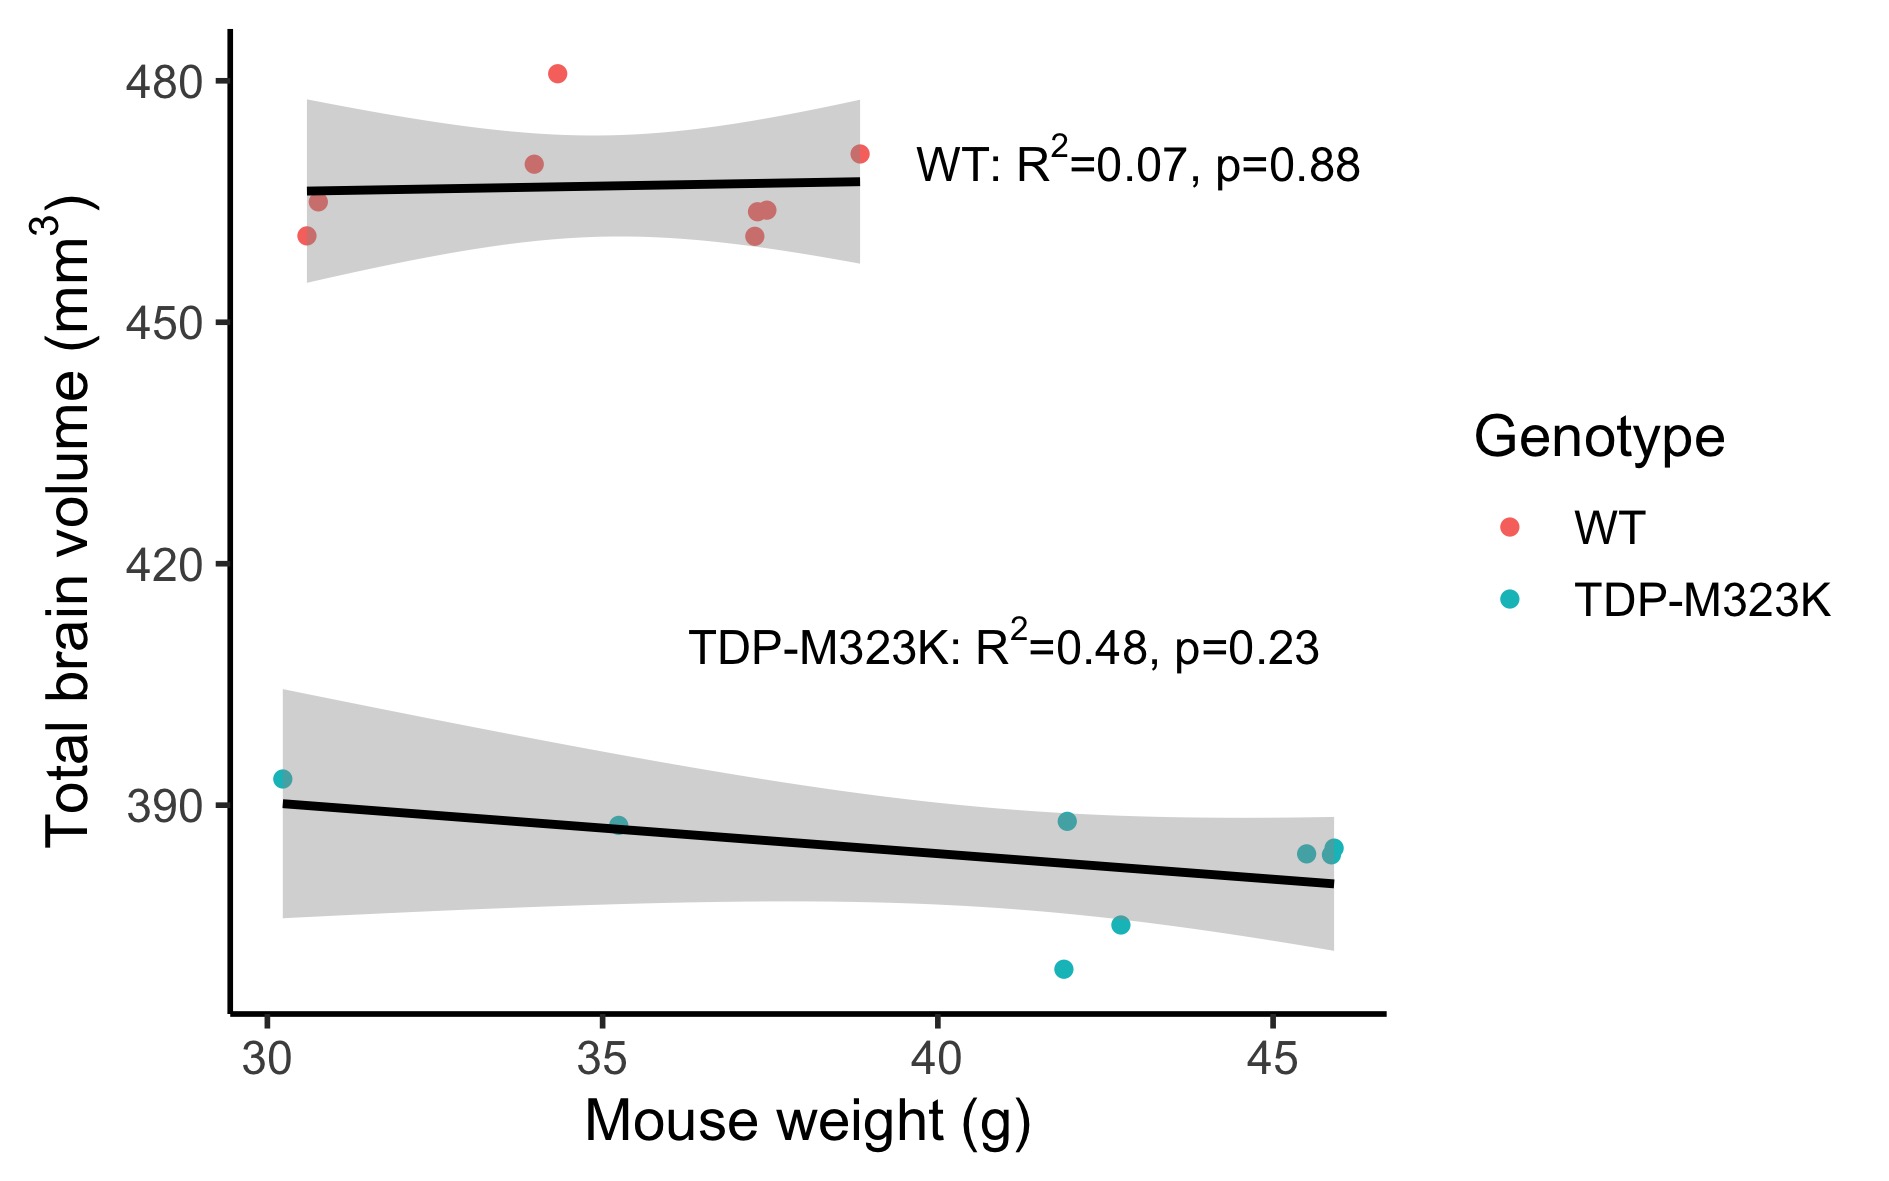
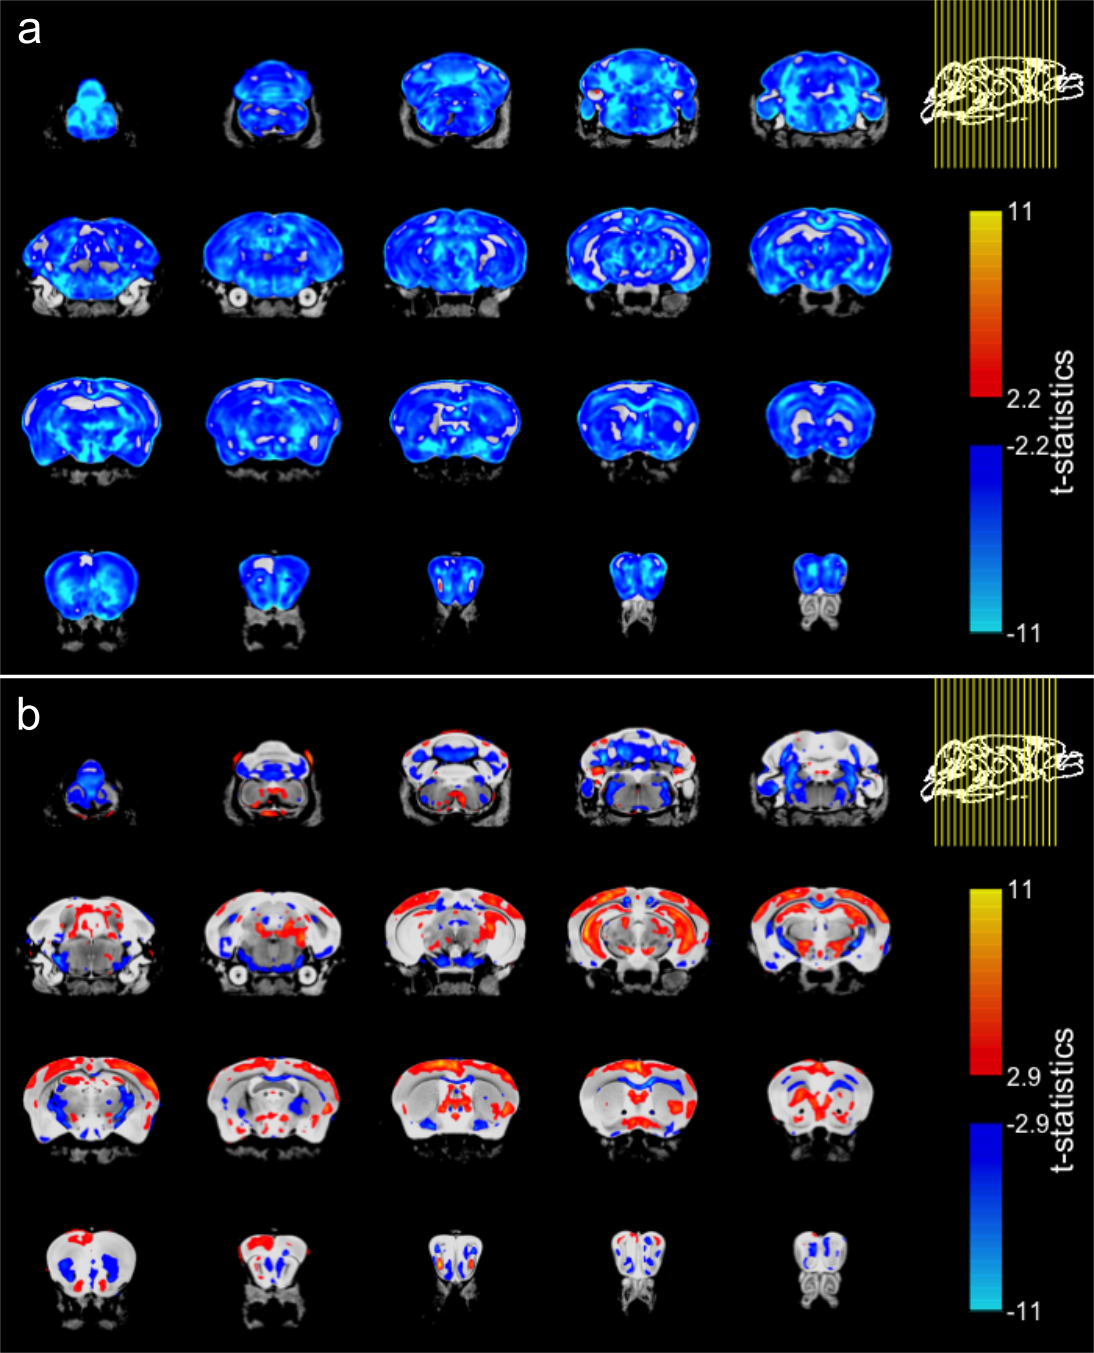
Figure 3. Effect of genotype in brain volume in TDP-M323K mice. (a) When compared directly to WT mice, TDP-M323K mice showed smaller volumes in almost all regions of the brain. (b) When volumes relative to the whole brain size were compared, TDP-M323K mice showed atrophy mainly in the white matter, while regions in the cortex and hippocampus had relatively increased volume. Most of the spatial patterns in t-statistics maps are bilaterally symmetric. Atrophic regions in TDP-M323K mice are show in blue and hypertrophic regions are show in red/yellow. False discovery rate of 5%.