1204
Whole-Brain T1 and T2 Mapping in Mouse by 3D Magnetic Resonance Fingerprinting1Department of Biomedical Engineering, Case Western Reserve University, Cleveland, OH, United States, 2Lerner Research Institute, Cleveland Clinic Foundation, Cleveland, OH, United States, 3Department of Radiology, Case Western Reserve University, Cleveland, OH, United States, 4Department of Pediatrics, Case Western Reserve University, Cleveland, OH, United States, 5Cancer Imaging Program, Case Western Reserve University, Cleveland, OH, United States, 6Biomedical Research Imaging Center (BRIC), University of North Carolina at Chapel Hill, Chapel Hill, NC, United States, 7Department of Physiology and Biophysics, Case Western Reserve University, Cleveland, OH, United States
Synopsis
We present a 3D MR fingerprinting (MRF) sequence for simultaneous T1 and T2 mapping in mouse. Data acquisition and reconstruction covered a field of view (FOV) of 30 × 30 × 9 mm3 with a matrix size of 128 x 128 x 9, yielding a spatial resolution of 0.23 × 0.23 × 1 mm3. Retrospective undersampling analysis was performed on fully-sampled phantom and mouse data to examine the undersampling capacity of the proposed sequence, demonstrating that the method supports up to 16-fold in-plane undersampling with a 3-fold through-plane undersampling.
Introduction
Preclinical investigations using mouse models, including genetically manipulated mouse models, provide the opportunity for the mechanistic understanding of disease pathophysiology, as well as for the longitudinal evaluation of disease progression and the response to novel therapeutic interventions. MR fingerprinting (MRF) allows simultaneous T1 and T2 mapping with unprecedented efficiency.1,2 Previously, we developed a single-slice MRF sequence that enabled simultaneous tracking of two MRI contrast agents in a single dynamic contrast-enhanced (DCE)-MRI scan.3,4 In the current study, we present further development of a 3D MRF sequence for brain-wide T1 and T2 mapping in mice. The potential of accelerated data acquisition for DCE-MRI studies was examined by comparing T1 and T2 mapping using retrospectively undersampled data.Methods
Sequence Design: The FISP-based 3D MRF sequence acquires a total of 768 frames partitioned into 16 segments. Segments 1, 5, 9, 13 were preceded by an inversion module with an inversion time of 21, 56, 400, 150 ms, respectively. Eight segments were preceded by a T2 prep module with a mixing time of either 45 ms (Segments 3, 7, 11, 15) or 60 ms (Segments 4, 8, 12,16). Data acquisition in each segment used flip angles ramped up sinusoidally 6° to a maximum value between 8° and 17°. Constant echo time (2.0 ms) and repetition time (10.0 ms) were used. The acquisition time of a single fingerprint was ~21 s. 3D MRF data were acquired using a stack-of-spiral trajectory.5,6 The spiral trajectory sampled the entire k-space in 48 interleaves with a FOV of 30 × 30 mm2, yielding an in-plane resolution of 0.23 x 0.23 mm2. Data acquisition in the slice direction covered 9 mm thickness in 9 phase-encoding steps, yielding a through-plane resolution of 1 mm.Data Acquisition: All experiments were performed on a Bruker 9.4T scanner with a 35-mm 1H volume coil. Fully-sampled 3D MRF data were acquired in vitro from a phantom and in vivo from 3-month-old male C57BL/6 mice. The phantom consisted of 7 compartments with varied manganese concentrations ranging from 50 to 350 µM. For in vivo scans, the mouse was anesthetized with 1% isoflurane mixed with 100% oxygen delivered via a nose cone. A custom-built cradle was used to hold the mouse in a prone position, with the brain positioned at the isocenter of the magnet. The respiration rate was monitored and maintained at 80 to 100 breaths/minute by adjusting the anesthesia level. The body temperature was monitored and maintained at 36.5°C to 37°C by circulating warm air (37.5°C) into the scanner bore.
Data Analysis: All images were reconstructed in MATLAB using the NUFFT toolbox. A dictionary was generated by solving the Bloch equation according to the MRF sequence. T1 and T2 values were derived from the best matching dictionary entry that was determined by calculating the inner product between the acquired fingerprint and all the dictionary entries. For evaluation of the undersampling capacity of the 3D MRF sequence, retrospective undersampling was performed on the fully sampled datasets. In-plane undersampling factors of 4, 8, 16, and 24, and a through-plane undersampling factor of 3 were evaluated. Normalized root-mean-square error (NRMSE) was used to evaluate the accuracy of undersampling.
Results
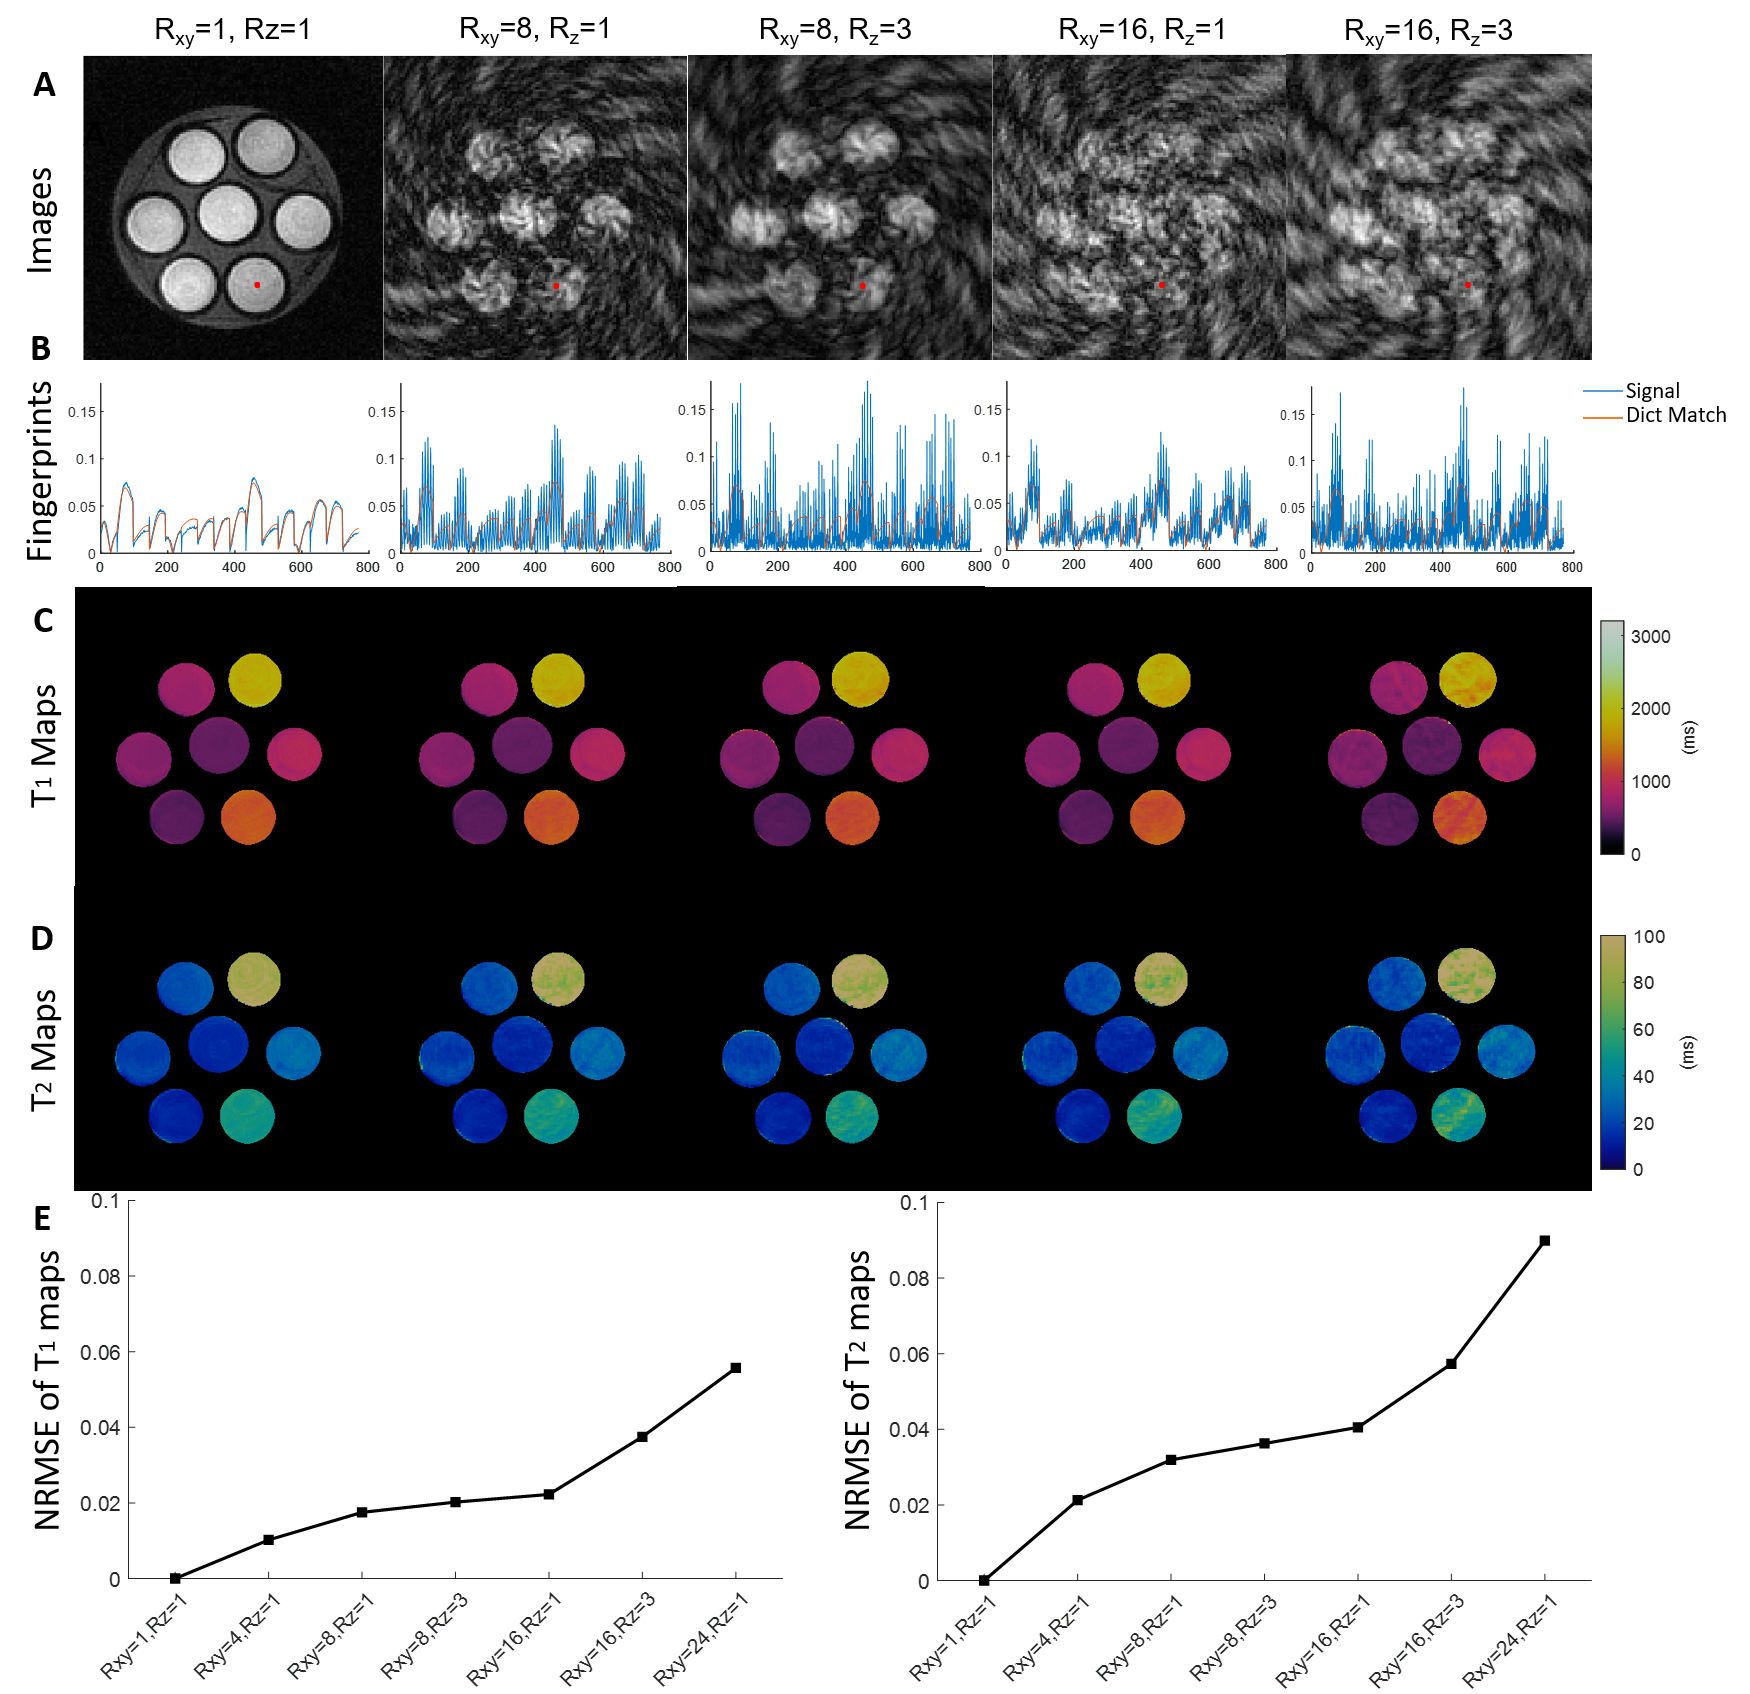
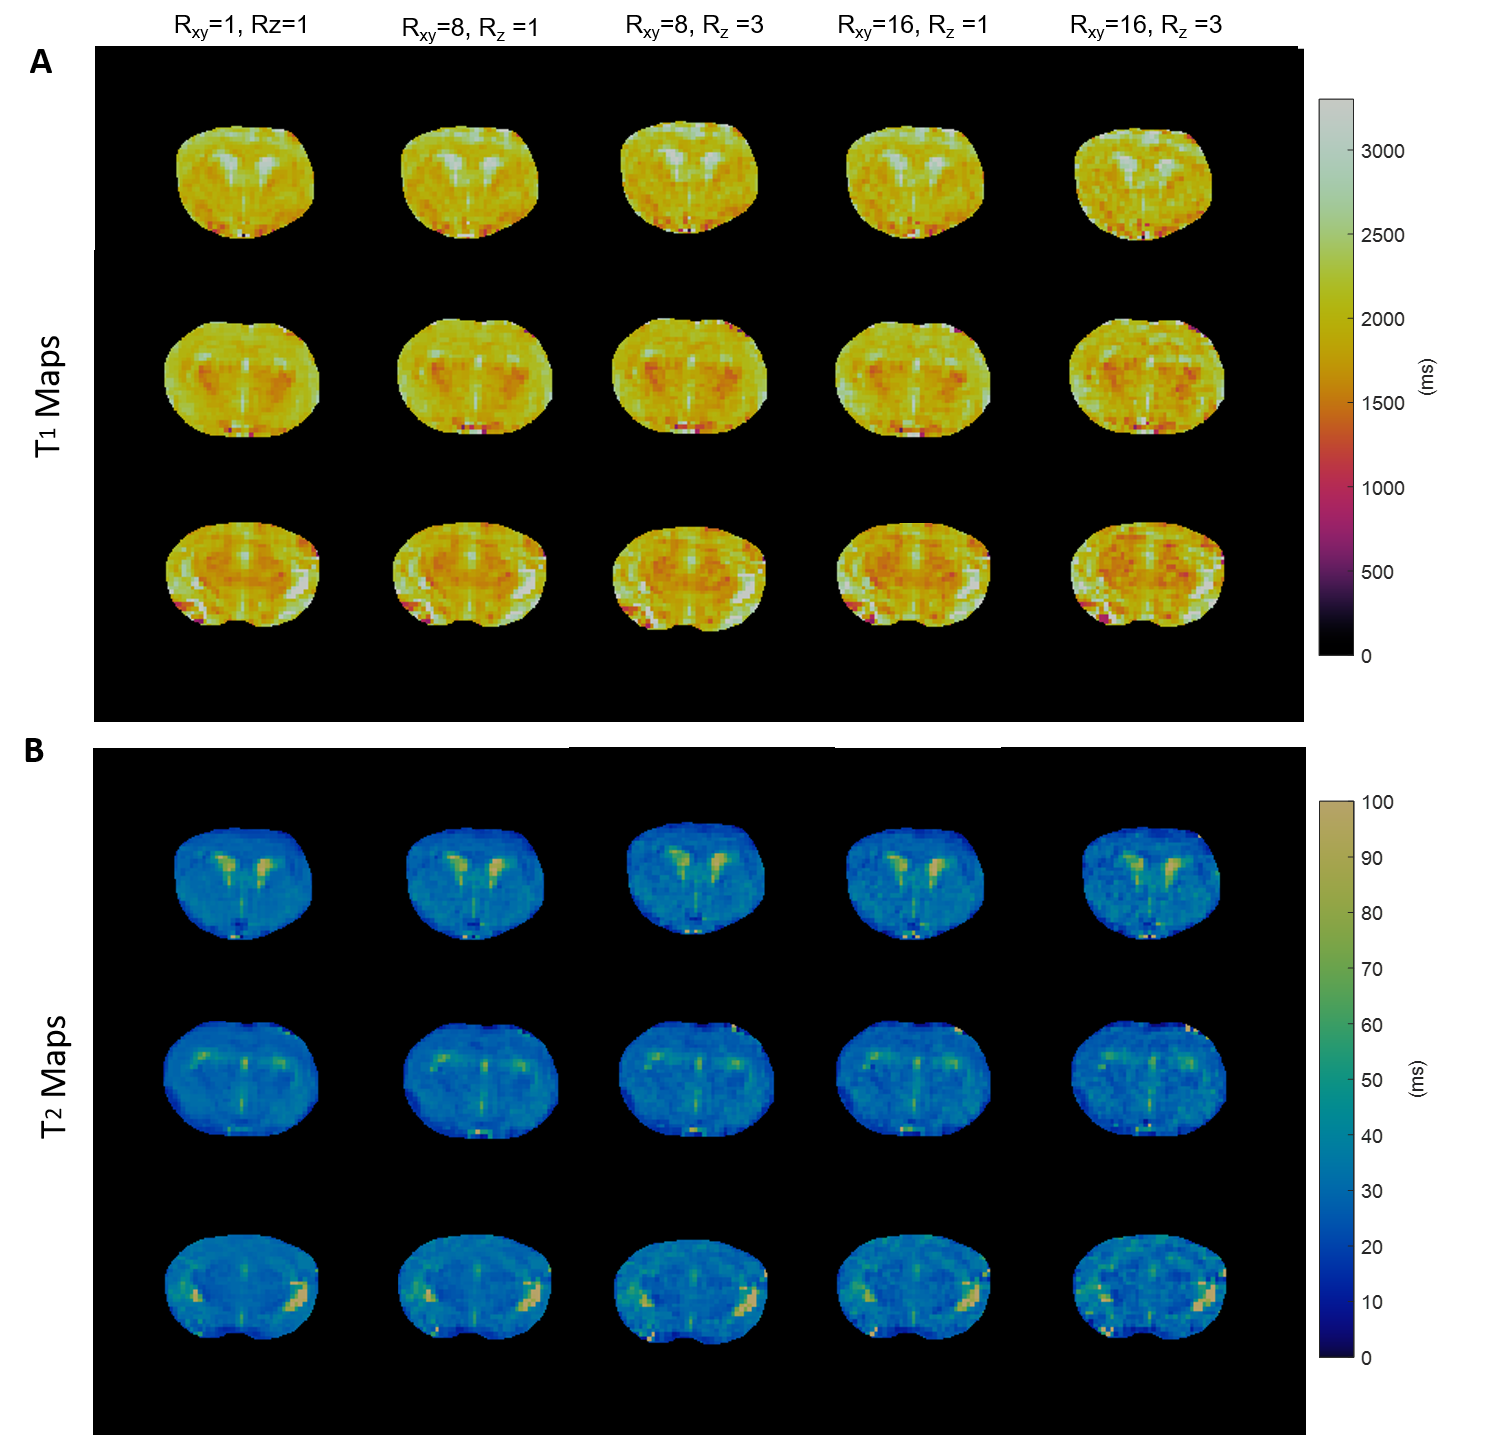
Reconstructed images, fingerprints, and T1 and T2 maps generated from both fully sampled and retrospectively undersampled phantom data are shown in Figure 1. With high in-plane undersampling factors (Rxy= 8, 16), aliasing artifacts became dominant in the images, and aliasing noise increased drastically in the corresponding fingerprints (Figure 1A-B). Adding through-plane undersampling (Rxy= 8, Rz= 3; Rxy= 16, Rz= 3) further increased the aliasing noise in both the reconstructed images and the fingerprints. However, a total undersampling factor of 48 had minimal impact on the estimated T1 and T2 maps (Figure 1C-D). While NRMSE increased with increased undersampling factor, it was below 10% for a total undersampling factor of 48 (Figure 1E). Figure 2 shows T1 and T2 maps from both fully sampled and retrospectively undersampled data acquired from a mouse brain. The T1 and T2 maps demonstrate that a 16-fold in-plane acceleration combined with a 3-fold through-plane acceleration still preserved the majority of the details with no obvious artifacts.Discussion and Conclusion
A 3D MRF sequence was developed for simultaneous T1 and T2 mapping of the entire mouse brain. Our results demonstrate that up to 16-fold in-plane and 3-fold through-plane undersampling can be achieved with adequate accuracy. This undersampling capacity will enable whole-brain T1 and T2 mapping in 3 to 5 minutes.Acknowledgements
This work was supported by a grant from the U.S. National Institute of Health (R01 EB23704).References
1. Ma D, Gulani V, Seiberlich N, et al. Magnetic resonance fingerprinting. Nature. 2013;495:187-192.
2. Jiang Y, Ma D, Seiberlich N, Gulani V, Griswold, M. A. MR fingerprinting using fast imaging with steady state precession (FISP) with spiral readout. Magn Reson Med. 2015;74:1621-1631
3. Gu Y, Wang CY, Anderson CE, Liu Y, Hu H, Johansen ML, Ma D, Jiang Y, Ramos-Estebanez C, Brady-Kalnay S, Griswold MA, Flask CA, Yu X. Fast magnetic resonance fingerprinting for dynamic contrast-enhanced studies in mice. Magn Reson Med. 2018;80(6):2681-2690.
4. CE Anderson, M Johansen, BO Erokwu, H Hu, Y Gu, Y Zhang, M Kavran, J Vincent, ML Drumm, MA Griswold, NF Steinmetz, M Li, X Yu, SM Brady-Kalnay, CA Flask. Dynamic, simultaneous concentration mapping of multiple MRI contrast agents with dual contrast - magnetic resonance fingerprinting. Sci. Rep. 2019;9:19888.
5. Thedens, D.R., Irarrazaval, P., Sachs, T.S., Meyer, C.H., Nishimura, D.G. Fast magnetic resonance coronary angiography with a three-dimensional stack of spirals trajectory. Magn Reson Med. 1999;41(6):631170–1179.
6. Liao C, Bilgic B, Manhard MK, Zhao B, Cao X, Zhong J, Wald LL, Setsompop K. 3D MR fingerprinting with accelerated stack-of-spirals and hybrid sliding-window and GRAPPA reconstruction. Neuroimage. 2017;162:13-22.
Figures