1201
Diagnostic value of Gd-contrast administration for spinal cord MRI in MS patients and T2 signal ratio as a predictive marker of lesion activity1Neuroradiology, University Clinic of Heidelberg, Heidelberg, Germany, 2Neurology, University Clinic of Heidelberg, Heidelberg, Germany
Synopsis
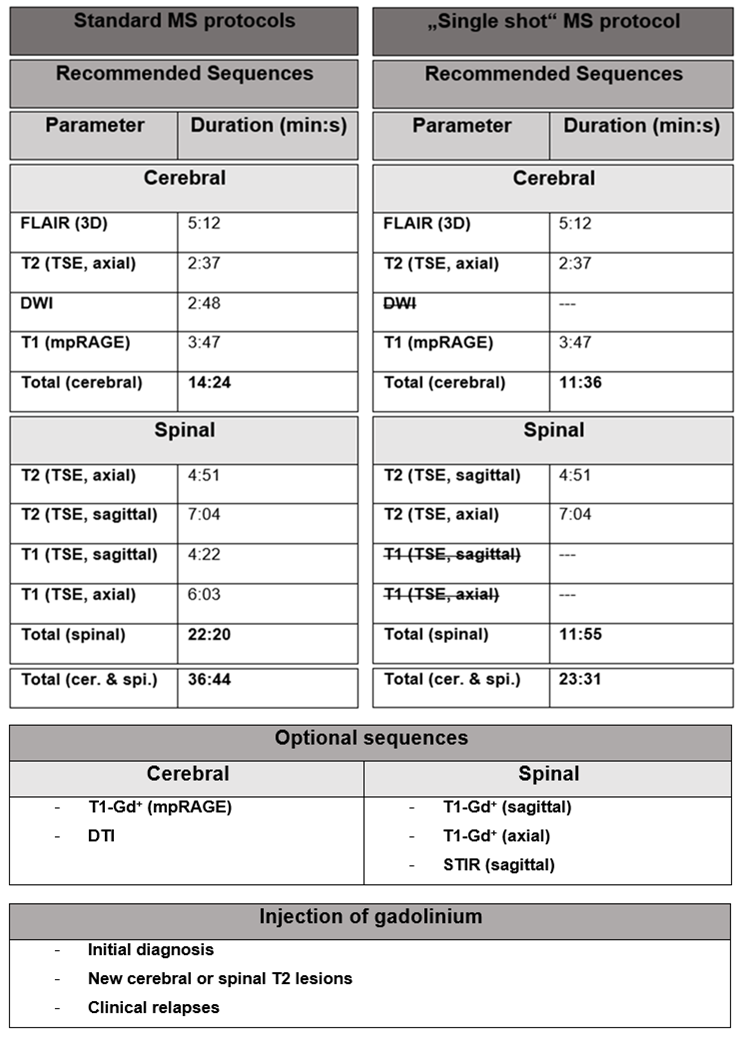
Our study shows that patients with a stable, spinal T2 lesion load do not benefit from the administration of GBCAs. In contrast to our previous cerebral study, there was no indication of spinal lesion re-activation. The T2 signal ratio has a high sensitivity and specificity to “predict” contrast enhancement of a given lesion and could be used as a predictive marker for “lesion activity”. In combination with previously published studies on the limited value of Gd-administration in cerebral MS follow-up investigations, we propose a “single-shot” MS protocol to combine cerebral and spinal MRI investigations in one standardized single MR protocol.
Objectives
MRI is the most important paraclinical parameter for diagnosis and monitoring of patients with multiple sclerosis (MS). Although spinal MS is often associated with coexisting cerebral lesions, 20% of spinal MS lesions are isolated. Also, spinal lesions are a known predictor of disease severity. Similar to cerebral MRI, gadolinium-based contrast agents (GBCAs) are routinely used in follow-up spinal MRI to detect Gd-contrast enhancement (CE) as a marker of acute inflammation. Recently, there have been major safety concerns regarding Gd-accumulation in deep cerebellar nuclei after multiple injections of linear GBCAs. So, assessing the diagnostic value of Gd administration for all indications is warranted. Our recent study on cerebral follow-up MRI examinations of MS patients demonstrated that Gd contrast administration might be dispensable if T2 lesions are stable compared to the previous examination. In cerebral MS we identified a small fraction of lesions (<5%) for which Gd-administration added diagnostic value (re-activated lesions, CE lesions not discernable and T2-w imaging). Previous studies have focused on cerebral MRI, whereas the diagnostic value of Gd-administration for spinal MRI has not been evaluated so far. It is conceivable that the importance of Gd-administration in spinal MRI is higher compared to cerebral MRI given the small anatomical structure of the spinal cord with less signal to noise, artifact-prone scanning and fewer available MR sequences. The present study investigates whether the routine administration of GBCAs is justified in all follow-up spinal examinations in a retrospective design in 65 patients (total of 257 MRIs). This seems relevant because detecting T2 lesions in the spinal cord can be challenging, especially for small and lateral cord lesions due to partial volume effects. We assessed MRI investigations in a cohort of patients to quantify disease activity on T2-w and contrast-enhanced T1-w imaging. Furthermore, we compared spinal and cerebral examinations in each patients during relapses to investigate correlative patterns of disease activity and to evaluate if Gd administration may be justified for spinal MRI if there is proven disease activity on cerebral MRI and vice versa. Furthermore, we investigated whether the degree of lesion “edema” quantified by the T2 signal ratio (T2 signal lesion / T2 signal normal appearing spinal cord) might be a predictor of contrast enhancement.Methods
We included 65 Multiple sclerosis (MS) patients with at least two spinal MRI follow-up examinations (mean follow-up time: 4.6 ± 2.4 years; mean number of MRIs: 3.9 ± 1.7; total number of MRI follow-up examinations: 192). Spinal MRI was performed at 3 Tesla with a standardized protocol including sagittal and axial T2-w TSE and T1-w TSE post contrast enhanced sequences. Images were analyzed for T2 and T1 contrast-enhancing lesions by two independent neuroradiologists. MS lesions were further assessed for size, localization and T2 signal ratio (T2 SR: signal lesion/T2 signal normal appearing spinal cord). Cerebral MRI investigations of the respective patients were reviewed to determine the odds ratio for concomitant disease activity at each site.Results
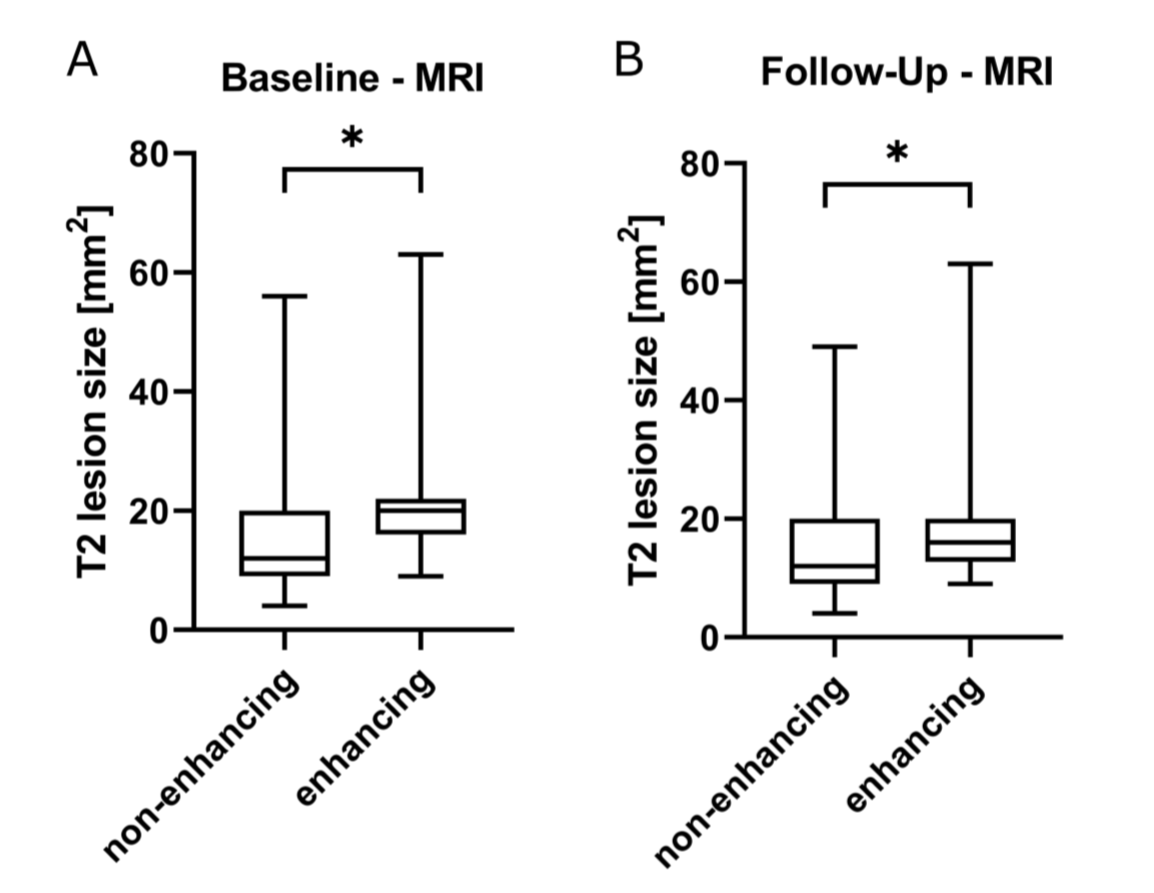
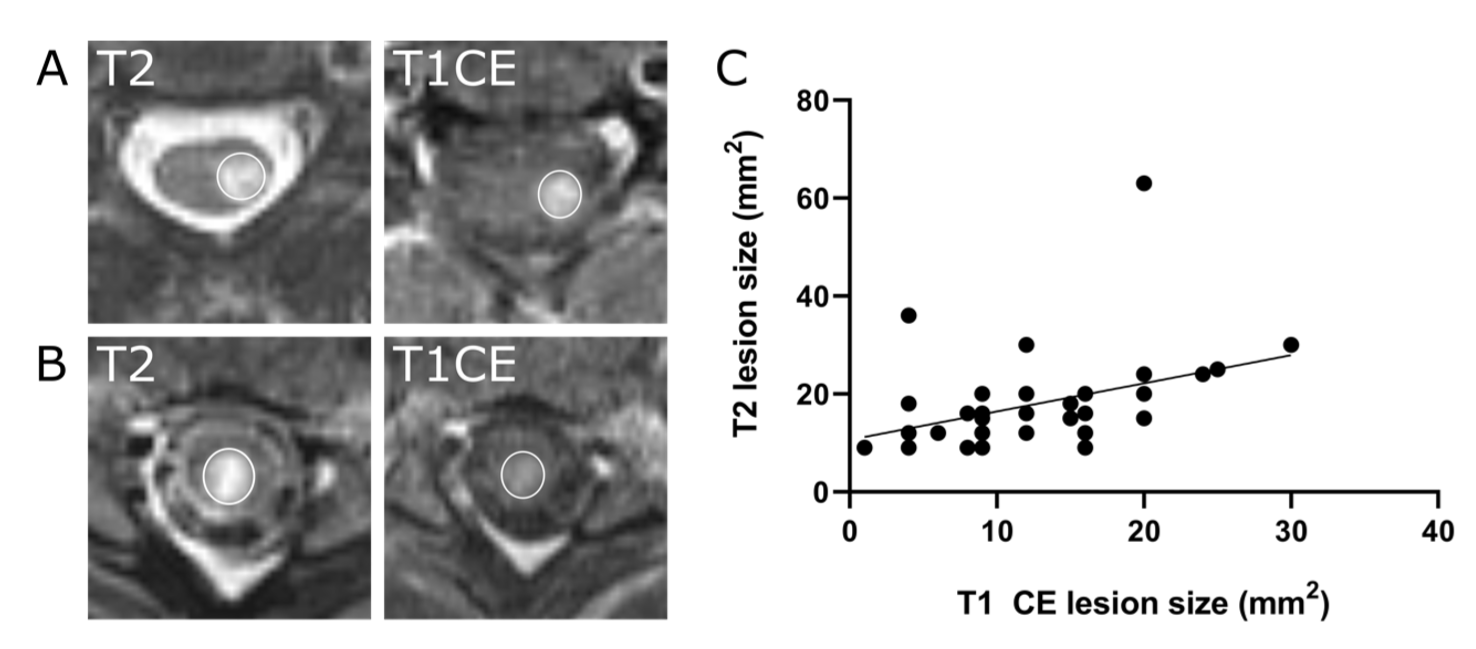
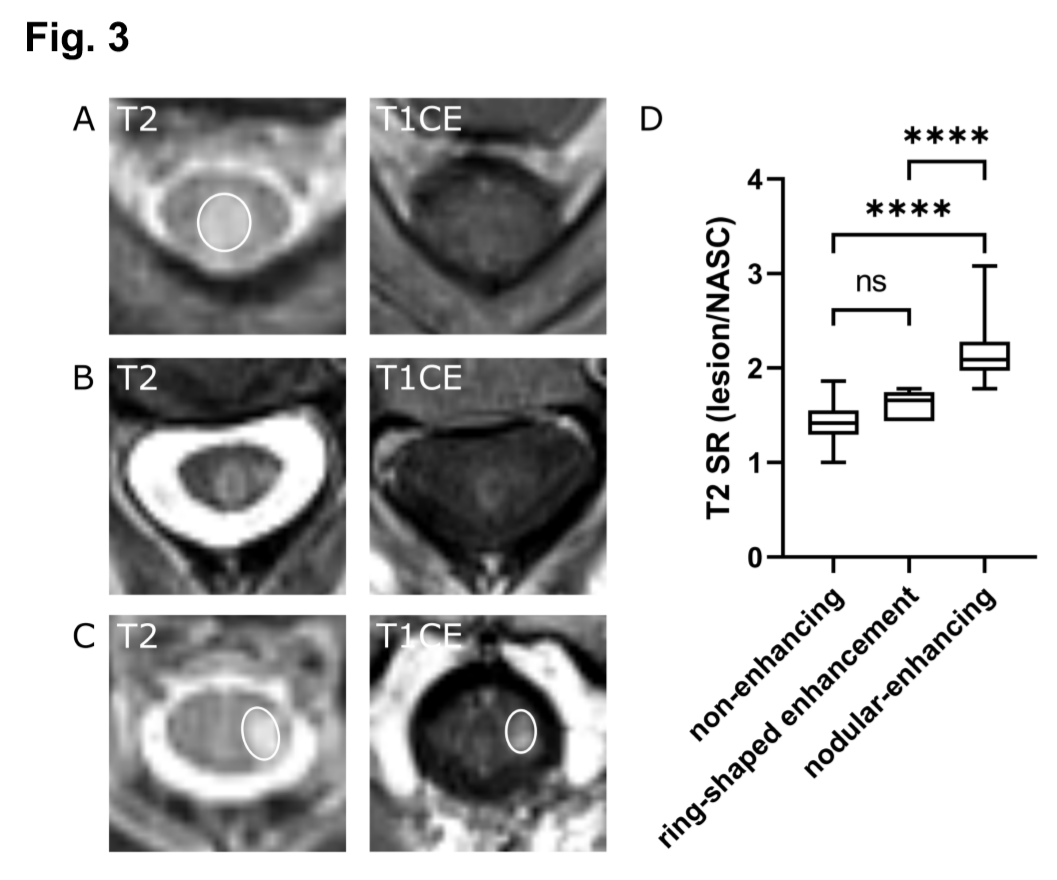
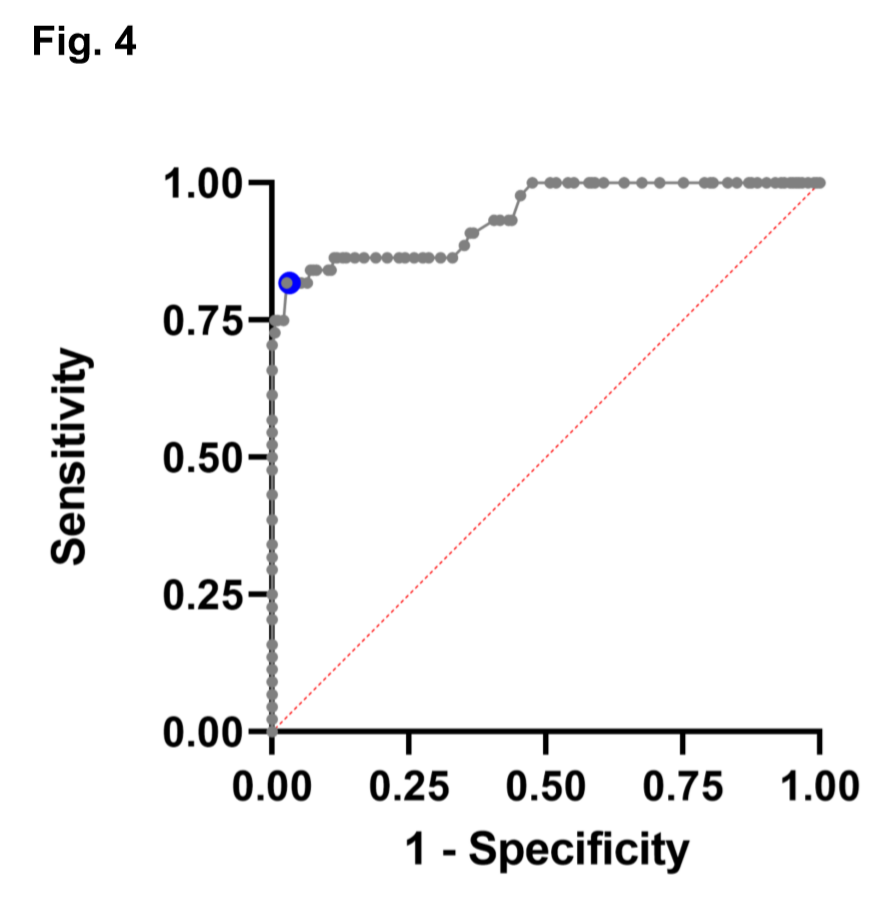
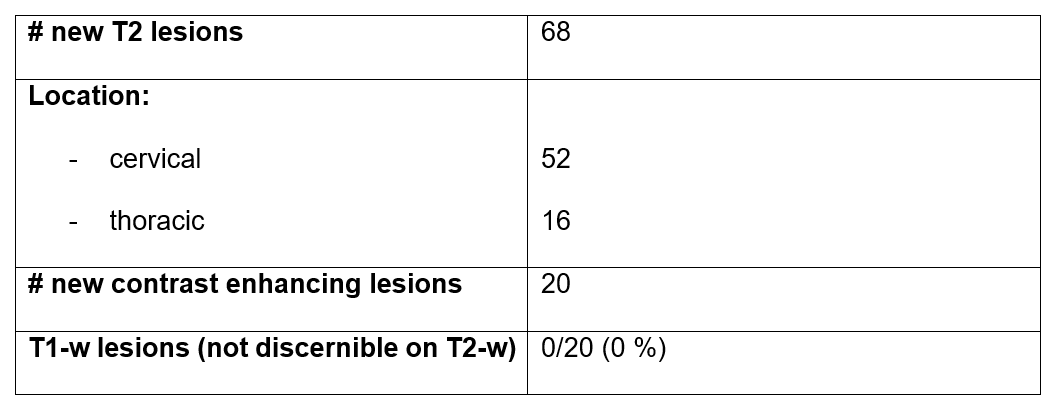
We identified a total of 68 newly developing spinal T2 lesions and 20 contrast-enhancing lesions during follow-up. New T2 lesions were present in 23 % (44/192) of the follow-up scans. Each enhancing lesion had a clear correlate as a new T2 lesion. As a predictive factor for lesion enhancement we found that enhancing lesions had a higher T2 SR compared to non-enhancing lesions (SR: 2.0 ± 0.4 vs 1.4 ± 0.2, ****p<0.001). ROC analysis showed a cut-off value of SR 1.78 to predict lesion enhancement with 82 % sensitivity and 97 % specificity. Disease activity defined as newly occurring T2 lesion on cerebral MRI scans predicted disease activity on spinal MRI and vice versa whereas concomitant enhancement was less frequent.Conclusion
Our study indicates that Gd-contrast administration is dispensable in follow-up spinal MRI of MS patients if no new T2 lesions are present. As a predictor for enhancing, “active” lesions we show high sensitivity and specificity of the T2 signal ratio. In conjunction with our previous cerebral MS study, we propose a shortened, single MRI investigation for routine follow-up MRI of the clinically stable MS patient combining spinal and cerebral MRI without Gd-contrast administration as a “one stop shop” strategy.Acknowledgements
The authors thank L. Diebold, Dr. S. Bonekamp and T. Badrow (Neuroradiology Department, University Hospital Heidelberg) for organizational and technical support of this study. K. Karimian-Jazi, M.O. Breckwoldt and M. Bendszus were supported by the Novartis Foundation for Therapeutic Research (Nürnberg, Germany). The funders had no influence in the design, analysis, or interpretation of the study.References
1. Wattjes
MP, Rovira A, Miller D, et al. Evidence-based guidelines: MAGNIMS consensus
guidelines on the use of MRI in multiple sclerosis--establishing disease
prognosis and monitoring patients. Nat Rev Neurol 2015;11:597-606.
2. Filippi M, Rocca MA, Ciccarelli O, et
al. MRI criteria for the diagnosis of multiple sclerosis: MAGNIMS consensus
guidelines. The Lancet Neurology 2016;15:292-303.
3. Noseworthy JH, Lucchinetti C, Rodriguez
M, Weinshenker BG. Multiple sclerosis. N Engl J Med 2000;343:938-952.
4. Kearney H AD, Samson RS, Yiannakas
MC, Wheeler-Kingshott CAM, Ciccarelli O,
Miller DH. Cervical cord lesion load is associated with disability
independently from atrophy in MS. Neurology 2014.
5. Lukas C SM, Bellenberg B, Hahn HK,
Popescu V, Bendfeldt K, Radue EW, Gass A, Borgwardt SJ, Kappos L, Naegelin Y,
Knol DL, Polman CH, Geurts JJ, Barkhof F, Vrenken H. . Relevance of spinal cord
abnormalities to clinical disability in multiple sclerosis: MR imaging findings
in a large cohort of patients. Radiology 2013.
6. Bonacchi R, Pagani E, Meani A, et al.
Clinical Relevance of Multiparametric MRI Assessment of Cervical Cord Damage in
Multiple Sclerosis. Radiology 2020;296:605-615.
7. Leguy S, Combes B, Bannier E, Kerbrat
A. Prognostic value of spinal cord MRI in multiple sclerosis patients. Rev
Neurol (Paris) 2020.
8. Thompson AJ, Banwell BL, Barkhof F, et
al. Diagnosis of multiple sclerosis: 2017 revisions of the McDonald criteria.
Lancet Neurol 2018;17:162-173.
9. Kanda T, Ishii K, Kawaguchi H, Kitajima
K, Takenaka D. High signal intensity in the dentate nucleus and globus pallidus
on unenhanced T1-weighted MR images: relationship with increasing cumulative
dose of a gadolinium-based contrast material. Radiology 2014;270:834-841.
10. Weberling LD, Kieslich PJ, Kickingereder P,
et al. Increased Signal Intensity in the Dentate Nucleus on Unenhanced
T1-Weighted Images After Gadobenate Dimeglumine Administration. Invest
Radiol 2015;50:743-748.
11. Karimian-Jazi
K, Wildemann B, Diem R, et al. Gd
contrast administration is dispensable in patients with MS without new T2
lesions on follow-up MRI. Neurol Neuroimmunol Neuroinflamm 2018;5:e480.
12. Eichinger
P, Schon S, Pongratz V, et al. Accuracy
of Unenhanced MRI in the Detection of New Brain Lesions in Multiple Sclerosis.
Radiology 2019;291:429-435.
13. Breckwoldt MO, Gradl J, Hahnel S, et al.
Increasing the sensitivity of MRI for the detection of multiple sclerosis
lesions by long axial coverage of the spinal cord: a prospective study in 119
patients. J Neurol 2017;264:341-349.
14. Chen Y, Haacke EM, Bernitsas E. Imaging
of the Spinal Cord in Multiple Sclerosis: Past, Present, Future. Brain Sciences
2020;10.
15. Eden D, Gros C, Badji A, et al. Spatial
distribution of multiple sclerosis lesions in the cervical spinal cord. Brain 2019;142:633-646.
16. Saslow L, Li DKB, Halper J, et al. An
International Standardized Magnetic Resonance Imaging Protocol for Diagnosis
and Follow-up of Patients with Multiple Sclerosis. International Journal of MS
Care 2020;22:226-232.
17. Lohrke J, Frisk AL, Frenzel T, et al.
Histology and Gadolinium Distribution in the Rodent Brain After the
Administration of Cumulative High Doses of Linear and Macrocyclic
Gadolinium-Based Contrast Agents. Invest Radiol 2017;52:324-333.
18. Rudie JD, Mattay RR, Schindler M, et al.
An Initiative to Reduce Unnecessary Gadolinium-Based Contrast in Multiple
Sclerosis Patients. J Am Coll Radiol 2019;16:1158-1164.
19. Mattay RR, Davtyan K, Bilello M,
Mamourian AC. Do All Patients with Multiple Sclerosis Benefit from the Use of
Contrast on Serial Follow-Up MR Imaging? A Retrospective Analysis. AJNR Am J
Neuroradiol 2018;39:2001-2006.
20. Sadigh G, Saindane AM, Waldman AD, Lava
NS, Hu R. Comparison of Unenhanced and Gadolinium-Enhanced Imaging in Multiple
Sclerosis: Is Contrast Needed for Routine Follow-Up MRI? AJNR Am J Neuroradiol
2019;40:1476-1480.
21. Tsagkas C, Magon S, Gaetano L, et al.
Spinal cord volume loss: A marker of disease progression in multiple sclerosis.
Neurology 2018;91:e349-e358.
22. Morgen
KJ, NO; Stone, R; Martin, R.; Richert, ND.; Frank, JA. and McFarland, HF. Ring-enhancement in multiple
sclerosis: marker of disease severity. 2001.
23. Davis M, Auh S, Riva M, et al. Ring and
nodular multiple sclerosis lesions: a retrospective natural history study. Neurology
2010;74:851-856.
Figures
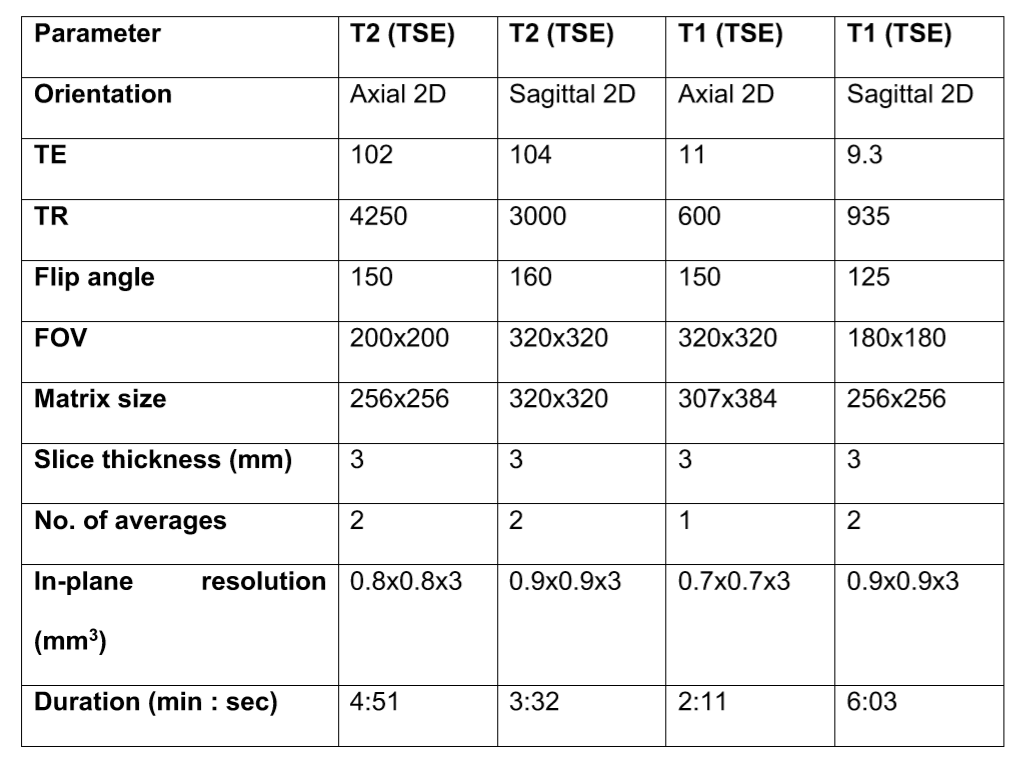
Abbreviations: FOV = field of view; TE = echo time; TR = repetition time; TSE = turbo spin echo.
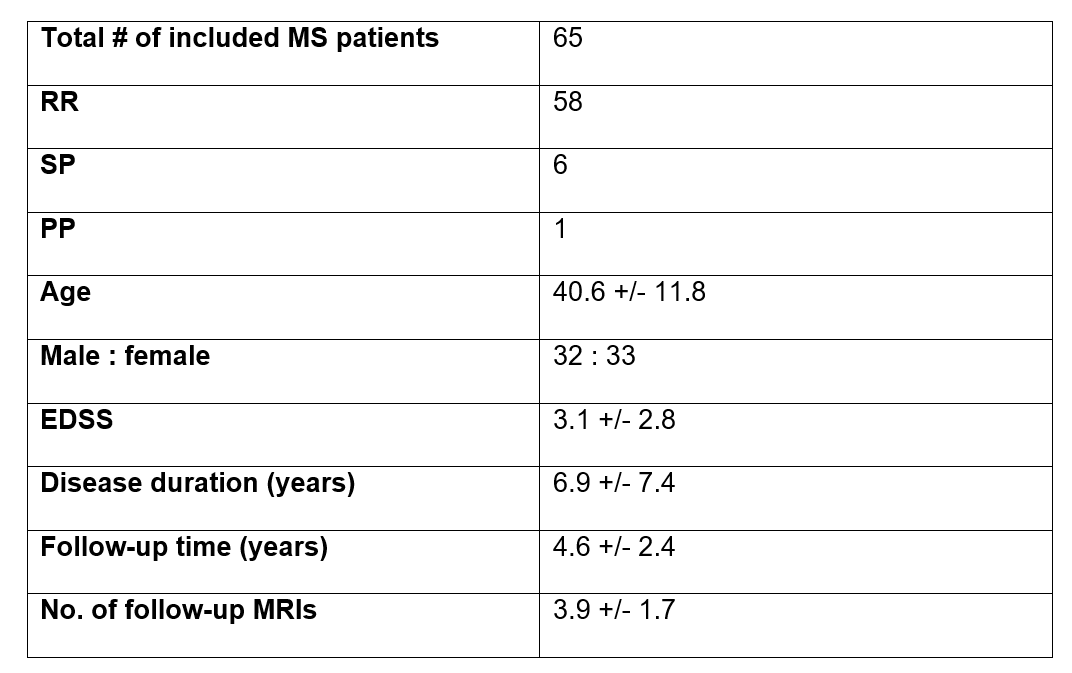
Abbreviations: EDSS = Expanded Disability Status Scale; PP = primary progressive MS; RR = relapsing-remitting MS; SP = secondary progressive MS. Values are shown as mean ± SD (range) for age and disease duration (years after first symptoms of MS) and median (range) for follow-up MRI. # number
Abbreviations: # number