1200
Detecting Extreme Small Lesions in MR images with Point Annotations via Multi-task Learning
Xiaoyang Han1, Yuting Zhai1, Botao Zhao1, and Xiao-Yong Zhang1
1Institute of Science and Technology for Brain-Inspired Intelligence, Fudan University, Shanghai, China
1Institute of Science and Technology for Brain-Inspired Intelligence, Fudan University, Shanghai, China
Synopsis
Detection of small lesions in magnetic resonance (MR) images is currently one of the most challenging tasks. Compared with detection in natural images, existing methods cannot accurately detect small lesions with a limited amount of information in MR images. To solve the problems, we propose a novel multi-task convolutional neural network, which simultaneously regresses the lesion number and detects the lesion location. We train and evaluate the end-to-end network to count and locate extreme small lesions within 3-5 voxels on a mouse brain MR image dataset with point annotations. Our network outperforms other methods on sensitivity and precision.
Introduction
Despite the excellent performance achieved by deep convolutional neural networks (CNN)1,2 for the detection of lesions in MR images, it is still challenging to detect small lesions less than 10 voxels in MR images. Compared with detection in natural images, the detection of small lesions in MR images faces two major challenges. First, small lesions only occupy a small fraction of voxels, yielding insufficient features and information for them to be distinguished from the surrounding tissues. Second,manual annotation of lesions is a time-consuming task. Additionally, manual labeling of lesions varies substantially between different annotators due to differing medical experiences. To solve the problems, we propose a novel multi-task learning convolutional neural network, which simultaneously performs regression of the lesion number and detection of lesion location.Materials and Methods
MRI dataset. Magnetic particulate matters were delivered into the mouse brain by tail vein injection to produce small lesions in the mouse brain. Susceptibility-weighted imaging (SWI) was used to show lesions within the brain. 644 SWI images were labeled with point annotations of each lesion. In the dataset with full segmentation annotations, 120 images are randomly selected as validation dataset and 120 images selected as test dataset. In total, 3626 lesions are labeled on 644 images in the total dataset and 438 lesions selected in the test dataset. Among them, 81.93% of lesions are within 3 to 5 voxels in the test dataset. Note, the voxel size of SWI is extremely small, only 0.06 × 0.06 × 0.5 mm3 per voxel.Multi-task Learning Network. The structure of our multi-task convolutional neural network with the encoder-decoder3 is shown in Figure 1. Our network architecture adds a regression network after the last convolutional layer in the encoder. Inspired by Attention U-net4, we add the attention gate to the decoder. The loss function of the multi-task learning method consists of a regression loss that quantifies the error in counting lesion numbers and a location loss that compares the ground-truth with the generated distance map. Our regression network consists of a block of consecutively stacked convolutional layers, followed by a global max-pooling and fully connected layers. For regression of lesion number, we use mean square error loss as the optimization function. For point annotations, geodesic distance maps are calculated using the method proposed in DM-FCN5. After the last layer in the decoder of the network, a convolutional layer with 1 × 1 kernel and a sigmoid activation function are added to learn the distance map. We use mean square error loss between output map and distance map as the location loss function. The final loss function for point annotation dataset is defined by
$$L_{reg}=\frac{1}{N}\sum_{n=1}^N(y_n-\hat{y}_n)^2$$
$$L_{loc}=\frac{1}{N}\sum_{n=1}^N(M_n-\hat{M}_n)^2$$
$$L = L_{reg} + \lambda L_{loc}$$
with $$$\lambda \in [0, 1]$$$.
Results and Disscusion
As shown in Figure 1, we introduce an encoder-decoder structure to construct our network in a fully convolutional architecture that outputs the location of each lesion. A regression network is added after the encoder to learn the count of lesions. These two tasks share the same encoder weights.Compared with the baseline, our method, the multi-task learning (v), performs much better than baseline methods (i)6 and (ii)7 on regression tasks since our mean square error is smaller than other methods by a large margin shown in Figure 2. Methods (i) and (v) reach a similar Pearson correlation, suggesting learning an extra task, i.e. lesion segmentation does not hamper the performance of lesion counting. Yet an additional attention mechanism reduces the regression performance, which could be due to the fact that the addition of the attention gate makes the entire network even deeper and more difficult to train in practice.
We summarize sensitivity, precision and average false positive per image (FPavg) in Figure 3. Trained on point annotation dataset, our methods (v) and (vi) reach higher sensitivity and precision than the method (iv), achieving a sensitivity of 46.10% and a precision of 73.72%. We found that the performance could be further improved by using an attention gate (vi), improving the sensitivity to 57.69% and the precision to 76.00%. To be noticed, small lesions in brain SWI images are mostly under 5 voxels, which is even smaller than visible pathology lesions, thus making our task even more challenging. As shown in representative results (Figure 4), our method works very well when only a few lesions appear. However, there exist false positive or false negative detection when the lesion number is increased. Encouragingly, our network outperforms other convolutional methods on both sensitivity and precision (Figure 2 and 3), without too much additional computation cost for network training.
Conclusion
We develop a multi-task learning model for extreme small lesion detection tasks, i.e. to detect magnetic particle deposition, in MR images. The proposed end-to-end network can simultaneously detect the number and the location of extreme small lesions within the mouse brain with acceptable precision and sensitivity.Acknowledgements
This study was supported in part by grants from the Shanghai Municipal Science and Technology Major Project (2018SHZDZX01), Three-year action plan for key global partners (IDH6282008/050/001/004) and the National Natural Science Foundation of China (81873893).References
- Yan, Ke, Mohammadhadi Bagheri, and Ronald M. Summers. "3D context enhanced region-based convolutional neural network for end-to-end lesion detection." International Conference on Medical Image Computing and Computer-Assisted Intervention. Springer, Cham, 2018.
- Tao, Qingyi, et al. "Improving deep lesion detection using 3d contextual and spatial attention." International Conference on Medical Image Computing and Computer-Assisted Intervention. Springer, Cham, 2019.
- Ronneberger, Olaf, Philipp Fischer, and Thomas Brox. "U-net: Convolutional networks for biomedical image segmentation." International Conference on Medical image computing and computer-assisted intervention. Springer, Cham, 2015.
- Oktay, Ozan, et al. "Attention u-net: Learning where to look for the pancreas." arXiv preprint arXiv:1804.03999 (2018).
- van Wijnen, Kimberlin MH, et al. "Automated lesion detection by regressing intensity-based distance with a neural network." International Conference on Medical Image Computing and Computer-Assisted Intervention. Springer, Cham, 2019.
- Dubost, Florian, et al. "3D regression neural network for the quantification of enlarged perivascular spaces in brain MRI." Medical image analysis 51 (2019): 89-100.
- Dubost, Florian, et al. "GP-Unet: Lesion detection from weak labels with a 3D regression network." International Conference on Medical Image Computing and Computer-Assisted Intervention. Springer, Cham, 2017.
Figures
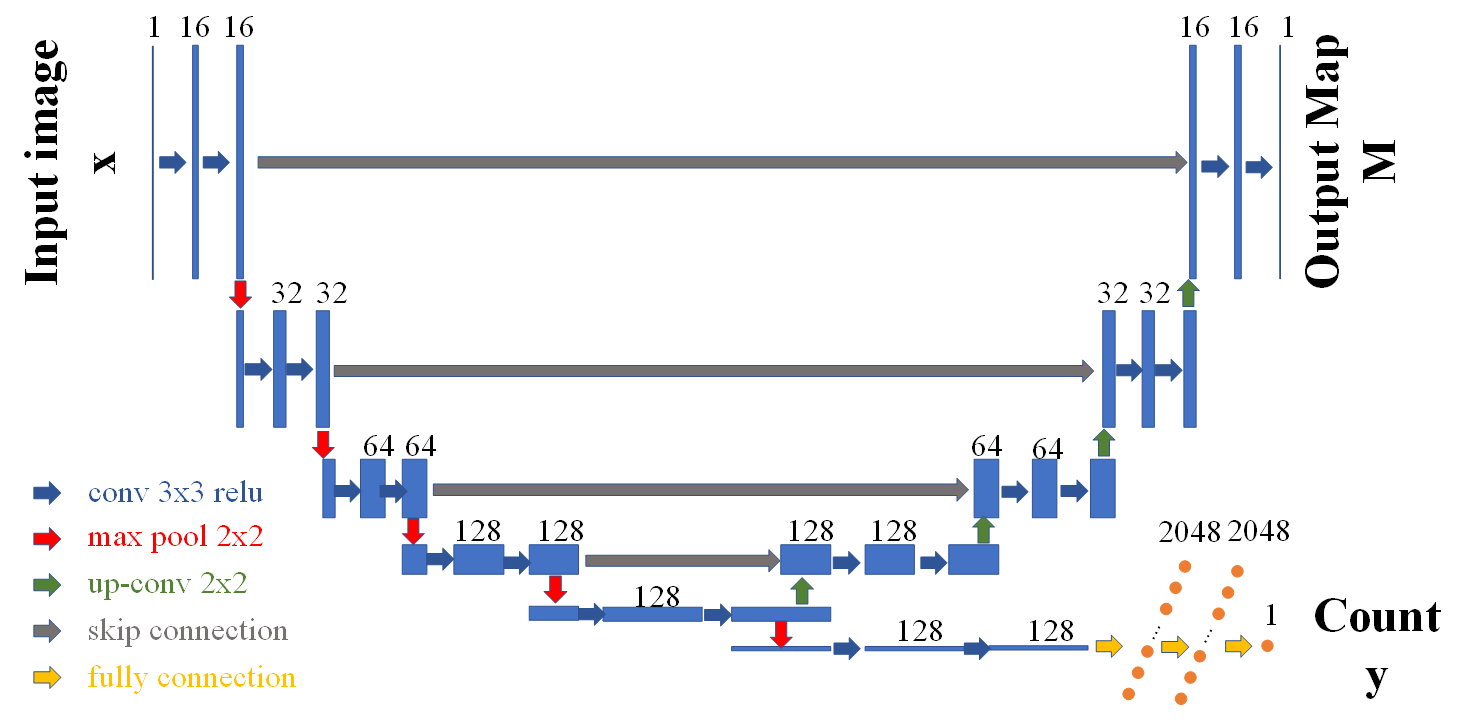
Figure 1. Multi-task learning structure. The input images are on the left; the output count of lesions is on the bottom right; the output map is on the top right: distance map for point annotation dataset and segmentation map for full segmentation dataset. After each convolutional layer, a rectified linear unit activation is applied. In the regression network, after the last convolutional layer, a global max-pooling layer is added to connect the following fully connected layers.
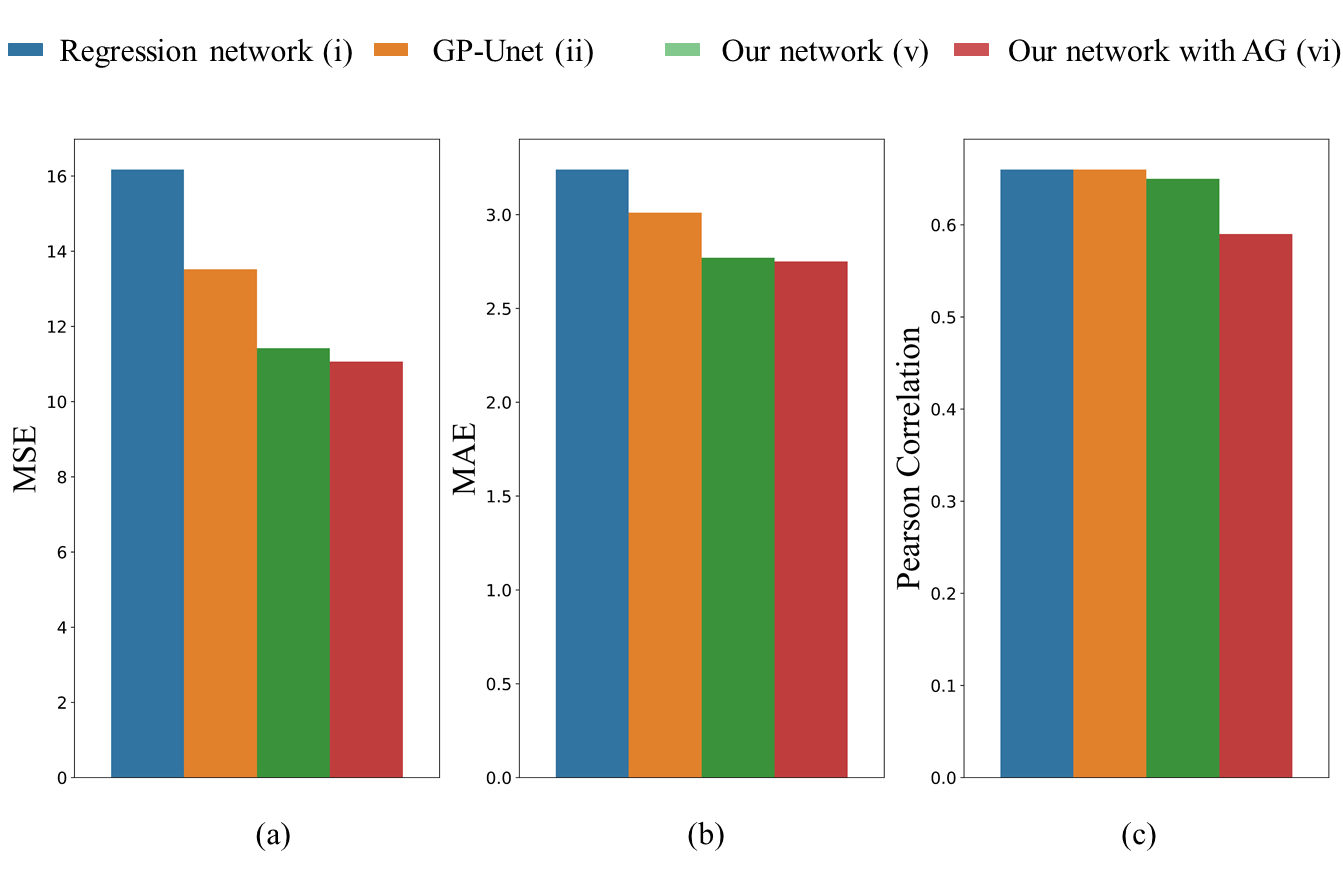
Figure 2. Regression results of our method in comparison to the baselines. Our network with the attention gate performs the best on (a) mean square error to 11.06 and (b) mean absolute error to 2.75. (c) All methods reach a similar Pearson correlation. All statistics are significant (p<0.005).
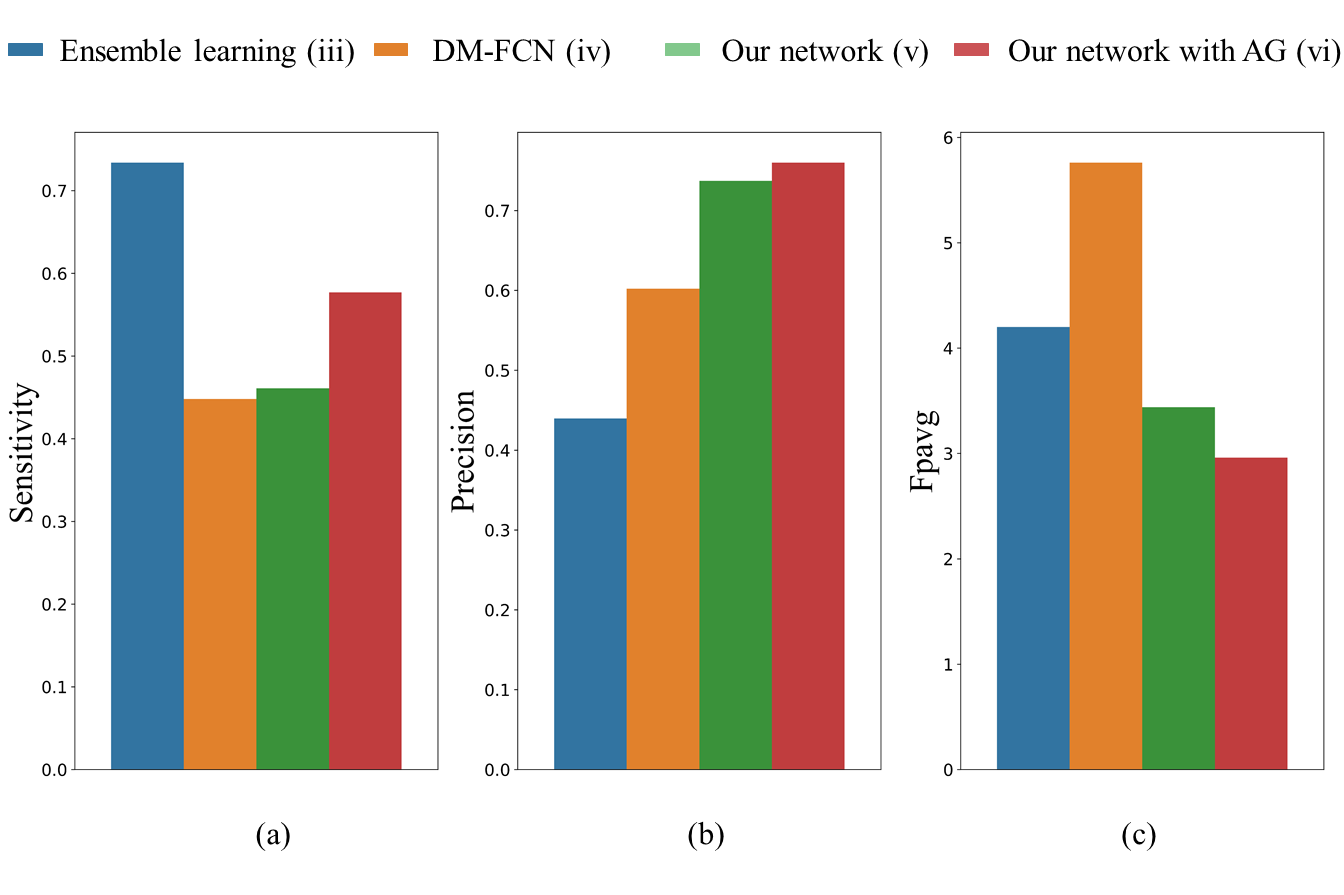
Figure 3. Detection results of our method in comparison to the baselines. (a) Ensemble learning achieves the best sensitivity, which needs enormous computation time and hence is not very practical. (b) Our network with the attention gate performs the best on precision to 0.7600 and (c) FPavg to 2.96. (FPavg is the number of false positives per image). Note that although method (iii) achieves the best sensitivity, this approach that classifies nearly every patch cropped around voxels that have a similar intensity to lesions needs enormous computation time and hence is not very practical.
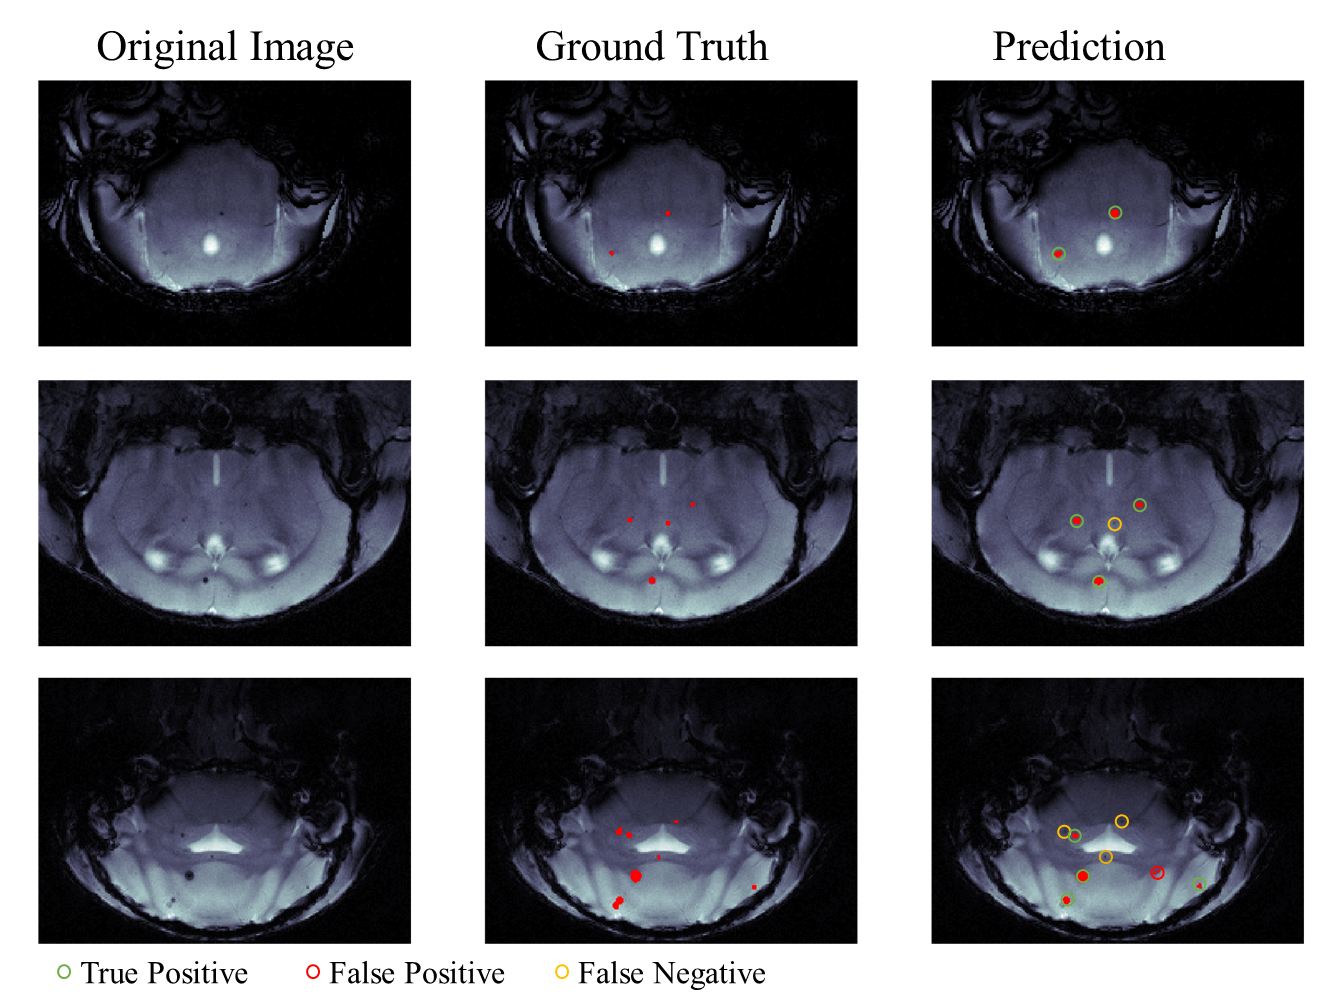
Figure 4. Representative detection results. In the prediction image (right column): green circle for true positive, red circle for false positive and orange circle for false negative.