1199
Evaluation of cellular sensitivity for magnetic particle imaging and fluorine-19 magnetic resonance imaging1Imaging Research Laboratories, Robarts Research Institute, London, ON, Canada, 2Medical Biophysics, University of Western Ontario, London, ON, Canada
Synopsis
Fluorine-19 (19F) MRI and magnetic particle imaging (MPI) are both quantitative modalities used for cell tracking. We evaluated the cellular sensitivity of MPI using ferucarbotran on a preclinical MPI system and 19F MRI using perfluorocarbons on a 3 Tesla clinical system. For both modalities, significant linear increases in 19F and MPI signal were detected with increasing number of mesenchymal stem cells (MSC). As few as 4000 MSC were reliably detected with MPI and 256 x 103 MSC with 19F MRI using the same scan time (1.5 minutes/cell pellet). Both of these detection limits were improved with longer imaging times.
Introduction
Magnetic resonance imaging (MRI) and magnetic particle imaging (MPI) both allow for in vivo cell tracking. Fluorine-19 (19F) MRI and MPI provide positive contrast images with signal that is directly quantitative1,2. 19F MRI relies on perfluorocarbon (PFC) labeling of cells and allows for quantification of 19F atoms and estimation of cell number, with knowledge of 19F cellular loading by 19F NMR1. At 3T, our group has demonstrated a cellular detection limit of 25,000 PFC-labeled macrophages3. MPI directly detects superparamagnetic iron oxide nanoparticles (SPIONs) and allows for quantification of iron mass. The SPION type strongly influences sensitivity for MPI. For ferucarbotran, the detection of as few as 1000 stem cells has been reported4. These two quantitative cell tracking methods have not been carefully compared. Our objective is to assess the sensitivity of 19F MRI and MPI for cell tracking by imaging and quantifying different numbers of labeled mesenchymal stem cells (MSC) and 4T1 breast cancer cells.Methods
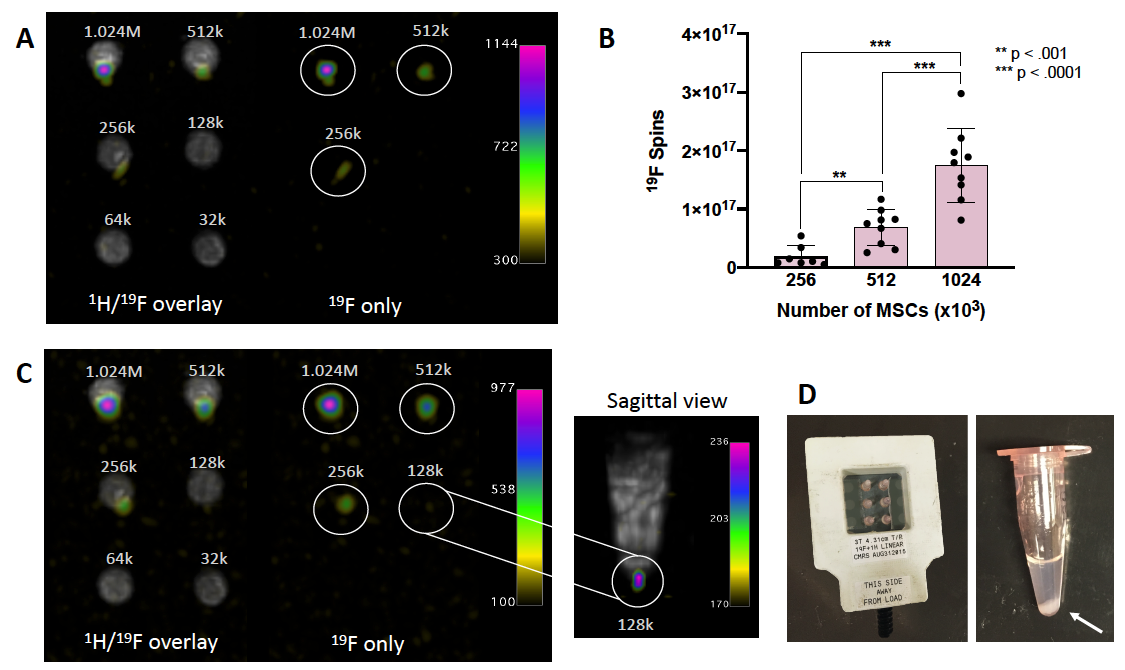
Cell labeling: MSC and 4T1 cells were labeled with 55μg Fe/mL ferucarbotran (Magnetic Insight Inc.) and transfection agents5. MSC were also labeled with 2.5 mg/mL PFC (CelSense Inc.) by coincubation. Labeled cells were washed 3x and collected as cell pellets in triplicates of 1024, 512, 256, 128, 64, 32, 16, 8, 4, 2, 1 (x103) cells. This was repeated two more times (n = 9 per cell number).Imaging: MPI of cell pellets were acquired on a MomentumTM scanner (Magnetic Insight Inc.) (Figure 1B) in 2D in 1.5 minutes/pellet. 3D images were acquired of low cell numbers to improve MPI sensitivity (22.8 minutes/pellet). MPI signal from known amounts of ferucarbotran was measured to create a calibration line (Figure 1C). This line is used to calculate iron content (μg) from MPI signal generated by MSC and 4T1 cells. 19F MRI of PFC-labeled MSC pellets were acquired on a 3T clinical MRI using a 4.3 cm dual-tuned surface coil (Figure 1A) and a 3D balanced steady state free precession (bSSFP) sequence, with imaging times of 1.5 minutes/pellet (matched to MPI scan time) and 4.5 minutes/pellet. The number of 19F spins in cell pellets was calculated by comparison to signal generated from reference tubes (with known 19F content) included in the imaging field of view.
Validation: The iron mass per cell was assessed using inductively coupled plasma mass spectrometry (ICP-MS) and visualized with Perl’s Prussian blue (PPB) stain. The number of 19F spins per cell was measured using 19F NMR and cells were assessed with microscopy to identify PFC nanodroplets.
Results
MPI signal (and iron content) was strongly correlated with cell number for ferucarbotran-labeled 4T1 cells and MSC (Figure 2A). Here the slope of the line was significantly higher for MSC (11.97) compared to 4T1 cells (6.02) (ANCOVA, p < .0001). Higher MPI cellular sensitivity was seen in MSC compared to 4T1 cells owing to enhanced ferucarbotran labeling validated by ICP-MS (Figure 2B) and PPB (Figure 2C). 2D MPI of 2 – 1024 x 103 4T1 cells and MSC are shown in Figure 3A,B and 4A,B. As few as 8000 4T1 cells (measured 68 ± 26 ng iron) and 4000 MSC (measured 70 ± 25 ng iron) could be reliably detected and quantified in 2D. Improved sensitivity was seen in 3D; 4000 4T1 cells (Figure 3C, 8/9 replicates, SNR = 5.89) and as few as 1000 MSC (Figure 4C, 2/9 replicates, SNR = 4.69) were detected. In 19F images (Figure 5A), the range of 256 – 1024 x 103 MSC were detectable and 19F signal was strongly correlated with cell number (Figure 2D). With longer scan times we detected as few as 128 x 103 MSC in 2 of 9 replicates with SNR = 6.22 (Figure 5C). MSC were loaded with 3.52 ± 1.55 x 10¹¹ 19F atoms/cell (Figure 2E).Discussion
We have evaluated cellular sensitivity for 19F MRI and MPI. We consider these measurements of lowest cell number detected as a baseline for making improvements to cellular sensitivity. Sensitivity can be improved by increasing cellular uptake of PFC/SPIONs and using optimized versions of these cell labels2,6,7. Different cells have different uptake of PFC/SPIONs; we observed enhanced MPI detectability of MSCs compared to 4T1 cells due to higher SPION labeling. Sensitivity can also be improved through optimized imaging parameters, which are entirely different for MRI and MPI. We acquired 19F images using a dual-tuned RF coil and 3D bSSFP sequence; these played a major role in our ability to detect PFC-labeled cells. MPI was conducted using weak gradients (3.0 T/m) to enhance sensitivity. Importantly, we showed there are significant linear increases in 19F and MPI signal with increasing cell number.Conclusion
It is essential to understand and improve cellular sensitivity to advance imaging of cellular therapeutics. In this study, fewer MSC were detected with MPI than 19F MRI using the same scan time. However, it is impossible to directly compare cell detection with MPI and 19F MRI due to their inherent differences. 19F MRI and MPI cell tracking can both be used to determine cell number in vivo and there is no doubt that cellular sensitivity for these modalities will continue to improve with further developments.Acknowledgements
We acknowledge the Natural Sciences and Engineering Research Council (NSERC) and the Molecular Imaging Graduate Program (University of Western Ontario) for supporting this project. Thank you to Trevor Wade, PhD. for assistance with 19F MRI optimization required for this project.
References
1. Ahrens, E. T. & Bulte, J. W. M. Tracking immune cells in vivo using magnetic resonance imaging. Nat. Rev. Immunol. 13, (2013).
2. Sehl, O. C., Gevaert, J. J., Melo, K. P., Knier, N. N. & Foster, P. J. A perspective on cell tracking with magnetic particle imaging. Tomography 6, (2020).
3. Makela, A. V. & Foster, P. J. Preclinical 19F MRI cell tracking at 3 Tesla. Magn. Reson. Mater. Physics, Biol. Med. (2018). doi:10.1007/s10334-018-0715-7
4. Zheng, B. et al. Magnetic particle imaging tracks the long-term fate of in vivo neural cell implants with high image contrast. Sci. Rep. 5, 1–9 (2015).
5. Thu, M. S. et al. Self-Assembling Nanocomplexes by combining Ferumoxytol, Heparin And Protamine For Cell Tracking. Nat. Med. 18, 463–467 (2012).
6. Srinivas, M., Boehm-Sturm, P., Figdor, C. G., de Vries, I. J. & Hoehn, M. Labeling cells for in vivo tracking using 19F MRI. Biomaterials 33, 8830–8840 (2012).
7. Amiri, H. et al. Cell tracking using 19F magnetic resonance imaging: Technical aspects and challenges towards clinical applications. European Radiology 25, (2014).
Figures